2011
PATTERNS AND TRENDS
IN UK HIGHER EDUCATION
1
Contents
Introduction ... 2
Index of tables and charts ... 5
Section A ... 5
Section B ... 5
Appendices ... 6
Section A: Trends in UK higher education ... 7
Student numbers ... 7
Students by gender ... 13
Students by subject ... 15
Trends in EU and international students ... 21
Trends in income ... 24
Section B: Patterns of institutional diversity ... 27
Balance of provision ... 27
Student characteristics ... 32
Student outcomes ... 37
Staffing ... 40
Financial security ... 42
Patterns of income ... 45
Expenditure and efficiency ... 52
2
Introduction
Patterns and trends in UK higher education
This report – Patterns and trends in UK higher education – builds on the time series data produced annually since 2001 under the title Patterns of higher education institutions in the UK.It offers a unique overview of provision at publicly-funded higher education institutions in the UK. All charts and tables in the report are now also available to download from the Universities UK website1.
Section A shows sector-level trends over the last 10 years from 2000/01 to 2009/10. For the first time, this offers a true time series provided by the Higher Education Statistics Agency (HESA), accounting for changes to the way student numbers are counted.
Section B looks at patterns of institutional diversity covering students, staff and finance.
The report provides a very helpful insight into high-level trends during a decade of significant expansion and change. Among other things, the report tracks the rise of student numbers, the changing popularity of different subject areas, and a notable shift in the funding regime. It also demonstrates how higher education institutions continue to make a large contribution to civil society and the economy in the UK.
The higher education student population
UK higher education institutions together educate some 2.5 million students annually, including over 400,000 from outside the UK, making the higher education sector one of the most important export earners for the UK economy. The last 10 years has seen significant expansion, with a 28 per cent increase in student numbers from all domiciles.
As in previous years female students studying higher education at UK higher education institutions remain in the majority, accounting for 56.6 per cent of all students in 2009/10. This pattern is also present for all levels and modes of study other than full-time postgraduate provision, where males account for the majority of students since 2008/09.
How are students choosing to study?
Since 2000/01, full-time postgraduate numbers have increased by 73.1 per cent compared with an increase of 28.5 per cent for full-time undergraduates over the same period. This is partly due to the rate of increase in non-UK students, who tend to study at postgraduate level.
For all UK countries other than Scotland, growth in full-time undergraduate provision was higher than that seen for part-time undergraduate provision between 2000/01 and 2009/10.
The last year has seen minor changes in the distribution of students amongst institutions. There have been slight decreases in the proportion of other undergraduate, part-time and mature full-time students across the range of institutions compared to 2008/09, despite increases in the absolute number of students in most of these groups. Part of this trend could be due to the greater increase in non-UK students, who tend to be younger and study full-time and postgraduate-level courses.
EU and international students
One of the main trends over the last 10 years has been the success of UK higher education institutions in attracting international students. Since 2000/01, the number of non-EU students has more than doubled, with an increase of 11.7 per cent in the last year. Although this is approximately four times the
1
3 equivalent increase in UK-domiciled students it should be noted that the UK’s share of the international student market has reduced over this period, with other countries becoming more competitive in
attracting these students. This trend does not include the impact of recent changes to non-EU student visas, which may result in a greater loss of market share in the future.
China (excluding Hong Kong, Taiwan and Macao) continues to provide the highest numbers of
international students on first degree, postgraduate research and other undergraduate courses and the second highest numbers on postgraduate taught courses. India provided the highest numbers on postgraduate taught courses. Although overall numbers have increased, there were no significant changes in the top 20 countries across levels from the previous year.
The concentration of non-EU students across institutions remains at a similar level to last year, with recent increases in the number of EU students concentrated mostly in those institutions with smaller numbers of these students.
What are students studying?
Between 2003/04 and 2009/10 student numbers increased by 13.3 per cent across all subjects. There have, however, been significant changes in the relative popularity of different subject areas. Over the period, large increases are seen in students studying clinical and biological sciences, mathematics, physical sciences, and architecture, building and planning. The only subjects to see decreases in the absolute number of students between 2003/04 and 2009/10 are computer science and historical and philosophical studies. Both, however, show increases in the last year.
Employment of graduates
Employment rates six months after graduation remain high across the sector, with 80 per cent of
institutions showing between 86 per cent and 94 per cent of their students recorded as in employment or further study six months after graduation. The impact of the recession is evident, however, with small decreases across the sector in the proportion of students in employment or further study over the last year. It should be noted that recent analysis by the Organisation for Economic Co-operation and
Development (OECD) and the Office for National Statistics demonstrates that graduates have been less impacted by the effects of the recession than those with lower qualifications.
Trends in income
In 2009/10 higher education institutions had a combined turnover of £26.8 billion. Tuition fees and education contracts accounted for 31 per cent of total income, compared to 23 per cent in 2000/01. Between 2008/09 and 2009/10, income from research grants and contracts rose 4.6 per cent, to £4.3 million. 142 institutions posted a surplus in 2009/10.
The level of long-term borrowing compared to total income varied significantly across the sector, ranging from a lower decile of 0 per cent to an upper decile of 44 per cent. Four institutions showed levels of long-term borrowing above 70 per cent of total income in 2009/10.
In line with trends in recent years, the level of income from funding body grants has decreased across institutions since 2008/09 at similar rates for those institutions with high and low proportions of income from this source.
The impact of the recession is evident in a number of indicators, most clearly in the 38.6 per cent
These are just a few of the many interesting observations to be found in Patterns and trends in UK higher education, which contains a great deal of rich and informative material. Readers will, I am sure, find much to interest them beyond these brief highlights.
Professor Paul O’Prey
Vice-Chancellor of the University of Roehampton and Chair, Universities UK Longer Term Strategy Network
October 2011
Index of tables and charts
5
Section B
2.1 Percentage of postgraduate students by institution 2009/10 28
2.2 Number of postgraduate students by institution 2009/10 28
2.3 Number of undergraduate students by institution 2009/10 29
2.4 Percentage of other undergraduate students by institution 2009/10 29
2.5 Percentage of part-time students by institution 2009/10 30
2.6 Number of non UK-domiciled students by institution 2009/10 31
2.7 Number of non EU-domiciled students by institution 2009/10 31
2.8 Number of EU (excluding UK)-domiciled students by institution 2009/10 32
2.9 Percentage of mature full-time undergraduate students by institution 2009/10 33
2.10 Percentage of male students by institution 2009/10 33
2.11 Percentage of UK-domiciled first year ethnic minority students by institution 2009/10 34 2.12 Percentage of young full-time first degree entrants from NS-SEC classes 4, 5, 6 and 7 by institution 2009/10
35
2.13 Percentage of young, full-time, first degree students from state schools by institution 2009/10
36
2.14 Average tariff points of entrants to full-time undergraduate courses by institution 2009/10
37
2.15 Percentage of first-class degrees awarded by institution 2009/10 38
2.16 Percentage of first and upper second-class degrees awarded by institution 2009/10 38 2.17 Percentage of UK-domiciled, first degree, full-time leavers not unemployed by
institution 2009/10
39
2.18 Number of cost centres within which academic staff are employed by institution 2009/10
40
2.19 Percentage of female academic staff by institution 2009/10 41
2.20 Percentage of ethnic minorities among academic staff by institution 2009/10 41
2.21 Surplus/deficit as a percentage of income by institution 2009/10 42
2.22 Days ratio of net liquidity to total expenditure (excluding depreciation) 2009/10 43 2.23 Days ratio of total general funds to total expenditure by institution 2009/10 43 2.24 Percentage ratio of total long-term borrowings to total income by institution 2009/10 44
2.25 The Security Index 2011 45
Section A
1.1 Higher education students by mode of study, level of study, country of institution and type of institution 2009/10
8
1.2 Students by academic year and country of institution 9
1.3 Students by mode of study, level of study and country of institution 2009/10 9 1.4 Students by academic year, level of study, mode of study and country of institution 11
1.5 Students by level of study 2009/10 12
1.6 Change over time in undergraduate and postgraduate numbers by mode of study, level of study and country of institution
13
1.7 Students by academic year, mode of study, level of study and gender 14
1.8 Percentage of male students by academic year, mode of study and level of study 15
1.9 Change over time in student numbers by subject area 16
1.10 Percentage change in student numbers by subject area between 2003/04 and 2009/10 17 1.11 Percentage of full-time first degree students by subject area and academic year 20
1.12 Change over time in student numbers by domicile 22
1.13 Major countries supplying non-UK students to UK higher education institutions by level of study 2009/10
23
1.14 Income of higher education institutions by source of income 2009/10 (£ thousands) 25 1.15 Main sources of income received by academic year and country of institution (£
thousands)
6
2.26 Percentage ratio of total funding body grants to total income by institution 2009/10 46 2.27 Percentage ratio of recurrent teaching grants from funding bodies for higher education provision to total income by institution 2009/10
46
2.28 Funding of research through the dual support system (£ thousands) by institution 2009/10
47
2.29 Funding of research through the dual support system as a percentage of total income by institution 2009/10
48
2.30 Research grants and contracts as a percentage of funding council research grant by institution 2009/10
49
2.31 Income for other services rendered (£ thousands) by institution 2009/10 50
2.32 Income from non-EU student fees (£ thousands) by institution 2009/10 51
2.33 Income from non-EU student fees as a percentage of total income by institution 2009/10
51
2.34 Ratio of staff payroll costs to total income by institution 2009/10 52
2.35 Administrative expenditure per full-time equivalent student (£) by institution 2009/10 53 2.36 Academic departmental costs per full-time equivalent student, excluding academic staff (£) by institution 2009/10
53
2.37 Total academic services expenditure per full-time equivalent student (£) by institution 2009/10
54
2.38 Premises expenditure per full-time equivalent student (£) by institution 2009/10 54
Appendices
Appendix 1 – Students by mode of study, level of study and country of institution 2009/10 55
Appendix 2 – Students by subject of study and academic year 56
Appendix 3 – Non UK-domiciled students by country of domicile and level of study 2009/10 60 Appendix 4 – Income of higher education institutions by academic year, source of income
and country of institution (£ thousands)
65
Appendix 5 – Administrative expenditure per full-time equivalent student (£) by institution 2008/09
67
Appendix 6 – Academic departmental costs per full-time equivalent student, excluding academic staff costs (£) by institution 2008/09
67
Appendix 7 – Total academic services expenditure per full-time equivalent student (£) by institution 2008/09
68
Appendix 8 – Premises expenditure per full-time equivalent student (£) by institution 2008/09
68
7
Section A: Trends in UK higher education
This section considers some of the major trends in higher education in the United Kingdom (UK) during the last 10 years. A true time series of data is used in this report, allowing comparisons to be made over this period2. For this reason, some of the figures in this publication may not completely align with figures published by HESA elsewhere.
The finance data in this section has been drawn from the HESA publications3 Finances of Higher Education Institutions 2009/10 and Resources of Higher Education Institutions 2000/01 and 2008/09. Changes in the subject of study coding structure used by HESA and the introduction of a new subject apportionment method4 from 2002/03 onwards, coupled with a change in coding policy by one institution relating to the combined subject area, means that a consistent time series of student data by subject of study could only be produced for a seven-year period. During this time, there was a further change in the subject of study coding frame in 2007/08 which, although minor, means that subject level data prior to 2007/08 is not directly comparable with that from 2007/08 onwards.
In 2009/10 there were 165 publicly-funded higher education institutions in the UK. This report covers data on these 165 institutions in receipt of funding from the funding councils, together with The University of Buckingham. This excludes data for the University of Wales (central functions), which has staff but no students.
All figures quoted in this report which relate to student and staff numbers have been rounded to the nearest five in accordance with HESA data protection protocols. All percentages have been calculated using the raw figures and rounded to a fixed number of decimal places. It follows that some rows and columns presented in the tabulations may not sum precisely.
Student numbers
In 2009/10 there were 2.49 million students studying for a higher education qualification or for higher education credit at higher education institutions in the UK. An additional 59,835 students were known to be studying at further education level at UK higher education institutions, although this is likely to be an undercount as institutions are no longer required to return their further education data to HESA. Data on further education students at higher education institutions has therefore been excluded from the
remainder of this report.
It should be noted that students can also study for higher education qualifications at further education institutions. Figures on higher education students studying at further education institutions have been included in Table 1.1, but excluded from the remainder of the tabulations as this data is not part of the standard HESA student record.
Table 1.1 shows the number and proportion of higher education students studying at higher education and further education institutions. It can be seen that higher numbers of higher education students study in further education institutions in Scotland and Northern Ireland compared to England and Wales. Across the UK the overall proportion of higher education provision found at further education institutions decreased from 6.3 per cent in 2008/09 to 6.2 per cent in 2009/10. This decrease has been more marked since 2001/02 when 9.7 per cent of higher education provision was located in further education institutions.
2
Student data across the time series has been based on the 2009/10 definition of the HESA standard registration population, excluding students on sabbatical and writing-up students.
3
HESA publications are published by the Higher Education Statistics Agency Limited, 95 Promenade, Cheltenham, GL50 1HZ, telephone +44 (0) 1242 255577. Further details are available at http://www.hesa.ac.uk/products/pubs/home.htm
4
At a country level England saw a decrease in the proportion of higher education provision at further education institutions over the last academic year, from 4.8 per cent in 2008/09 to 4.6 per cent in
2009/10. Scotland and Northern Ireland both saw increases over the same period, from 18.3 per cent to 18.6 per cent and 17.6 per cent to 18.3 per cent respectively.
Part-time provision accounts for the majority of higher education students at further education colleges, where 64.6 per cent of provision is part time compared to 35.4 per cent at higher education institutions. The proportion of part-time higher education provision found in further education institutions varies amongst the countries of the UK, with 9.5 per cent of part-time provision in England found in further education institutions compared to 2.1 per cent in Wales, 25.4 per cent in Scotland and 30.9 per cent in Northern Ireland.
A 2009/10 HESA survey of higher education provision at private providers, not included within the HESA student record, showed that approximately 38,000 higher education students were taught at these types of institution5.
England Wales Scotland
Northern Ireland
United Kingdom
Higher education institutions
Full-time 1,345,665 88,015 162,955 35,520 1,632,155
Part-time 747,965 39,870 57,955 15,470 861,260
Total 2,093,635 127,885 220,910 50,990 2,493,415
Further education institutions
Full-time 22,215 525 30,620 4,475 57,835
Part-time 78,240 855 19,695 6,930 105,720
Total 100,455 1,380 50,315 11,400 163,555
All institutions
Full-time 1,367,885 88,540 193,575 39,995 1,689,990
Part-time 826,205 40,725 77,650 22,395 966,980
Total 2,194,090 129,270 271,220 62,390 2,656,970
Percentage in further education institutions 4.6% 1.1% 18.6% 18.3% 6.2%
1.1 Higher education students by mode of study, level of study, country of institution and type of institution 2009/10
Source: HESA Student Record 2009/10, The Data Service, Lifelong Learning Wales Record (LLWR), Scottish Funding Council (SFC), Department for Employment and Learning Northern Ireland (DEL(NI))
In this table 0, 1, 2 are rounded to 0. All other numbers are rounded up or dow n to the nearest multiple of 5. Percentages are not subject to rounding.
Table 1.2 provides a consistent 10-year time series of higher education student numbers by country of institution. Over the last 10 years the number of students studying at UK higher education institutions has been gradually increasing, from 1.9 million in 2000/01 to 2.5 million in 2009/10 – an overall increase of 28 per cent. Between 2008/09 and 2009/10 the overall number of students, from all domiciles, at UK higher education institutions increased by 4.1 per cent. It should be noted that over this period non-EU student numbers increased by 11.7 per cent, compared to a three per cent increase in numbers from UK-domiciled students and a 6.3 per cent increase in EU-UK-domiciled students.
8
5
England
Percentage
of UK total Wales
Percentage
of UK total Scotland
Percentage of UK total
Northern Ireland
Percentage of UK total
United Kingdom
2009/10 2,093,635 84.0% 127,885 5.1% 220,910 8.9% 50,990 2.0% 2,493,415
2008/09 2,005,840 83.7% 126,475 5.3% 215,495 9.0% 48,240 2.0% 2,396,050
2007/08 1,922,180 83.4% 125,540 5.4% 210,180 9.1% 48,200 2.1% 2,306,105
2006/07 1,912,050 83.0% 128,230 5.6% 215,560 9.4% 48,860 2.1% 2,304,700
2005/06 1,894,835 83.1% 125,715 5.5% 207,840 9.1% 52,845 2.3% 2,281,235
2004/05 1,856,930 83.0% 123,645 5.5% 202,760 9.1% 52,930 2.4% 2,236,265
2003/04 1,831,890 83.3% 118,610 5.4% 198,650 9.0% 51,025 2.3% 2,200,175
2002/03 1,774,540 83.3% 116,465 5.5% 190,980 9.0% 49,125 2.3% 2,131,110
2001/02 1,694,410 83.0% 110,295 5.4% 190,725 9.3% 47,155 2.3% 2,042,580
2000/01 1,623,735 83.3% 104,745 5.4% 174,250 8.9% 45,400 2.3% 1,948,135
Source: HESA Student Record 2000/01-2009/10
In this table 0, 1, 2 are rounded to 0. All other numbers are rounded up or dow n to the nearest multiple of 5. Percentages are not subject to rounding.
1.2 Students by academic year and country of institution
Chart 1.3a and Table 1.3b (sourced from Appendix 1) illustrate the composition of students in 2009/10 in terms of level of study and mode of study, again by country of institution. It can be seen that the
proportion of students studying full-time first degree courses in England is slightly below levels seen in other countries of the UK. England does, however, show higher proportions studying part-time first degree courses in 2009/10, with 9.3 per cent of students on these courses compared to 3.1 per cent in Wales, 4.7 per cent in Scotland and 6.4 per cent in Northern Ireland.
0% 10% 20% 30% 40% 50% 60% 70% 80% 90% 100%
England Wales Scotland Northern Ireland
United Kingdom
1.3a Students by mode of study, level of study and country of institution 2009/10
Part-time other undergraduate Full-time other undergraduate Part-time first degree
Full-time first degree Part-time postgraduate Full-time postgraduate
Source: HESA Student Record 2009/10
England Wales Scotland
Northern Ireland
United Kingdom
Full-time other undergraduate 5.4% 4.1% 3.0% 0.7% 5.0% Part-time other undergraduate 15.2% 17.1% 10.3% 11.9% 14.8% Full-time first degree 46.9% 53.6% 57.6% 59.2% 48.5% Part-time first degree 9.3% 3.1% 4.7% 6.4% 8.5% Full-time postgraduate 11.9% 11.2% 13.2% 9.8% 12.0% Part-time postgraduate 11.2% 11.0% 11.2% 12.0% 11.2% All students 100.0% 100.0% 100.0% 100.0% 100.0%
Source: HESA Student Record 2009/10
1.3b Students by mode of study, level of study and country of institution 2009/10
The use of a true time series in this report means that it is possible to compare trends on an entirely consistent basis. Table 1.4 provides a breakdown of student numbers by level of study, mode of study and country of institution for the last two years with a comparison against 2000/01.
In 2009/10 there were 2.49 million students enrolled at UK higher education institutions, of which 1.91 million were studying at undergraduate level and 578,705 at postgraduate level.
Across the UK the proportion of provision accounted for by postgraduate study has increased from 20.9 per cent in 2000/01 to 23.2 per cent in 2009/10. This increase is present across all countries of the UK and is particularly evident in Wales, which showed an increase from 16.4 per cent to 22.1 per cent over the same period.
England Wales Scotland
Northern Ireland
United Kingdom
2009/10
Postgraduate
Full-time 249,865 14,265 29,120 5,005 298,255
Part-time 235,465 14,050 24,805 6,130 280,450
Postgraduate total 485,335 28,315 53,925 11,135 578,705
Undergraduate
Full-time 1,095,800 73,750 133,835 30,515 1,333,900
Part-time 512,500 25,825 33,150 9,340 580,810
Undergraduate total 1,608,300 99,570 166,985 39,855 1,914,710
All students
Full-time 1,345,665 88,015 162,955 35,520 1,632,155
Part-time 747,965 39,870 57,955 15,470 861,260
Total 2,093,635 127,885 220,910 50,990 2,493,415
2008/09
Postgraduate
Full-time 222,955 12,545 27,755 4,745 268,000
Part-time 226,360 13,020 23,900 5,535 268,815
Postgraduate total 449,315 25,565 51,655 10,280 536,810
Undergraduate
Full-time 1,044,720 68,445 129,065 29,800 1,272,030
Part-time 511,805 32,465 34,775 8,160 587,205
Undergraduate total 1,556,525 100,910 163,840 37,960 1,859,240
All students
Full-time 1,267,675 80,990 156,820 34,545 1,540,030
Part-time 738,165 45,485 58,675 13,695 856,020
Total 2,005,840 126,475 215,495 48,240 2,396,050
2000/01
Postgraduate
Full-time 144,475 7,830 16,020 3,960 172,285
Part-time 200,855 9,395 18,855 5,520 234,620
Postgraduate total 345,330 17,225 34,875 9,480 406,905
Undergraduate
Full-time 839,670 58,015 114,260 25,935 1,037,880
Part-time 438,735 29,510 25,115 9,990 503,350
Undergraduate total 1,278,410 87,520 139,375 35,925 1,541,225
All students
Full-time 984,150 65,845 130,280 29,895 1,210,165
Part-time 639,590 38,900 43,970 15,510 737,970
Total 1,623,735 104,745 174,250 45,400 1,948,135
1.4 Students by academic year, level of study, mode of study and country of institution
In this table 0, 1, 2 are rounded to 0. All other numbers are rounded up or dow n to the nearest multiple of 5. Source: HESA Student Record 2000/01, 2008/09, 2009/10
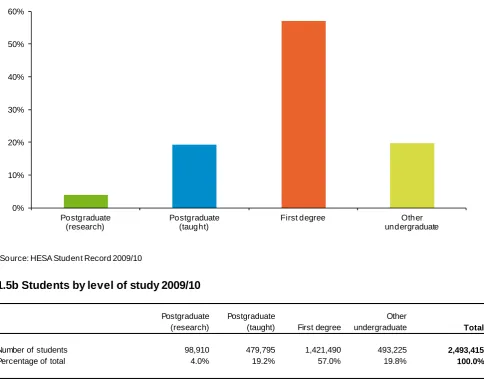
Chart 1.5a and Table 1.5b illustrate the proportions of all students at UK higher education institutions by level of study in 2009/10. Over half (57 per cent) were studying at first degree level and a further 19.8 per cent were studying towards an undergraduate qualification other than a first degree (other
undergraduate qualification). The remaining students were studying postgraduate taught and postgraduate research courses, 19.2 per cent and four per cent respectively.
0% 10% 20% 30% 40% 50% 60%
Postgraduate (research)
Postgraduate (taught)
First degree Other undergraduate
1.5a Students by level of study 2009/10
Source: HESA Student Record 2009/10
Postgraduate (research)
Postgraduate
(taught) First degree
Other
undergraduate Total
Number of students 98,910 479,795 1,421,490 493,225 2,493,415
Percentage of total 4.0% 19.2% 57.0% 19.8% 100.0%
Source: HESA Student Record 2009/10
In this table 0, 1, 2 are rounded to 0. All other numbers are rounded up or dow n to the nearest multiple of 5. Percentages are not subject to rounding.
[image:14.595.48.533.67.447.2]1.5b Students by level of study 2009/10
Table 1.6 shows the percentage change in student numbers by mode and level of study and country of institution over the last 10 years, with a comparison against 2008/09.
The largest increases over the last 10 years can be seen in full-time postgraduate numbers, which have increased by 73.1 per cent since 2000/01 compared with an increase of 28.5 per cent for full-time undergraduates over the same period. Large increases in part-time postgraduate numbers were also seen in Wales and Scotland, where numbers increased by 49.5 per cent and 31.5 per cent over the last 10 years respectively. It should be noted that these numbers include students from all domiciles and therefore the above average increases in non-EU students over the period, the majority of whom study at postgraduate level, will have been a factor in these increases.
In contrast, part-time numbers have increased at a slower rate over the last 10 years for the UK as a whole, with part-time undergraduate numbers in fact decreasing in both Wales and Northern Ireland since 2000/01. For all countries other than Scotland, growth in full-time undergraduate provision was higher than for part-time undergraduate provision.
Over the last year full-time postgraduate numbers have increased by 11.3 per cent, over twice the rate of full-time undergraduates at 4.9 per cent. Full-time numbers have increased at a faster rate in England and Wales than in the rest of the UK. Part-time undergraduate numbers decreased by 1.1 per cent for the UK as a whole, with decreases in Wales and Scotland of 20.5 per cent and 4.7 per cent respectively. The level of undergraduate part-time provision in England remained more or less static, growing by only 0.1 per cent between 2008/09 and 2009/10.
England Wales Scotland
Northern Ireland
United Kingdom
Percentage overall changes
Undergraduates 2000/01 to 2009/10 25.8% 13.8% 19.8% 10.9% 24.2% Undergraduates 2008/09 to 2009/10 3.3% -1.3% 1.9% 5.0% 3.0% Postgraduates 2000/01 to 2009/10 40.5% 64.4% 54.6% 17.5% 42.2% Postgraduates 2008/09 to 2009/10 8.0% 10.8% 4.4% 8.3% 7.8%
Percentage change in part-tim e num bers
Undergraduates 2000/01 to 2009/10 16.8% -12.5% 32.0% -6.5% 15.4% Undergraduates 2008/09 to 2009/10 0.1% -20.5% -4.7% 14.4% -1.1% Postgraduates 2000/01 to 2009/10 17.2% 49.5% 31.5% 11.1% 19.5% Postgraduates 2008/09 to 2009/10 4.0% 7.9% 3.8% 10.8% 4.3%
Percentage change in full-tim e num bers
Undergraduates 2000/01 to 2009/10 30.5% 27.1% 17.1% 17.7% 28.5% Undergraduates 2008/09 to 2009/10 4.9% 7.7% 3.7% 2.4% 4.9% Postgraduates 2000/01 to 2009/10 72.9% 82.2% 81.8% 26.4% 73.1% Postgraduates 2008/09 to 2009/10 12.1% 13.7% 4.9% 5.4% 11.3%
Source: HESA Student Record 2000/01, 2008/09, 2009/10
1.6 Change over time in undergraduate and postgraduate numbers by mode of study, level of study and country of institution
[image:15.595.46.526.102.347.2]Students by gender
Table 1.7 shows that a higher proportion of females than males were registered at UK higher education institutions in 2009/10; this applied across all levels and modes of study other than full-time
postgraduate, where males were in the majority. Higher proportions of part-time students than of full-time students were female. In terms of level of study, higher proportions of other undergraduates than of first degree and postgraduate students were female. This was true for both full-time and part-time students in 2009/10.
The overall proportion of females studying at UK higher education institutions increased from 56 per cent in 2000/01 to 56.6 per cent in 2009/10. The proportion of females studying part-time postgraduate
degrees increased from 53.6 per cent in 2000/01 to 58.2 per cent in 2009/10. The same period saw increases in the proportion of females studying full-time first degrees and part-time other undergraduate qualifications, with decreases in the proportion studying full-time postgraduate and other undergraduate and part-time first degree qualifications.
The last year has seen little change in the proportion of females at UK higher education institutions, with a slight overall decrease from 56.9 per cent to 56.6 per cent and small increases in full-time
postgraduates and part-time other undergraduates. Small decreases in the proportion of females were also seen in part-time postgraduate and first degree study, with a larger decrease in full-time other undergraduates.
Female
Percentage
female Male
Percentage
male Total
2009/10 Full-tim e
Postgraduate 146,980 49.3% 151,275 50.7% 298,255
First degree 657,835 54.4% 550,785 45.6% 1,208,620
Other undergraduate 79,290 63.3% 45,985 36.7% 125,275
Full-tim e total 884,105 54.2% 748,050 45.8% 1,632,155
Part-tim e
Postgraduate 163,340 58.2% 117,105 41.8% 280,445
First degree 125,105 58.8% 87,760 41.2% 212,865
Other undergraduate 239,635 65.1% 128,310 34.9% 367,945
Part-tim e total 528,080 61.3% 333,175 38.7% 861,255
2009/10 total 1,412,185 56.6% 1,081,225 43.4% 2,493,410
2008/09 Full-tim e
Postgraduate 131,815 49.2% 136,180 50.8% 267,995
First degree 624,430 54.5% 522,120 45.5% 1,146,550
Other undergraduate 82,030 65.4% 43,450 34.6% 125,480
Full-tim e total 838,275 54.4% 701,750 45.6% 1,540,025
Part-tim e
Postgraduate 156,625 58.3% 112,185 41.7% 268,810
First degree 121,965 59.4% 83,230 40.6% 205,195
Other undergraduate 246,945 64.6% 135,065 35.4% 382,010
Part-tim e total 525,535 61.4% 330,480 38.6% 856,015
2008/09 total 1,363,810 56.9% 1,032,230 43.1% 2,396,040
2000/01 Full-tim e
Postgraduate 85,215 49.5% 87,070 50.5% 172,285
First degree 486,555 53.1% 429,270 46.9% 915,825
Other undergraduate 78,845 64.6% 43,210 35.4% 122,055
Full-tim e total 650,615 53.8% 559,550 46.2% 1,210,165
Part-tim e
Postgraduate 125,855 53.6% 108,770 46.4% 234,620
First degree 61,535 60.5% 40,180 39.5% 101,715
Other undergraduate 253,215 63.0% 148,415 37.0% 401,635
Part-tim e total 440,605 59.7% 297,365 40.3% 737,970
2000/01 total 1,091,220 56.0% 856,915 44.0% 1,948,135
Source: HESA Student Record 2000/01, 2008/09, 2009/10
1Numbers and percentages exclude those students of indeterminate gender
1.7 Students by academic year, mode of study, level of study and gender1
In this table 0, 1, 2 are rounded to 0. All other numbers are rounded up or dow n to the nearest multiple of 5. Percentages are not subject to rounding.
Chart 1.8a and Table 1.8b illustrate how the proportion of male students studying at higher education institutions has changed over the last 10 years, with comparisons by level of study and mode of study. The lowest proportion of male students is found in full-time other undergraduate study for all years, except for 2009/10 where part-time other undergraduates show a slightly lower proportion. The highest proportion of male students can be found in full-time postgraduate study for all years between 2000/01 and 2009/10.
Only amongst full-time postgraduates did male students outnumber female students, by a small margin between 2000/01 and 2002/03 and again between 2008/09 and 2009/10.
30% 35% 40% 45% 50% 55%
2000/01 2001/02 2002/03 2003/04 2004/05 2005/06 2006/07 2007/08 2008/09 2009/10
1.8a Percentage of male students by academic year, mode of study and level of study
Full-time other undergraduate
Part-time other undergraduate
Full-time first degree
Part-time first degree
Full-time postgraduate
Part-time postgraduate
Source: HESA Student Record 2001/02-2009/10
Full-time other undergraduate
Part-time other undergraduate
Full-time first degree
Part-time first degree
Full-time postgraduate
Part-time postgraduate
2000/01 35.4% 37.0% 46.9% 39.5% 50.5% 46.4%
2001/02 35.0% 36.9% 46.8% 38.4% 50.3% 45.1%
2002/03 33.6% 35.4% 46.6% 39.3% 50.6% 44.5%
2003/04 33.1% 33.3% 46.3% 40.1% 49.9% 43.3%
2004/05 32.3% 33.9% 45.9% 39.5% 49.8% 43.1%
2005/06 31.5% 34.3% 45.7% 39.0% 49.3% 42.8%
2006/07 31.8% 34.6% 45.6% 39.3% 49.4% 42.4%
2007/08 33.4% 35.0% 45.5% 40.3% 49.9% 42.6%
2008/09 34.6% 35.4% 45.5% 40.6% 50.8% 41.7%
2009/10 36.7% 34.9% 45.6% 41.2% 50.7% 41.8%
Source: HESA Student Record 2000/01-2009/10
1.8b Percentage of male students by academic year, mode of study and level of study
Students by subject
There have been some significant changes in the subject definitions used by HESA over the last 10 years. In 2002/03, HESA introduced a new subject classification, aligning its subject codes with those used by the Universities and Colleges Admissions Service (UCAS). At the same time, in order to account for students studying more than one subject as part of their qualification, a new subject apportionment method was introduced, assigning students to one or more subjects according to the proportions studied. This provides a more accurate picture of overall registrations by subject of study, but does not allow comparative time series with data prior to 2002/03. Due to a change in coding policy of the use of the
combined subject code by one institution in 2003/04, this analysis provides subject time series data for the last seven years only.
It should also be noted that there was a further change in the subject coding frame in 2007/08 which, although minor, means that data prior to 2007/08 is not directly comparable with that from 2007/08 onwards. At the level of the 19 subject areas the change is minimal, with plant biotechnology and
[image:18.595.52.527.400.707.2]biotechnology moving from subject area biological sciences to subject area engineering and technology.
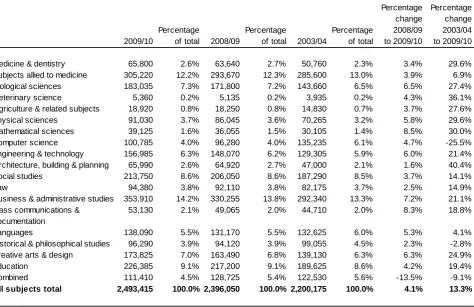
Table 1.9 provides a breakdown of student numbers by subject area studied for 2009/10, with
comparisons against 2008/09 and 2003/04. Since 2003/04, student numbers across all subjects have increased by 13.3 per cent.
Over the last seven years, architecture, building and planning, veterinary science and mathematical sciences show the biggest rise since 2003/04 at 40.4 per cent, 36.1 per cent and 30 per cent respectively. Mathematical sciences and mass communications and documentation have seen the biggest percentage increase since 2008/09. There has been a decrease in the absolute number of students studying computer science and historical and philosophical studies since 2003/04, at 25.5 per cent and 2.8 per cent respectively, although both have seen an increase since 2008/09.
Combined subject area has also seen a loss, although some of this may be due to continual changes in policy on the use of the combined subject as a stand-alone category. The smallest increases across the seven-year period were seen in languages (4.1 per cent) and subjects allied to medicine (6.9 per cent).
It should be noted that medicine and dentistry are quota-controlled subjects and this is reflected in the changes over the period in question.
2009/10
Percentage
of total 2008/09
Percentage
of total 2003/04
Percentage of total
Percentage change 2008/09 to 2009/10
Percentage change 2003/04 to 2009/10
Medicine & dentistry 65,800 2.6% 63,640 2.7% 50,760 2.3% 3.4% 29.6% Subjects allied to medicine 305,220 12.2% 293,670 12.3% 285,600 13.0% 3.9% 6.9% Biological sciences 183,035 7.3% 171,800 7.2% 143,660 6.5% 6.5% 27.4% Veterinary science 5,360 0.2% 5,135 0.2% 3,935 0.2% 4.3% 36.1% Agriculture & related subjects 18,920 0.8% 18,250 0.8% 14,830 0.7% 3.7% 27.6% Physical sciences 91,030 3.7% 86,045 3.6% 70,265 3.2% 5.8% 29.6% Mathematical sciences 39,125 1.6% 36,055 1.5% 30,105 1.4% 8.5% 30.0% Computer science 100,785 4.0% 96,280 4.0% 135,235 6.1% 4.7% -25.5% Engineering & technology 156,985 6.3% 148,070 6.2% 129,305 5.9% 6.0% 21.4% Architecture, building & planning 65,990 2.6% 64,920 2.7% 47,000 2.1% 1.6% 40.4% Social studies 213,750 8.6% 206,050 8.6% 187,290 8.5% 3.7% 14.1% Law 94,380 3.8% 92,110 3.8% 82,175 3.7% 2.5% 14.9% Business & administrative studies 353,910 14.2% 330,255 13.8% 292,340 13.3% 7.2% 21.1% Mass communications &
documentation
53,130 2.1% 49,065 2.0% 44,710 2.0% 8.3% 18.8%
Languages 138,090 5.5% 131,170 5.5% 132,625 6.0% 5.3% 4.1% Historical & philosophical studies 96,290 3.9% 94,120 3.9% 99,055 4.5% 2.3% -2.8% Creative arts & design 173,825 7.0% 163,490 6.8% 139,130 6.3% 6.3% 24.9% Education 226,385 9.1% 217,200 9.1% 189,625 8.6% 4.2% 19.4% Combined 111,410 4.5% 128,725 5.4% 122,530 5.6% -13.5% -9.1%
All subjects total 2,493,415 100.0% 2,396,050 100.0% 2,200,175 100.0% 4.1% 13.3%
Source: HESA Student Record 2003/04, 2008/09, 2009/10
1.9 Change over time in student numbers by subject area
In this table 0, 1, 2 are rounded to 0. All other numbers are rounded up or dow n to the nearest multiple of 5. Percentages are not subject to rounding.
Chart 1.10a and Table 1.10b illustrate the change in student numbers by subject area since 2003/04.
-30% -20% -10% 0% 10% 20% 30% 40% 50% Architecture, building & planning
Veterinary science Mathematical sciences Medicine & dentistry Physical sciences Agriculture & related subjects Biological sciences Creative arts & design Engineering & technology Business & administrative studies Education Mass communications & documentation Law Social studies Subjects allied to medicine Languages Historical & philosophical studies Combined Computer science All subjects total
1.10a Percentage change in students numbers by subject area between 2003/04 and 2009/10
Source: HESA Student Record 2003/04, 2009/10
Percentage change 2003/04 to 2009/10
Architecture, building & planning 40.4%
Veterinary science 36.1%
Mathematical sciences 30.0%
Medicine & dentistry 29.6%
Physical sciences 29.6%
Agriculture & related subjects 27.6%
Biological sciences 27.4%
Creative arts & design 24.9%
Engineering & technology 21.4%
Business & administrative studies 21.1%
Education 19.4%
Mass communications & documentation 18.8%
Law 14.9%
Social studies 14.1%
Subjects allied to medicine 6.9%
Languages 4.1%
Historical & philosophical studies -2.8%
Combined -9.1%
Computer science -25.5%
All subjects total 13.3%
Source: HESA Student Record 2003/04, 2009/10
1.10b Percentage change in student numbers by subject area between 2003/04 and 2009/10
18
Appendix 2 provides a full breakdown of all students by individual subject of study, using the 2009/10 subject labels.
Changes to the subject coding frame in 2007/08 had slightly more impact at individual subject level than at subject area level, so care should be taken when interpreting the time series data shown in Appendix 26.
With this caveat in mind, the following changes by subject of study between 2003/04 and 2009/10 can be seen:
• Numbers in medicine increased by 29.6 per cent over the period in question, which is above the overall increase of 13.3 per cent for all subjects. Changes in the structure of clinical degrees have led to a shift from pre-clinical to clinical studies.
• Subjects allied to medicine showed a below average increase of 6.9 per cent since 2003/04. This included a 4.4 per cent decrease in the number of students studying nursing, who accounted for 58.3 per cent of students in this subject area in 2009/10. Large increases were seen in
pharmacology, toxicology and pharmacy (50.2 per cent), complementary medicine (86.9 per cent) and nutrition (98 per cent) since 2003/04. Between 2008/09 and 2009/10 all subjects of study in this group saw increases apart from anatomy, physiology and pathology, which saw a 0.1 per cent decrease in student numbers.
• Within biological sciences there was considerable variation between 2003/04 and 2009/10 in the number of students studying certain subjects, with increases in the numbers studying general biology (17.1 per cent), zoology (8.3 per cent), sports science (73 per cent) and psychology (30.1 per cent) and decreases in botany (21.3 per cent), genetics (10.9 per cent) and microbiology (18.6 per cent). All subjects other than genetics (2.2 per cent decrease) saw increases between 2008/09 and 2009/10.
• Veterinary science showed an above average increase of 36.1 per cent between 2003/04 and 2009/10.
• All subjects under physical sciences, other than physical geographical sciences (15.4 per cent decrease) and broadly-based programmes within physical sciences (3.1 per cent decrease), saw increases since 2003/04. Large increases were particularly evident in forensic and archaeological science (157.6 per cent), science of aquatic and terrestrial environments (521.9 per cent) and astronomy (47 per cent). Since 2008/09 only materials science showed a small decrease (of 0.3 per cent).
• As in previous years mathematics continues to show increases from both 2003/04 (44.9 per cent) and 2008/09 (7.9 per cent). Statistics showed a below total increase of 11.1 per cent since
2003/04 but an above total increase of 11.9 per cent since 2008/09.
• Within computer science all subjects recorded decreases between 2003/04 and 2009/10, with particularly large decreases in information systems (34.5 per cent) and general computer science (23.3 per cent). Over the last year, however, all subjects showed increases, with software
engineering (9.1 per cent) and artificial intelligence (9.3 per cent) increasing at a greater rate than the total figure for all subjects.
• Overall numbers in engineering increased by 21.4 per cent since 2003/04 and six per cent since 2008/09, both above the increase seen for all subjects. Between 2003/04 and 2009/10 decreases were seen in production and manufacturing engineering, metallurgy, electronic and electrical engineering, and ceramics and glasses. Over the last year, ceramics and glasses and maritime technology showed decreases of 22.7 per cent and 4.9 per cent respectively.
6
19
• Although reporting increases in students since 2003/04, with particularly large increases in architecture and building architecture, building and planning showed a below total increase of 1.6 per cent between 2008/09 and 2009/10.
• All subjects within social studies showed an above total increase except for anthropology, which showed a below total increase of 6.3 per cent, and human and social geography, which
decreased by 18.9 per cent between 2003/04 and 2009/10. Since 2008/09 most subjects showed increases, but social policy showed a decrease of 2.5 per cent.
• Law showed an above total increase of 14.9 per cent since 2003/04 and a below total increase of 2.5 per cent between 2008/9 and 2009/10.
• Significant increases within business and administrative studies since 2003/04 were shown by management studies (42.2 per cent), finance (86.6 per cent), accounting (18.5 per cent) and marketing (13 per cent). Since 2008/09 only office skills showed a decrease in student numbers (of 8.5 per cent).
• Although overall increases in mass communications and documentation since 2003/04 and 2008/09 were close to the overall increase for all subjects, there was significant variation amongst subjects within this group, with large increases in journalism and media studies over both the last seven years and last year. In contrast, publishing saw a decrease in numbers since 2003/04.
• Languages showed the smallest increase in student numbers amongst subjects showing growth over the last seven years. Over the last year, however, the rate of increase has grown and is now above that seen for all subjects. Within languages significant decreases since 2003/04 were shown by Celtic, Latin, Classical Greek, Italian, Scandinavian and South Asian studies. Over the same period significant increases were shown by ancient language studies, classical studies, Chinese and Japanese.
• Historical and philosophical studies showed a small decrease in numbers since 2003/04 of 2.8 per cent, with a slight increase since 2008/09. Archaeology showed decreases over both the last seven years and the last year.
• Since 2003/04 numbers in creative arts and design have increased at a rate above that seen for all students. Over the same period, within creative arts and design, significant increases have been shown by music, dance, cinematics and photography, and imaginative writing.
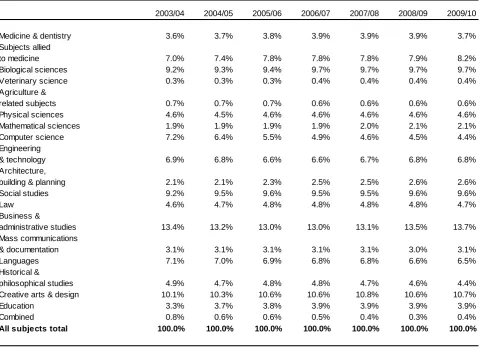
Chart 1.11a and Table 1.11b illustrate how the proportion of full-time first degree students studying each subject area has changed throughout the seven-year period.
The proportion of full-time degree students studying computer science has declined significantly over the period, with the rate of decline decreasing in recent years. A number of subjects – including subjects allied to medicine, biological sciences, architecture, building and planning, and creative arts and design – have shown a consistent increase over the period in question. Business and administrative studies saw a decrease in the proportion of full-time first degree students between 2003/04 and 2006/07. This then increased from 2007/08 to 2009/10.
0% 2% 4% 6% 8% 10% 12% 14% M e d ic in e & de nt is tr y S ubj ec ts al li e d to m e d ic in e B iol og ic a l s ci e n ce s V e te ri n a ry s ci en c e Ag ri c u lt ur e & rel at ed s ubj ec ts P h ysic a l sc ie n ce s M at h em at ic al s c ienc e s C o mp uter s ci enc e E n g ine er ing & te c hno lo g y Ar c h it e c tu re , bui ld ing & p lanni n g S o c ial s tudi es Law B u si n e ss & ad mi n is tr at iv e s tudi es Mas s c o mm uni cati ons & do c u m e nt a tio n Lan g uag es Hi s to ri c al & p h il os ophi cal s tudi es C reat iv e a rts & d e s ign E d uc at ion Co m b in e d
1.11a Percentage of full-time first degree students by subject area and academic year
2003/04 2004/05 2005/06 2006/07 2007/08 2008/09 2009/10
Source: HESA Student Record 2003/04-2009/10
2003/04 2004/05 2005/06 2006/07 2007/08 2008/09 2009/10
Medicine & dentistry 3.6% 3.7% 3.8% 3.9% 3.9% 3.9% 3.7% Subjects allied
to medicine 7.0% 7.4% 7.8% 7.8% 7.8% 7.9% 8.2%
Biological sciences 9.2% 9.3% 9.4% 9.7% 9.7% 9.7% 9.7% Veterinary science 0.3% 0.3% 0.3% 0.4% 0.4% 0.4% 0. Agriculture &
related subjects 0.7% 0.7% 0.7% 0.6% 0.6% 0.6% 0.6% Physical sciences 4.6% 4.5% 4.6% 4.6% 4.6% 4.6% 4.6% Mathematical sciences 1.9% 1.9% 1.9% 1.9% 2.0% 2.1% 2.1% Computer science 7.2% 6.4% 5.5% 4.9% 4.6% 4.5% 4. Engineering
& technology 6.9% 6.8% 6.6% 6.6% 6.7% 6.8% 6.8% Architecture,
building & planning 2.1% 2.1% 2.3% 2.5% 2.5% 2.6% 2.6% Social studies 9.2% 9.5% 9.6% 9.5% 9.5% 9.6% 9.6%
Law 4.6% 4.7% 4.8% 4.8% 4.8% 4.8% 4.7%
Business &
administrative studies 13.4% 13.2% 13.0% 13.0% 13.1% 13.5% 13.7% Mass communications
& documentation 3.1% 3.1% 3.1% 3.1% 3.1% 3.0% 3.
Languages 7.1% 7.0% 6.9% 6.8% 6.8% 6.6% 6.5%
Historical &
philosophical studies 4.9% 4.7% 4.8% 4.8% 4.7% 4.6% 4.4% Creative arts & design 10.1% 10.3% 10.6% 10.6% 10.8% 10.6% 10.7%
Education 3.3% 3.7% 3.8% 3.9% 3.9% 3.9% 3.
Combined 0.8% 0.6% 0.6% 0.5% 0.4% 0.3% 0.4%
All subjects total 100.0% 100.0% 100.0% 100.0% 100.0% 100.0% 100.0%
Source: HESA Student Record 2003/04-2009/10
1.11b Percentage of full-time first degree students by subject area and academic year
4%
4%
1%
9%
[image:23.595.46.529.69.417.2]Trends in EU and international students
Table 1.12 shows the composition of student numbers according to where they were living prior to entering higher education.
Over the last 10 years, there has been a considerably greater increase in the number of non-EU students studying in the UK compared to the increases in numbers of UK and other EU students studying in the UK. Since 2000/01, the number of non-EU students has more than doubled, with an increase of 11.7 per cent in the last year, approximately four times the percentage increase in UK-domiciled student numbers. However, it should be noted that the population of non-EU students is still small compared to the population of UK-domiciled students, with 6.5 per cent of students from outside the EU in 2000/01 rising to 11.3 per cent in 2009/10. The number of students from other EU countries has increased by over a third and numbers from the UK have increased by around a fifth over the last 10 years.
Student numbers Percentage of total
2009/10
UK 2,087,615 83.7%
Other EU 125,045 5.0%
Non EU 280,760 11.3%
All 2,493,415 100.0%
2008/09
UK 2,027,085 84.6%
Other EU 117,660 4.9%
Non EU 251,310 10.5%
All 2,396,050 100.0%
2000/01
UK 1,731,570 88.9%
Other EU 89,840 4.6%
Non EU 126,720 6.5%
All 1,948,135 100.0%
Percentage change 2000/01 to 2009/10
UK 20.6%
Other EU 39.2%
Non EU 121.6%
All 28.0%
Percentage change 2008/09 to 2009/10
UK 3.0%
Other EU 6.3%
Non EU 11.7%
All 4.1%
Source: HESA Student Record 2000/01, 2008/09, 2009/10
1.12 Change over time in student numbers by domicile
Appendix 3 contains more detailed information about non-UK student numbers by country and region. The top 20 non-UK countries of domicile for students studying in the UK are summarised (by level of study) in Tables 1.13a and 1.13b.
In 2009/10 China (excluding Hong Kong, Taiwan and Macao) provided the highest numbers of students on first degree, postgraduate research and other undergraduate courses and the second highest
numbers on taught higher degree and other postgraduate courses. India provided the highest number of students on taught higher degree courses, and Ireland did so for other postgraduate courses. Malaysia provided the second highest number of students on first degree courses. There were no significant changes in the top 20 countries across levels from the previous year.
China 3,690 India 29,185 Ireland 2,230
United States 2,725 China 23,085 China 800
Germany 2,340 Nigeria 9,780 India 755
Malaysia 1,780 United States 6,035 Nigeria 405
Greece 1,760 Pakistan 5,105 Germany 390
Italy 1,680 Greece 4,620 United States 370
India 1,510 Ireland 4,175 Malaysia 345
Saudi Arabia 1,315 Germany 3,945 France 310
Pakistan 1,190 Thailand 3,385 Pakistan 285
Ireland 1,130 Taiw an 3,215 Greece 280
Canada 1,045 Saudi Arabia 3,135 Canada 265
France 940 France 3,130 Italy 240
Libya 910 Cyprus (EU) 2,340 Saudi Arabia 235
Nigeria 850 Bangladesh 1,965 Spain 225
Iran 835 Canada 1,935 United Arab Emirates 200
Thailand 815 Italy 1,880 Netherlands 170
Taiw an 750 Malaysia 1,670 Australia 165
Poland 665 Turkey 1,640 Hong Kong 160
Cyprus (EU) 640 Korea (South) 1,490 Bangladesh 145
Portugal 600 Spain 1,435 Poland 130
Spain 565 Hong Kong 1,430 Sw itzerland 115
Korea (South) 560 Poland 1,380 Taiw an 115
Mexico 560 Japan 1,305 Cyprus (EU) 115
Egypt 505 Libya 1,305 Trinidad and Tobago 110
Hong Kong 485 Sri Lanka 1,295 Thailand 100
In this table 0, 1, 2 are rounded to 0. All other numbers are rounded up or dow n to the nearest multiple of 5. Source: HESA Student Record 2009/10
1.13a Major countries supplying non-UK students to UK higher education institutions by level of study 2009/10
Other postgraduate
Higher degree (research) Higher degree (taught)
China 23,990 China 5,425
Malaysia 9,915 Ireland 2,325
Cyprus (EU) 7,685 France 2,135
Hong Kong 7,380 United States 2,065
France 7,260 Germany 1,960
Germany 6,800 India 1,500
Ireland 6,740 Saudi Arabia 1,130
India 5,550 Spain 1,030
Poland 5,490 Nigeria 810
Nigeria 4,835 Poland 745
Greece 4,745 Philippines 675
United States 3,860 Hong Kong 495
Pakistan 2,880 Japan 460
Bulgaria 2,565 Italy 390
Singapore 2,555 Cyprus (EU) 385
Saudi Arabia 2,525 Greece 380
Spain 2,465 Pakistan 355
Lithuania 2,460 Malaysia 350
Norw ay 2,395 Korea (South) 335
Italy 2,365 Taiw an 330
Sri Lanka 2,290 Thailand 320
Sw eden 2,220 Zimbabw e 320
Romania 2,165 Libya 320
Canada 2,130 Russia 310
Korea (South) 1,930 United Arab Emirates 300
In this table 0, 1, 2 are rounded to 0. All other numbers are rounded up or dow n to the nearest multiple of 5. Source: HESA Student Record 2009/10
1.13b Major countries supplying non-UK students to UK higher education institutions by level of study 2009/10
Other undergraduate First degree
Trends in income
It should be noted that trends in income figures used in this part of the report are in cash terms and not real terms and no deflator has been applied.
Chart 1.14a and Table 1.14b show the income of higher education institutions by source of income for 2009/10. Funding body grants make up the largest share of the overall income at 33.7 per cent (£9 billion), closely followed by tuition fees and education grants at 30.9 per cent (£8.3 billion). The overall annual income to the sector is now over £26 billion, compared to over £13 billion in 2000/01.
£0 £2,500,000 £5,000,000 £7,500,000 £10,000,000
Funding body grants Tuition fees and education contracts
Research grants and contracts
Other income Endowment and investment income
1.14a Income of higher education institutions by source of income 2009/10 (£ thousands)
Source: HESA Finance Statistics Return 2009/10
UK total Percentage of income
Funding body grants £9,043,115 33.7%
Tuition fees and education contracts £8,272,137 30.9%
Research grants and contracts £4,345,421 16.2%
Other income £4,915,913 18.3%
Endow ment and investment income £219,201 0.8%
Total incom e £26,795,787
Source: HESA Finance Statistics Return 2009/10
1.14b Income of higher education institutions by source of income 2009/10 (£ thousands)
Income trends over the last 10 years, with a comparison for 2008/09, are shown in Table 1.15. The income received by institutions in England has doubled since 2000/01, with a slightly lower increase for other countries of the UK. The biggest increase can be seen within tuition fees and education contracts which increased by 171.3 per cent in 10 years and 13.6 per cent within the last year, mostly due to the introduction of variable fees in 2006/07.
Income from funding body grants increased by 68.8 per cent in 10 years, with larger increases in Scotland (73.8 per cent) and England (69.3 per cent) compared to Wales (58.5 per cent) and Northern Ireland (52.9 per cent). Endowment and investment income decreased by 25 per cent across the UK over the period 2000/01 to 2009/10, partially due to the recession in 2007/08.
England Wales Scotland
Northern
Ireland UK
2009/10
Funding body grants £7,280,128 £453,895 £1,099,550 £209,542 £9,043,115
Tuition fees & education contracts £7,142,075 £378,957 £627,808 £123,297 £8,272,137
Research grants & contracts £3,499,088 £155,635 £601,314 £89,384 £4,345,421
Other income £4,134,377 £240,580 £448,458 £92,498 £4,915,913
Endow ment & investment income £179,531 £6,623 £26,808 £6,239 £219,201
Total incom e £22,235,199 £1,235,690 £2,803,938 £520,960 £26,795,787
2008/09
Funding body grants £7,097,214 £440,375 £1,067,943 £213,827 £8,819,359
Tuition fees & education contracts £6,277,553 £337,654 £556,156 £111,276 £7,282,639
Research grants & contracts £3,333,555 £156,652 £574,103 £80,272 £4,144,582
Other income £4,023,686 £223,235 £425,871 £96,952 £4,769,744
Endow ment & investment income £295,230 £13,619 £39,130 £8,963 £356,942
Total incom e £21,027,238 £1,171,536 £2,663,203 £511,290 £25,373,267
2000/01
Funding body grants £4,299,885 £286,350 £632,513 £137,029 £5,355,777
Tuition fees & education contracts £2,589,365 £131,262 £275,368 £52,584 £3,048,579
Research grants & contracts £1,812,384 £78,807 £278,265 £37,772 £2,207,228
Other income £2,121,062 £132,108 £296,152 £40,626 £2,589,948
Endow ment & investment income £245,949 £12,533 £30,948 £2,957 £292,387
Total incom e £11,068,645 £641,060 £1,513,246 £270,968 £13,493,919
Percentage change, 2008/09 to 2009/10
Funding body grants 2.6% 3.1% 3.0% -2.0% 2.5%
Tuition fees & education contracts 13.8% 12.2% 12.9% 10.8% 13.6%
Research grants & contracts 5.0% -0.6% 4.7% 11.4% 4.8%
Other income 2.8% 7.8% 5.3% -4.6% 3.1%
Endow ment & investment income -39.2% -51.4% -31.5% -30.4% -38.6%
Total incom e 5.7% 5.5% 5.3% 1.9% 5.6%
Percentage change, 2000/01 to 2009/10
Funding body grants 69.3% 58.5% 73.8% 52.9% 68.8%
Tuition fees & education contracts 175.8% 188.7% 128.0% 134.5% 171.3%
Research grants & contracts 93.1% 97.5% 116.1% 136.6% 96.9%
Other income 94.9% 82.1% 51.4% 127.7% 89.8%
Endow ment & investment income -27.0% -47.2% -13.4% 111.0% -25.0%
Total incom e 100.9% 92.8% 85.3% 92.3% 98.6%
Source: HESA Finance Statistics Return (FSR) 2000/01, 2008/09, 2009/10
1.15 Main sources of income received by academic year and country of institution (£ thousands)
All values in the FSR are show n in units of £1,000, and w here necessary rounded to the nearest £1,000, the consequence of w hich is that sum of individual values in each row or column may not match the total value.
27
Section B: Patterns of institutional diversity
This section illustrates, in the form of institutional charts, some of the key student, staff and finance distributions across higher education institutions in the UK. Unless otherwise stated, the finance and staff charts cover the 165 institutions in receipt of funding from the funding councils, together with The
University of Buckingham. The institutional charts are based on student data, and finance ratios featuring student data exclude figures for the University of Wales (central functions), which has staff but no
students.
The HESA Financial Statistics Return (FSR) submissions for the University of East Anglia and the University of Essex include figures for the University Campus Suffolk, which is a 50-50 joint venture between these two universities.
The institutional charts show the distribution of institutions according to indicators of percentages and ratios with medians, lower and upper deciles identified for each chart. Where ratios have been calculated on populations of 52 or fewer students, the data has been suppressed; the institution has been excluded and has not been used in the calculation of median and deciles. All institutional charts are available for further analysis in the HESA heidi system, which is accessible to subscribing institutions and not-for-profit national higher education sector bodies7.
It is worth noting that there have been no new additions to the higher education sector in 2009/10 and no mergers have taken place since 2008/09.
Due to changes in methodology over time, student data in this report is not strictly comparable with that prior to 2007/08 in the Patterns of higher education institutions in the UK reports.
Appendix 9 provides a summary of the median, lower decile and upper decile data for each institutional chart for 2009/10, with comparison against 2008/09.
Balance of provision
The next set of charts examines the balance of provision within UK higher education institutions in respect of levels and mode of study, domicile of student and subject of study.
The distribution of postgraduate numbers and proportions across the sector can be seen in Charts 2.1 and 2.2. It should be noted that from 2007/08, the HESA student population excludes writing-up students and those on sabbatical. This is likely to have had quite an impact on postgraduate numbers, and
therefore comparisons should not be made with institutional charts prior to 2007/08.
As seen from Section A of this report, the postgraduate population has been increasing over time. Overall, 23.2 per cent of the student population were postgraduate in 2009/10. Across the sector, one institution has no postgraduate students and six are postgraduate only.
The median and upper decile increased slightly between 2008/09 and 2009/10 for both the percentage and absolute number of postgraduates at higher education institutions in the UK. The lower decile decreased slightly over the same period for both measures.
7
Lower decile, 8% Median, 23% Upper decile, 43%
0% 10% 20% 30% 40% 50% 60% 70% 80% 90% 100%
Institution
2.1 Percentage of postgraduate students by institution 2009/10
Source: HESA Student Record 2009/10
Lower decile, 216 Median, 3,118 Upper decile, 7,329
0 2,000 4,000 6,000 8,000 10,000 12,000 14,000 16,000
Institution
2.2 Number of postgraduate students by institution 2009/10
Source: HESA Student Record 2009/10
Chart 2.3 shows the distribution of undergraduate student numbers across the sector8. These have also been increasing over time, with 76.8 per cent of all students studying on undergraduate courses in 2009/10. The median and upper decile both increased from 2008/09, with the lower decile decreasing slightly.
8
The Open University is a clear outlier with large numbers of undergraduate students studying by distance learning.
Lower decile, 661 Median, 10,055 Upper decile,
20,611
0 50,000 100,000 150,000 200,000
Institution
2.3 Number of undergraduate students by institution 2009/10
Source: HESA Student Record 2009/10
Chart 2.4 illustrates the proportion of students studying towards an undergraduate qualification other than a first degree (other undergraduate qualification). 19.8 per cent of all students were studying for another undergraduate qualification in 2009/10. The upper decile, lower decile and the median all decreased between 2008/09 and 2009/10.
Lower decile, 0% Median, 13% Upper decile, 38%
0% 10% 20% 30% 40% 50% 60% 70% 80% 90% 100%
Institution
2.4 Percentage of other undergraduate students by institution 2009/10
Source: HESA Student Record 2009/10
The distribution of part-time students across the sector is shown in Chart 2.5. Around a third (34.5 per cent) of all students were studying part time in 2009/10 and, although this shows a similar pattern to last year, the upper decile has decreased by four percentage points. The lower decile decreased at a smaller rate of one percentage point.
Lower decile, 6% Median, 26% Upper decile, 45%
0% 10% 20% 30% 40% 50% 60% 70% 80% 90% 100%
Institution
2.5 Percentage of part-time students by institution 2009/10
Source: HESA Student Record 2009/10
Charts 2.6 to 2.8 look at students who were living outside the UK (non UK-domiciled) prior to entering higher education. As noted in Section A of this report, there has been a considerable growth in the numbers of non-UK students studying in the UK. In particular, the number of students from outside the EU has more than doubled since 2000/01.
Charts 2.6, 2.7 and 2.8 illustrate respectively the actual numbers of non-UK-, non-EU-, and EU- (excluding those from the UK) domiciled students.
The median and upper decile for the number of non-UK students increased by 256 and 322 respectively between 2008/09 and 2009/10. The lower decile decreased over the same period by two, suggesting greater rates of growth in institutions with already high numbers of non-UK students compared to those with fewer numbers, which saw a small decrease.
Over the same period the lower decile, upper decile and median all increased for the number of non-EU students at UK higher education institutions.
For the number of EU students the median and lower decile both increased slightly between 2008/09 and 2009/10, with the upper decile decreasing by 42 over the period, suggesting a decrease in the number of EU students at those institutions with relatively high numbers of these students.
Lower decile, 133 Median, 2,236 Upper decile, 5,647
0 2,000 4,000 6,000 8,000 10,000
Institution
2.6 Number of non UK-domiciled students by institution 2009/10
Source: HESA Student Record 2009/10
Lower decile, 82 Median, 1,368 Upper decile, 3,977
0 1,000 2,000 3,000 4,000 5,000 6,000 7,000 8,000
Institution
2.7 Number of non EU-domiciled students by institution 2009/10
Source: HESA Student Record 2009/10
Lower decile, 49 Median, 659 Upper decile,
1,701
0 500 1,000 1,500 2,000 2,500 3,000
Institution
2.8 Number of EU (excluding UK)-domiciled students by institution 2009/10
Source: HESA Student Record 2009/10
Student characteristics
Chart 2.9 shows the proportion of all full-time undergraduates who are classed as mature. Mature students are defined as those aged 21 or over on entry to their programme of study. Percentages are based on those students whose age is known. Overall, around a quarter (24 per cent) of all full-time undergraduates were mature in 2009/10. Compared to 2008/09, the lower decile, median and upper decile have decreased by two, three and six per cent respectively.
Section A noted that male students were in a minority in UK institutions. Chart 2.10 illustrates the variations in the proportion of male students between institutions. Due to the small numbers involved, students of indeterminate gender have been excluded from the percentage calculations. Some of the more specialist institutions in terms of the subjects they offer can be found at the lower and upper ends of the chart. At the lower end, the more specialist subjects include education, nursing and veterinary science, with engineering and technology subjects at the upper end. The percentages range from 18 per cent to 76 per cent males, with an overall sector percentage of 43.4 per cent.