the Management,
Reconstruction,
Analysis and
Visualisation of
Archaeological Data
Nicole Bordes, Sean Ulm, Oystein Pettersen,
Karen Murphy, David Gwynne, William Pagnon,
Stuart Hungerford, Peter Hiscock, Jay Hall and
Bernard Pailthorpe
Abstract
This paper addresses two parallel and interlinked problems: the development of coordinated digital archaeological resources and libraries that focus on the publication of data, and the creation of a framework for the analysis and visualisation of these data. We present our methodology and a prototype for an Australian archaeological digital collection based on data grid technologies and infrastructure. We also report on preliminary results using innovative visualisation techniques for spatio-temporal data based on the Google Maps/Google Earth technology and progress on the development of a 3D reconstruction tool that visualises excavated archaeological deposits and associated stratigraphy. Data from three major archaeological projects in Queensland are employed, spanning Indigenous, contact and historical archaeology: Mill Point Archaeological Project, Cania Gorge Regional Archaeological Project and Index of Dates from Archaeological Sites in Queensland. These case studies were selected to represent the different challenges in deploying digital technologies to Australian archaeological applications.
Introduction
ongoing impediment to the Australian archaeological and cultural heritage industries. Professionals and researchers are either unaware of the existence of datasets, or aware of them, but unable to access them for a particular project. Their ability to work collaboratively is hampered by a lack of tools to access and share data stored in different formats and/or stored across different sites.
To date, there is no formal management process to make these data available in a ‘grid environment’ for wider access (Foster 2003; Foster and Kesselman 1998, 2003). For archaeology to benefi t from the advances made in high performance computing (Kaufmann and Smarr 1993), it is critical to facilitate and automate many basic data management processes. ‘Data grids’ can provide these functions by establishing and developing infrastructure and tools needed to facilitate discovery and analysis. They also address the problem of long-term preservation of data by providing persistent archives. Based on our experience gained in developing data grids for the physical sciences, this project aims to use and adapt high performance computing techniques and infrastructure for the social sciences and humanities communities. Once the main challenges of data accessibility, data transfer and management of new or derived data are addressed, researchers will be able to access these data and advance the knowledge base of archaeology. In parallel to the creation of a data grid, we are developing visualisation, analysis and data transfer tools specifi c to the archaeological fi eld. We are also interacting with scientists from other cognate disciplines who are developing data grids such as PARADISEC (see below) and the Australian Partnership for Sustainable Repositories (Australian National University 2006), which targets scholarly information held in university libraries.
Goals
There are two
separate aspects to this project. One concerns data management and preservation; the other focuses on the analysis and visualisation of these data. Our goals are to develop and implement a digital archaeological collection and to create a framework for the analysis and visualisation of archaeological data. High performance computing and grid techniques and infrastructure are well embedded in research practice for the physical sciences and the time is ripe for their wider adoption by the humanities and social sciences.The main aspect of the digital collection project concerns data management, metadata creation and the handling of fi les and resources. A web-based portal to these collections will provide data entry and retrieval. Researchers and people with an interest in archaeology will be able to access information about artefacts from specifi c projects. This digital collection will facilitate the dissemination and interchange of archaeological data both across disciplines and institutions and across the public and private sectors; enhance the ability of archaeological research to reach its full potential; and contribute to discourses about Australian cultural heritage and identity. This project will be a model for digital collections and future archaeological portals. There is no national digital collection of data related to Australian archaeology in Australia. Most archaeological data collections are located offshore: it is important for Australia to ‘own’ and manage information about its past.
A web-based portal to the digital collection will provide data analysis and visualisation capabilities. A researcher should be able to download a set of data for use in a specifi c application such as a GIS. We will investigate the use of eXtensible Markup Language (XML) schemas to parse data from one application to another. We are also developing a tool based on the Google Maps Application Programming Interface (API) to visualise and access information based on the geographical coordinates of sites. This tool will serve as a visual interface to the data collections. Finally, we report preliminary results on development of a web-based application for the 3D reconstruction of archaeological excavations. The goal is to develop an analytical tool for archaeology that would both display cultural features, artefacts and their stratigraphic associations in 3D and allow further measurement and analysis to be undertaken. Such a tool will essentially ‘recreate’ the site as it appeared during excavation, thus providing a permanent digital visual reference for subsequent fi eldwork and analysis and a more reliable record of a destroyed resource.
major classes of archaeological information routinely collected by archaeologists. A second dataset collected from deep excavations undertaken as part of the Cania Gorge Regional Archaeological Project is used for the 3D reconstruction of archaeological sites. Finally, a large set of radiocarbon dates obtained from sites across Queensland is used for the visualisation of spatio-temporal data.
Related Work
Digital Collections
Several digital collections and repository projects related to archaeology have been developed, especially in the United States and United Kingdom. The Electronic Cultural Atlas Initiative (ECAI) is an initiative of the University of California, Berkeley, which provides a clearinghouse of shared geo-temporal datasets (Buckland and Lancaster 2004; Lancaster and Bodenhamer 2002; University of California, Berkeley 2006). ECAI uses its own metadata set to describe the data. The set is based on the Dublin Core metadata set (Dublin Core Metadata Initiative 2006) along with additional elements such as temporal and spatial information. Data and associated metadata are stored in a centralised database that users query through a web interface. Query results can be visualised in a map-based interface, TimeMap (see below) (Johnson 2004; University of Sydney 2005). Our present project is not focusing exclusively on geo-temporal data,
however, and the datasets will not be centralised but distributed.
The Archaeology Data Service (ADS) in the United Kingdom is one of fi ve disciplines supported by the Arts and Humanities Data Service (Arts and Humanities Research Council 2006). The ADS is mainly a catalogue and data are not necessarily archived locally: archaeologists decide whether they want to deposit their data in the ADS. The ADS metadata are based on the Dublin Core metadata set and help the user to fi nd out about a dataset and who to contact if the dataset has not been deposited. As a national service, the ADS supports the deployment of digital technologies and promotes good practice in the use of digital data in archaeology.
The main focus of the Alexandria Digital Library (ADL) at the University of California, Santa Barbara, is to support the earth and social sciences more generally, rather than just archaeology. The ADL provides a federated, spatially searchable digital library of geographically-referenced materials such as maps, photographs and satellite imagery (Hill and Zheng 1999; University of California, Santa Barbara 2006). The project uses its own metadata schema and addresses both physical and digital resources, for instance a map and its digital representation. The commonality with our project is that archaeologists want to catalogue both the physical artefact and also the information attached to the artefact.
The Online Cultural Heritage Research Environment (OCHRE), formerly known as XSTAR (XML System for Textual and Archaeological Research), is an online centralised repository developed at the University of Chicago to facilitate the dissemination of archaeological and cultural heritage data (University of Chicago Oriental Institute 2006). OCHRE uses a semi-structured data model characterised by hierarchical tree structures that can be easily represented in XML (XML.org 2006). Users can download or upload data through a Java user interface. OCHRE is based on ArchaeoML, an XML markup scheme developed at the University of Chicago’s Oriental Institute by an archaeologist to represent archaeological datasets (Schloen 2001).
The Pacifi c And Regional Archive for Digital Sources in Endangered Cultures (PARADISEC) provides a facility for digital conservation and access for materials from endangered languages, cultures and music from the Pacifi c Region (PARADISEC 2006). Using open standards and tools the project currently has a 2.5 terabyte repository of digitised materials (especially of fi eld tapes from the 1950s and 1960s) supported by a rich metadata catalogue of project materials. The framework allows users to access, catalogue and digitise audio, text and visual materials while preserving digital copies.
3D Reconstructions of Archaeological Excavations
and GIS, provides a range of modern tools to fi eld archaeology that generate enormous amounts of data. However innovative and useful these new tools may be, none permit a visual physical representation of the archaeological site – a ‘virtual site’ through which archaeologists could study the site almost as it was during excavation, even providing the opportunity to carry out subsequent quantitative measurement and analysis. Photogrammetry was once touted as an answer to this conundrum, but has proven diffi cult to use and is image-based (Pollefeys 2002; Pollefeys et al. 2003). Recent advances in scientifi c data visualisation provide new methods for achieving more accurate and reliable 3D records of excavations and thus bring archaeologists a step to closer to the ‘virtual site’ ideal.
The goal of scientifi c data visualisation is to assist the researcher in developing a deeper understanding of the data under investigation by representing it graphically. Currently, numerous data visualisation software applications are available. GIS such as ArcView and MapInfo have their origin in cartography and have been successfully used in archaeology in projects such as TimeMap on which Pailthorpe and Bordes were early participants by working on proof-of-concept map animations (Bordes et al. 2004; Johnson 2004; University of Sydney 2005). However, GIS are geared to geographical data and limited in their 3D capabilities. On the other hand, applications such as OpenDX, AVS and VTK are multipurpose visualisation applications and are designed to represent data in 3D; however, they are not well integrated with GIS software applications. Other applications, such as Matlab and Mathematica, are powerful tools with advanced statistical, computational and visualisation techniques, however, the learning curve is steep for novice users. What is now required is an integrative framework within which multidimensional data representation at different resolutions can be erected that will permit better comprehension of spatio-temporal relationships between artefacts and other cultural materials, and thus ultimately a more reliable reconstruction of the human past.
The 3D Measurement and Virtual Reconstruction of Ancient Lost Worlds (3D MURALE) is a set of tools developed at Brunel University to record, reconstruct and visualise archaeological sites and artefacts (Brunel University 2006; Cosmas et al. 2001; Hynst et al. 2001). 3D MURALE consists of a relational database, and recording, reconstruction and visualisation components. The 3D MURALE data model follows a scene graph data structure that is typically used in visualisation and computer graphics. A scene graph is a data structure used to organise hierarchically the elements that make up a scene: it consists of a collection of nodes and edges in a tree structure. The data and their relation are stored in the relational database that serves as an input to the visualisation process. The database contains georeferenced objects such as buildings, statues, artefacts, digital terrain models and hypothetical objects that are used to represent missing parts of a building or artefact. The database search tools are XML-based and 3D MURALE accepts XML schemas or documents as input, and output XML or Virtual Reality Modelling Language (VRML) documents. The test study site is the city of Sagalassos in Turkey which has been excavated since 1990 by a team from the Katholieke Universiteit Leuven. The 3D MURALE project was developed specifi cally for the reconstruction of archaeological structures and artefacts. A stand-alone stratigraphic tool, STRAT, has also been developed, although little information is available on the technical background. Stratigraphy can be visualised from existing video records or by entering the coordinates of the different layers.
A further outcome of the 3D MURALE project is a web-based visualisation tool for archaeology, using Maya, a powerful 3D modelling and animation software application (Grabner et al. 2003). The scene graph used by Maya is similar to the one developed in 3D MURALE and a plug-in was created to make the Maya data structure compatible with 3D MURALE’s so that data can be moved to and from the 3D MURALE database. The 3D reconstructions are done in Maya and the images generated are JPEG-encoded and saved at different resolutions. The 3D scenes can be visualised on the web using an ActiveX plug-in for Microsoft Internet Explorer.
submersible to complete a photogrammetric survey of an Etruscan wreck off the island of Grand Ribaud (Drap and Long 2001). ARPENTEUR uses up to three sources of information: theoretical, photogrammetric measurements and measurements made in the laboratory to create a 3D reconstruction of an object. For instance, the 3D visualisation of an amphora can be done by using both the photogrammetric data and theoretical models of amphorae and can be calibrated with measurements undertaken on the artefact itself. The data can then be represented by an XML data structure and accessed for further analysis. The choice of the format for the 3D visualisations has not been resolved at this time: the project uses VRML, Scalable Vector Graphics (SVG), X3D, Microstation and sometimes Java3D.
Schloen (2001) from the Oriental Institute at the University of Chicago developed ArchaeoML, an XML markup scheme for archaeological datasets as part of the Integrated Facility for Research in Archaeology (INFRA). INFRA was designed to provide storage and retrieval of archaeological information and forms the basis of OCHRE (see above). A particularly useful feature of INFRA is the ability to query data through a Java user interface and display relationships between items in different ways:
• a hierarchical tree showing the spatial containment relationships of the artefacts (this is the default view), • a stratigraphic sequence diagram as developed by Edward Harris (see Harris et al. 1993), and • a network diagram that shows items touching others.
These diagrammatic representations show the relationships between the artefacts in a site; however, they are not a visual representation of the archaeological site itself.
None of these services use a data grid environment. One of the major aims of our project is to integrate digital collections and visualisation services in a grid environment. However, we fi rst need to defi ne how these archaeological collections will be organised. We are developing visualisation services in parallel. The integration will be done in the next stage of the project.
Data Format Considerations
An important and common component of these projects is the data model. There is currently no formal way to store archaeological data so that they can be queried, retrieved and analysed, let alone visualised. As noted above, archaeological data are diverse and include images, audio, textual information etc. Given this complexity, XML is a contender to represent archaeological data, facilitating parsing of data between different software applications and allowing researchers to perform work in their favourite applications.
The choice of format for the display of 3D objects is also problematic. The options for an operating-system independent tool are VRML, Java3D, X3D and SVG. Java3D distributes visualisation images to end-user computer systems, so that visualisation models no longer depend on the host computer. This approach allows visualisation on the web and offers a dynamic facility linked to the objects. However Java3D is not easy to install for regular users and the API seems to have been adopted by a small community.
X3D is an open standard used for 3D content delivery (Web3D Consortium 2006a). It is the successor of the widely used but obsolete VRML format (the language ceased to be further developed in 1999), and although compatible with VRML 2, X3D has a rich set of features. It has an XML encoding and can be integrated with other applications in order to manage and exchange information. SVG is also an XML markup language designed to describe two-dimensional vector graphics (Web3D Consortium 2006b). Like X3D it is an open standard created by the World Wide Web Consortium. The advantage of both X3D and SVG is that they can be considered XML graphic formats. We chose to use X3D to represent 3D data because of XML compatibility. This facilitates the integration of a data point of view between the digital collection and the visualisation tools.
Case Studies
Mill Point Archaeological Project
Mill Point is an historical archaeological site of recognised State signifi cance located on the shores of Lake Cootharaba in the Great Sandy National Park, southeast Queensland. The forest of large Koori pines attracted the timber industry and settlement of the area began in the mid-1800s. A sawmill was built in 1869 and operated until 1892 when the timber resources were depleted. Over the 20 years of the sawmill operation, Mill Point grew into a small community of up to several hundred people which included the sawmill, workers houses, school, shops, hotel and cemetery (Brown 2000). The presence of extensive cultural material including stone artefact scatters, tramway, cemetery, dairy area, jetties and wharves has the potential to reveal information about pre-European Aboriginal lifeways, nineteenth and twentieth century life and burial practices at a company timber town in rural Queensland, and about timber extraction and processing (Ulm 2004, 2005). The site exhibits surface and subsurface archaeological deposits representing both Aboriginal and European occupation over an area of more than 10km² (University of Queensland 2006; Nichols et al. 2005). Over 4000 artefacts have been excavated from the Mill Point site over the last three years and are representative of the type of data that make an Australian archaeological digital collection. A key challenge at this site in the integration of data at different spatial scales from specifi c artefact attribute data to broad scale cultural landscapes.
Cania Gorge Regional Archaeological Project
Cania Gorge is an extensive system of low, dissected sandstone plateaux, in the upper Burnett River basin, southeast Queensland, exhibiting a rich Aboriginal and European occupation record. Field surveys have documented numerous archaeological deposits in rockshelters at the base of the escarpments forming the gorge, including rock art sites. Archaeological excavations at 10 rockshelter sites within a 15km² area at the southern end of the gorge have revealed evidence for Aboriginal occupation extending up to 18,000 years ago to the European contact period. Archaeological deposits extend up to 4.5m deep in some sites, with thousands of stone artefacts and faunal remains recovered to date (Eales et al. 1999; Westcott et al. 1999a, 1999b). These archaeological assemblages provide a key dataset in testing models of Holocene Aboriginal cultural change in Australia. However, the very large stone artefact assemblages coupled with complex stratigraphic associations at many sites hamper meaningful integration of site datasets. Data visualisation tools have the potential to deploy data handling and analytical tools to aid interpretation of such complex datasets.
Index of Dates from Archaeological Sites in Queensland
A third set of case study data comprises 849 chronometric determinations obtained from 258 archaeological sites distributed throughout Queensland (Ulm and Reid 2000). Representing sites in all major environmental zones in Queensland and dating from c.40,000 years ago to the present, this dataset has the potential to reveal gross patterns in Aboriginal settlement and occupation trajectories.
The Archaeology Data Grid Architecture
Storage Resource Broker
The Storage Resource Broker (SRB) is a middleware software application developed at the San Diego Supercomputer Center. It provides uniform access to heterogeneous data resources which may be geographically dispersed (Baru et al. 1998; Moore et al. 1996; Rajasekar et al. 2002; University of California, San Diego 2006). The SRB enables the creation of data grids that focus on the sharing of data (Wan et al. 2003). Access to a collection by the public and private research community can be set through passwords or through an authentication scheme based on Globus to provide different levels of data security.
SRB handles data through a client-server architecture and allows users to access location-independent data: the user does not need to know where fi les are located and how they are stored. The SRB organises data logically into a single virtual fi le system, in a similar way to a fi lesystem found on a stand-alone computer, rather than physically. The use of stored metadata about each fi le facilitates the querying of these distributed data. Metadata – data about the data – allow users to quickly fi nd a dataset, what it contains, its format, when or where the data were collected or created etc. Metadata querying and browsing enables user communities to have transparent access to each other’s data collections. Users can store or replicate their data collections across several servers to facilitate data preservation, while not losing local access control. Access permissions on individual fi les can be set so that other users can access the fi les. Users wishing to access these collections will view a single collection through the SRB middleware and do not need to know the physical location of the data.
The SRB servers that provide access to the archival resources, the Metadata Catalogue (MCAT) and the SRB clients are the main elements of an SRB domain. Files uploaded into the SRB are referenced by logical fi le handles chosen by the user – a name that is meaningful to the user. The MCAT maps these logical handles to the physical fi le locations on individual resources, and stores the metadata associated with the fi les, as well as information about the users and the physical resources managed by the SRB. The MCAT is implemented in a relational database such as Oracle or PostgreSQL and contains all the metadata and information about the fi les and resources in the SRB domain. The MCAT is usually associated with one SRB server (MCAT-SRB server). A user queries the catalogue about a specifi c fi le without knowing in which system the fi le resides. SRB can be naturally integrated into a data visualisation pipeline (Pailthorpe and Bordes 2000) for repeated analysis of large, diverse, distributed datasets.
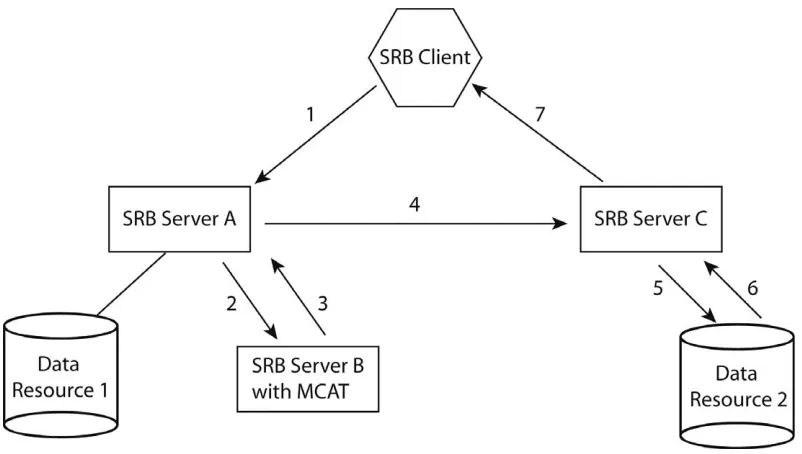
[image:8.595.141.542.63.290.2]Figure 1 illustrates how the SRB works in a typical scenario (the arrows show the typical fl ow of data). A user needs a fi le stored in Data Resource 2 which could be a tape archive or a hard disk etc. However the user does not have this information. The only thing that the user has to do is login and request the fi le by making a query via an SRB client. What follows happens behind the scenes. The client contacts the local SRB Server A and requests the fi le (1). Server A contacts the MCAT-enabled SRB Server B in order to fi nd the physical location of the fi le (2). Server B looks up the information in the MCAT and passes this
information back to Server A (3). As the fi le is located on a resource maintained by SRB Server C, Server A redirects the request to SRB Server C (4). Server C retrieves the fi le from Data Resource 2 (5 and 6) and services the client directly (7). The fi les held on these devices appear to the user as part of a single fi le system. The full process is transparent to the user who does not need to know in which data resource the requested fi le is located.
A user can access and download datasets or fi les through three interfaces: Scommands, inQ and mySRB. Scommands is a command-line interface for UNIX systems that is not intuitive for non-UNIX users. inQ is an intuitive graphical user interface which runs under the Microsoft Windows operating system. mySRB is web-browser-like and runs under any operating system. The SRB manages access and control. When uploading data into the SRB, the user specifi es who can have access to the data (read, write, delete). A user only has access to their own data and the data that others have allowed them to share.
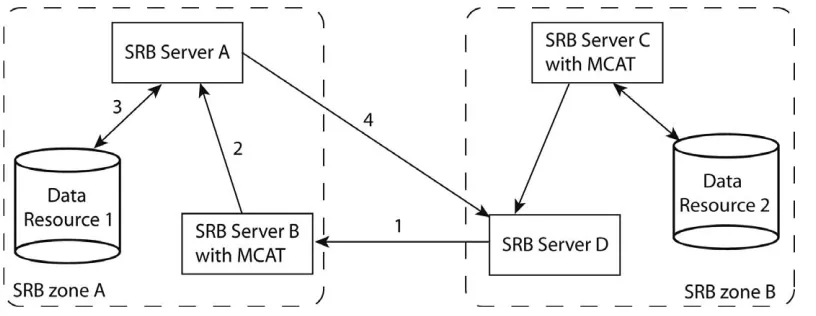
The SRB is scalable and can work in a stand-alone confi guration or in a federated way with several SRB zones and associated MCATs. In a federation, each SRB zone is part of a larger network and several zones interact with each other. Each SRB zone has its local MCAT-enabled SRB server and its own resources and users. From the user’s point of view, a zone is represented as a folder within a logical fi le system. The user then can move from one folder to the other without being aware that the two ‘folders’ are different systems and geographically in different places.
Figure 2 shows how two zones can be established in two locations to form a data grid. SRB Zone A comprises Server A that maintains Data Resource 1, and the MCAT-enabled Server B; SRB Zone B comprises Server D and MCAT-enabled SRB Server C which maintains Data Resource 2. An application or a user in Zone B has requested a fi le located on the Data Resource 1 in Zone A. SRB Server D contacts the MCAT-enabled SRB Server B in Zone A in order to fi nd the physical location of the fi le (1). Server B redirects the request to Server A (2) which retrieves the fi le from Data Resource 1 (3) and services Server D directly (4). In this setup all requests are made to local SRB servers, however, the challenge resides in effi ciently synchronising all MCATs.
Preliminary Results
[image:9.595.55.463.59.217.2]Over 4000 entries derived from three seasons of survey, excavation and artefact analysis at Mill Point (2004–2006) were stored in a Microsoft Access database. Fourteen tables make up this database and record information about the artefacts (provenance, raw material, type, dimensions etc). The data were migrated to a PostgreSQL database. Many database management systems are suitable for this project. We are currently using both PostgreSQL (PosgreSQL 2006) and MySQL (MySQL 2006). PostgreSQL is an open source object-relational database with the features of commercial database systems such as Oracle. PostgreSQL is scalable, has superior programmability compared to other open source databases and developers can integrate their own data types. A feature of interest is PostGIS (Refractions Research 2006): this enables PostgreSQL to be used as a spatial database for GIS. MySQL is a relational database. Although developed by a commercial company, the software is free under the GNU General Public License. MySQL is simpler to use than PostgreSQL, has a large users’ base and is used in many web applications. The Cania Gorge Regional Archaeological Project uses MySQL, however it is straightforward
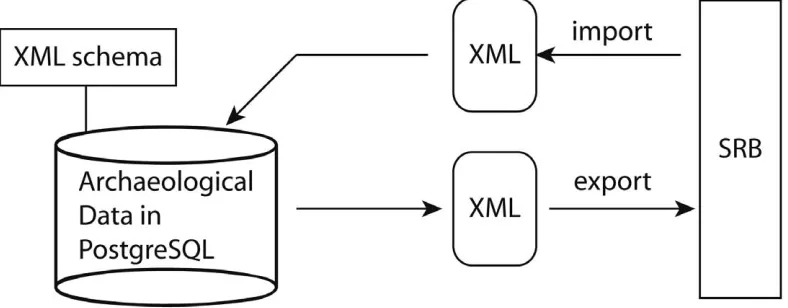
to migrate the data to PostgreSQL. We used PostgreSQL to store the archaeological data related to Mill Point and also to generate the metadata catalogue for the SRB. Six XML schemas were created to defi ne the data model and relationships. The data were converted into XML fi les according to the associated XML schemas and imported to PostgreSQL using scripts. In the future, users will enter new data into the database through a customised interface.
The MCAT was implemented in PostgreSQL. It is a database of metadata associated with the fi les managed by the SRB system containing information about the fi les such as the logical name and physical location of the data, access control information and also descriptive information on the data itself. The collected data were converted into XML fi les according to a created XML schema. This allows the data to be shifted through the SRB system without losing fi le metadata, as these metadata are stored within the fi le with the data. XML fi les were uploaded to the SRB server with inQ. Once in the SRB, the user can create a collection: uploaded data are placed inside this logical collection which only exists within the SRB, and physically are stored into a user-specifi ed resource. When the XML fi les are imported into the SRB, the XML tags display what metadata are available for each fi le. The metadata attributes, which include information about fi les and collections within the SRB, physical and logical locations of the data, access control information and descriptive information on the data itself, are ingested into the MCAT along with the virtual and physical location of the data. The user can then query the data or collection according to the defi ned metadata with an SRB client such as shown in Figure 3.
We created the prototype of a mini-data grid in our laboratory, with one server and several clients. The SRB server and data fi les are currently located in the same network. We have used SRB’s Scommands and inQ clients to query the collection, and upload and download data. We also remotely accessed the SRB server and uploaded and downloaded data successfully via the inQ interface. While the system is currently hard to set up and use, and needs to be hardened, the SRB provides a sound base to establish a digital collection.
Visualisation Tools for Archaeology
We are developing
database-backed visualisation tools that work at two different scales. One tool enables an assemblage of archaeological artefacts to be analysed and understood within the original site matrix. The data come from the Cania Gorge Regional Archaeological Project, with the artefacts displayed in 3D within their associated strata. The other tool is based on Google Maps/Google Earth and addresses the problem of moving between geographical scales and is more GIS-like. The data are radiocarbon dates measured at different sites throughout Queensland. The challenge will be to integrate the two tools seamlessly.3D Reconstructions of an Archaeological Site
[image:10.595.143.537.64.218.2]The web application is built in the Ruby on Rails software framework (Ruby on Rails 2006). We chose this framework over others because Ruby on Rails is built specifi cally for database-backed web applications with an emphasis on productivity rather than programming. Asynchronous JavaScript And XML (AJAX)
technologies are implemented in Rails and ensure that data are updated dynamically without the need to refresh a web page. For instance, any data change is sent to the server in the background and a section of the web page affected by the change is updated without refreshing the entire web page. This increases the speed of the web application and improves user interactivity. Finally, the ease of use and deployment of Ruby on Rails makes it a suitable technology for this project.
The data come from Grinding Groove Cave where a c.4.5m deep excavation revealed evidence for Aboriginal occupation extending from 10,000 years ago. The site was excavated in a series of 147 excavation units within stratigraphic units, each unit measuring 30mm in depth. The Grinding Groove Cave data were originally stored in a Microsoft Excel spreadsheet containing several fi elds: unique identifi er, nature of the artefact, attributes, x, y and z coordinates. The application has functionality for parsing (extracting data from) the Microsoft Excel spreadsheet data into the database. Ruby on Rails provides abstraction from the database so switching to another database engine requires simple reconfi guration. At the moment the web application backs to the MySQL artefact database and accept textual queries. Searches can be done by checking boxes or selecting from a menu as shown in Figure 4. A user can select all or a subset of the excavation units, the types of artefacts to be rendered (i.e. shell, bone or rock) or the location of artefacts. In the future the user will be able to search a database by entering text and keywords and searching through the metadata.
Once the user has selected what needs to be displayed, an X3D fi le is generated. The system was originally designed to have shapes or glyphs on the server and referred to in the generated X3D document. Entity rules defi ned how to handle the external shapes referenced in the X3D document. However, the X3D browser, FreeWrl, failed to parse the X3D document with its external references. As a temporary solution, each type of artefact is now associated with a shape in the database and is exported to the X3D document. This is not desirable because it forces the user to create a shape fi eld in the database. However this solution caters for X3D browsers that do not handle external references. Further testing will be undertaken on other browsers.
[image:11.595.57.347.76.239.2]Figure 5 shows the result of a query displayed in a web browser. The artefacts are represented as spheres and the user assigns a colour for each type of artefact (shell, bone etc). All artefacts have a weight and are represented by a sphere to give a sense of size of the artefact. A scaling factor is applied to all artefact dimensions so that they are in correct proportion relative to each other. It is also possible to visualise each excavation unit and the outline of the excavation.
[image:11.595.63.246.550.741.2]Figure 4. Query form for 3D reconstruction tool web interface.
Google Maps Interface
Google Maps is a free web application that provides dynamic, interactive maps as well as navigation services such as fi nding specifi c places or giving directions to get from point A to point B. We developed a user interface based on the Google Maps API (Google 2006) to explore radiocarbon dates from Queensland archaeological sites. The Google Maps API allows developers to embed Google Maps in a web page with JavaScript. It is possible to overlay markers, polylines and pop-up windows that display relevant information. The Google Maps API provides the tools necessary to visualise spatio-temporal data and integrate Google Maps into web or stand-alone applications.
We created a graphical user interface on top of the database with the wxPython library. A user logs into the system with a username and password and selects a database (if several are available). Once connected, searches can be performed with regular Structured Query Language (SQL) queries. When starting, all the data available in the database are displayed as balloons (the icon can be changed as desired) located by latitude and longitude on Google Maps. All the navigation features available in Google Maps are available in the application. It is possible to select a site pin-pointed with a balloon to retrieve the information associated with the site as shown in Figure 6. The latitude and longitude of the site are displayed at the bottom of the interface and any information associated with the site, such as available radiocarbon dates, is displayed in a table to the left of the map. The implementation was straightforward for a programmer and it is possible to display data from two different databases. Incidentally the visualisation helped identify several erroneous data points suggesting that the coordinates for these points were incorrect. This illustrates the important role that visual analysis plays in verifying data quality.
Conclusion and Future Work
We created a
mini-data grid in our laboratory, with one server and several clients in the same network. Authorised users can connect remotely to the SRB server with Scommands or inQ to query, upload and download data. The archaeological data are exported as XML fi les from the local PostgreSQL database to the SRB server and the metadata are created by the user and stored in the MCAT. Once the MCAT is created, the user can search the archive and retrieve the data. The next step is to integrate two small collections at different geographic locations, and create and test a federated data management environment.We are investigating the use of ArchaeoML for data portability: the use of six customised XML schemas to defi ne the Mill Point data model and relationships was a short-term solution. We are currently working on a web interface for data entry to solve this problem: the data logger will not need to be familiar with databases. Scripts developed by Hungerford for the PARADISEC project will be used to check the integrity of the data. A mistake will prompt the user with a message to check the suspicious data.
[image:12.595.144.459.70.248.2]The integration of archaeological data and metadata is feasible through the use of the SRB. Data can
be queried remotely, downloaded or uploaded. We have not tested the usability of the data grid with the archaeologists: the system is not user-friendly at this stage. The learning curve associated with all the different pieces of middleware and client tools remains a major obstacle. Hence a major effort is required in creating an intuitive and simple interface and writing systematic documentation. Our future work will concentrate on providing user-friendly and intuitive interfaces to users.
The provision of software tools to manage, analyse and visualise datasets is complementary to the creation of a digital collection. The use of the Google Maps technology provides an effi cient way to explore geographical data in real-time at different scales in two-dimensions. The reconstruction tool, although at an early stage, provides a way to visualise data in 3D at a smaller scale than is available in Google Maps. The challenge remains to integrate these two visualisation tools with the digital collection and the implementation of a user-friendly interface.
This project has some implications for data capture during a fi eld season. Two options are possible. In one case, archaeologists can enter data in a systematic way according to a defi ned schema. The data are ingested into the SRB back in the laboratory at the end of the season. The second option is ‘SRB in the fi eld’: the digital collection or part of it could be installed on a laptop along with the SRB as a stand-alone and taken to the fi eld. Data entry can be done directly into the SRB. The updated collection can be synchronised and updated into the archival system back in the laboratory. We will investigate the functionality of these options and how they are suited to archaeology fi eld practice.
Acknowledgements
This work is
supported by an Australian Research Council Special Research Initiative (SR0567201) and funding from the Queensland Cyber-Infrastructure Foundation. The authors would like to thank Ming Chang and Terry Simmich for their help and Reagan Moore (San Diego Supercomputer Center) for comments on this manuscript.References
ARPENTEUR 2006 ARPENTEUR: An Architectural Photogrammetry Network Tool for Education and Research. Retrieved 15 July 2006 from http://www.arpenteur.net.
Arts and Humanities Research Council 2006 The Archaeology Data Service. Retrieved 15 June 2006 from http://ads. ahds.ac.uk.
Australian National University 2006 Australian Partnership for Sustainable Repositories. Retrieved 8 August 2006 from http://www.apsr.edu.au/.
Baru, C., R. Moore, A. Rajasekar and M. Wan Michael 1998 The SDSC Storage Resource Broker. In S.A. MacKay and J.H. Johnson (eds), Proceedings of the 1998 Conference of the Centre for Advanced Studies on Collaborative Research, November 30-December 3, 1998, pp.5-17. Toronto, Ontario: IBM.
Bordes, N., B. Pailthorpe, J. Hall, T. Loy, M. Williams, S. Ulm, X. Zhou and R. Fletcher 2004 Computational archaeology. In WACE4: Workshop on Advanced Collaborative Environments: Proceedings: September 23, 2004. http://www. mcs.anl.gov/wace.
Brown, E. 2000 Cooloola Coast: Noosa to Fraser Island: The Aboriginal and Settlers Histories of a Unique Environment. St Lucia: University of Queensland Press.
Brunel University 2006 3D MURALE. Retrieved 15 June 2006 from http://dea.brunel.ac.uk/project/murale.
Buckland, M. and L.R. Lancaster 2004 Combining place, time, and topic: The Electronic Cultural Atlas Initiative. In
D-Lib Magazine 10(5). http://www.dlib.org/dlib/may04/buckland/05buckland.html.
Chervenak, A., I. Foster, C. Kesselman, C. Salisbury and S. Tuecke 2001 The data grid: Towards an architecture for the distributed management and analysis of large scientifi c datasets. Journal of Network and Computer Applications
23:187-200.
Cosmas, J., T. Itegaki, D. Green, E. Grabczewski, F. Weimer, L. Van Gool, A. Zalesny, D. Vanrintel, F. Leberl, M. Grabner, K. Schindler, K. Karner, M. Gervautz, S. Hynst, M. Waelkens, M. Pollefeys, R. DeGeest, R. Sablatnig and M. Kampel 2001 3D MURALE: A multimedia system for archaeology. In D. Arnold, A. Chalmers and D.W. Fellner (eds), Proceedings of the 2001 Conference on Virtual Reality, Archaeology, and Cultural Heritage, Glyfada, Greece, November 28-30, 2001, pp.315-322. New York: Association for Computing Machinery.
Virtual Reality, Archaeology, and Cultural Heritage, Glyfada, Greece, November 28-30, 2001, pp.17-26. New York: Association for Computing Machinery.
Dublin Core Metadata Initiative 2006 Dublin Core Metadata Initiative. Retrieved 25 June 2006 from http://dublincore. org.
Eales, T., C. Westcott, I. Lilley, S. Ulm, D. Brian and C. Clarkson 1999 Roof Fall Cave, Cania Gorge: Site report.
Queensland Archaeological Research 11:29-42.
Foster, I. 2003 The grid: Computing without bounds. Scientifi c American 288:78-85.
Foster, I. and C. Kesselman 1997 Globus: A metacomputing infrastructure toolkit. International Journal of Supercomputer Applications 11(2):115-128.
Foster, I. and C. Kesselman (eds) 1998 The Grid: Blueprint for a New Computing Infrastructure. 1st ed. San Francisco: Morgan Kaufmann Publishers.
Foster, I. and C. Kesselman (eds) 2003 The Grid 2: Blueprint for a New Computing Infrastructure. 2nd ed. San Francisco: Morgan Kaufmann Publishers.
Google 2006 Google Maps API. Retrieved 15 July 2006 from http://www.google.com/apis/maps/.
Grabner, M., R. Wozelkal, M. Mirchandani and K. Schindler 2003 Web-based visualization of virtual archaeological sites. In Proceedings of the 4th International Symposium on Virtual Reality, Archaeology and Intelligent Cultural Heritage (VAST 2003), Brighton, United Kingdom, November 5-7, 2003, pp.1-12.
Harris, E.C., M.R. Brown and G.J. Brown (eds) 1993 Practices of Archaeological Stratigraphy. London: Academic Press.
Hill, L.L. and Q. Zheng 1999 Indirect geospatial referencing through place names in the digital library: Alexandria Digital Library experience with developing and implementing gazetteers. In Proceedings of the American Society for Information Science Annual Meeting, Washington, D.C., Oct. 31- Nov. 4, 1999, pp.57-69. http://www. alexandria.ucsb.edu/gazetteer/.
Hynst, S., M. Gervautz, M. Grabner and K. Schindler 2001 A work-fl ow and data model for reconstruction, management, and visualization of archaeological sites. In D. Arnold, A. Chalmers and D.W. Fellner (eds), Proceedings of the 2001 Conference on Virtual Reality, Archaeology, and Cultural Heritage, Glyfada, Greece, November 28-30, 2001, pp.43-52. New York: Association for Computing Machinery.
Johnson, I. 2004 Putting time on the map: Using TimeMap for map animation and web delivery. GeoInformatics July/ August 2004. http://www.timemap.net/tm/documents/publications/200408_geoinformatics.pdf.
Kaufmann, W.J. and L.L. Smarr 1993 Supercomputing and the Transformation of Science. New York: W.H. Freeman and Company.
Lancaster, L.R. and D. Bodenhamer 2002 The Electronic Cultural Atlas Initiative and the North American Religion Atlas. In A.K. Knowles (ed.), Past Time, Past Place: GIS for History, pp.163-178. Redlands, CA: ESRI Press.
MySQL 2006 MySQL. Retrieved 30 June 2006 from http://www.mysql.com.
Moore, R. 2001 Data management systems for scientifi c applications. In R. Boisvert and P. Tang (eds), The Architecture of Scientifi c Software, pp.273-284. Dordrecht: Kluwer Academic Publishers.
Moore, R., R. Marciano, M. Wan, T. Sherwin and R. Frost 1996 Towards the interoperability of web, database, and mass storage technologies for petabyte archives. In Proceedings of the Fifth NASA GSFC Conference on Mass Storage Systems and Technologies, College Park, Maryland, September 1996. College Park, MD.
Nichols, S., J. Prangnell and M. Haslam 2005 Hearts and minds: Public archaeology and the Queensland school curriculum. Australian Archaeology 61:71-79.
Pailthorpe, B. and N. Bordes 2000 Scalable volume visualisation, ranging from astrophysics, through brain mapping, to oceanography. In B. Ernquist, L. Johnsson, M Hammill and F. Short (eds), Simulation and Visualization on The Grid: Lecture Notes in Computational Science, pp.122-134. New York: Springer-Verlag.
PARADISEC 2006 Pacifi c And Regional Archive for Digital Sources in Endangered Cultures. Retrieved 30 June 2006 from http://paradisec.org.au/.
Pollefeys, M. 2002 Visual 3D Modeling from Images. Retrieved 30 June 2006 from http://www.cs.unc.edu/~marc/ tutorial/.
Pollefeys, M., L. Van Gool, M. Vergauwen, K. Cornelis, F. Verbiest and J. Tops 2003 3D recording for archaeological fi eldwork. IEEE Computer Graphics and Applications 23(3):20-27.
PostgreSQL Global Development Group 2006 PostgreSQL Global Development Group. Retrieved 30 June 2006 from http://www.postgresql.org.
Performance Computing Conference, Amsterdam, Holland, June 26 2001, pp.72-80.
Rajasekar, A., M. Wan and R. Moore 2002 MySRB and SRB - Components of a data grid. In Proceeding of the 11th International Symposium on High Performance Distributed Computing (HPDC-11) Edinburgh, Scotland, July 24-26, 2002, pp.57-69.
Refractions Research 2006 PostGIS. Retrieved 30 June 2006 from http://postgis.refractions.net/. Ruby on Rails 2006 Ruby on Rails. Retrieved 14 July 2006 from http://www.rubyonrails.org/.
Schloen, J.D. 2001 Archaeological data models and web publication using XML. Computers and the Humanities
35:123-152.
Ulm, S. (ed.) 2004 Mill Point Archaeological Project Field Season Report 2004:1-4. Brisbane: Aboriginal and Torres Strait Islander Studies Unit, University of Queensland.
Ulm, S. (ed.) 2005 Mill Point Archaeological Project Field Season Report 2005:1-4. Brisbane: Aboriginal and Torres Strait Islander Studies Unit, University of Queensland.
Ulm, S. and J. Reid 2000 Index of dates from archaeological sites in Queensland. Queensland Archaeological Research
12:1-129.
University of California, Berkeley 2006 The Electronic Cultural Atlas Initiative. Retrieved 15 July 2006 from http://www. ecai.org/.
University of California, San Diego 2006 The Storage Resource Broker. Retrieved 15 June 2006 from http://www.sdsc. edu/srb/index.php/Main_Page.
University of California, Santa Barbara 2006 The Digital Alexandria Project. Retrieved 15 June 2006 from http://www. alexandria.ucsb.edu/adl/.
University of Chicago, Oriental Institute 2006 Online Cultural Heritage Research Environment. Retrieved 29 June 2006 from http://ochre.lib.uchicago.edu/index.htm.
University of Queensland 2006 Mill Point Archaeological Project. Retrieved 15 June 2006 from http://www.atsis. uq.edu.au/millpoint.
University of Sydney 2005 TimeMap. Retrieved 27 June 2006 from http://www.timemap.net/index.php?option=com_ content&task=view&id=124&Itemid=130.
Wan, M., A. Rajasekar, R. Moore and P. Andrews 2003 A simple mass storage system for the SRB data grid. In
Proceedings of the 20th IEEE/11th NASA Goddard Conference on Mass Storage Systems and Technologies, (MSST 2003), pp.20-25.
Web3D Consortium 2006a. X3D. Retrieved 14 July 2006 from http://www.web3d.org/.
Web3D Consortium 2006b Scalable Vector Graphics. Retrieved 14 July 2006 from http://www.w3.org/ Graphics/SVG/.
Westcott, C., I. Lilley and S. Ulm 1999a The archaeology of Cania Gorge: An overview. Queensland Archaeological Research 11:15-28.
Westcott, C., I. Lilley, S. Ulm, C. Clarkson and D. Brian 1999b Big Foot Art Site, Cania Gorge: Site report. Queensland Archaeological Research 11:43-58.