Recruitment and Retention in the
Post-16 Learning and Skills Sector
Philip Wilson, Vicky Hopwood and Matt Antill
York Consulting
Research Report No 697
Recruitment and Retention in the
Post-16 Learning and Skills Sector
Philip Wilson, Vicky Hopwood and Matt Antill
York Consulting
The views expressed in this report are the authors’ and do not necessarily reflect those of the Department for Education and Skills.
Contents
Page
1 INTRODUCTION ... 1
2 METHODOLOGY AND PROFILE OF RESPONDENTS ... 8
3 MOTIVATION TO JOIN THE SECTOR ... 24
4 ENTRY TO THE SECTOR... 31
5 TURNOVER, VACANCIES AND HARD TO FILL VACANCIES ... 36
6 WORKING IN THE SECTOR ... 50
7 SATISFACTION, BENEFITS AND DRAWBACKS ... 62
8 TRAINING AND DEVELOPMENT ... 73
9 GOVERNMENT STRATEGY... 81
10 CONCLUSIONS ... 85
EXECUTIVE SUMMARY
1. This report explores the important issues of recruitment and retention of staff who work with learners across the post-16 learning and skills sector.
2. The assignment, commissioned by the Standards Unit within the Department for Education and Skills, has been undertaken by York Consulting in association with MORI Social Research Institute between September 2004 and September 2005.
3. The study has involved four key elements, comprising of: • a large-scale quantitative telephone survey;
• a large-scale quantitative telephone survey of HR Managers in FE; • large-scale qualitative interviews with staff - with an emphasis on
those working in maths and science subjects;
• small-scale qualitative telephone interviews with dissatisfied staff (identified at the initial survey stage).
Summary of Key Findings
Key points arising from the research relating to individuals’ motivation to join the sector are as follows:
4. The majority of staff (61%) started working in the sector between the ages of 18 and 34.
5. Most entrants did not begin their career with a clear ambition to go into teaching/training in the post-16 sector. The majority of staff entered the sector after working in other industry sectors – smaller numbers
entered from teaching in schools or with no previous experience.
6. Entrants from industry were most likely to go into work based learning or adult and community learning provision. Many left industry due to stress or a desire to do something ‘more worthwhile’.
7. Only a small number of respondents joined the sector early in their career after qualifying as a teacher via the PGCE route. Few planned to join the sector and most ‘discovered’ the sector through a variety of means;
8. The common reasons for leaving the school sector to work in the learning and skills sector included better discipline and learner motivation.
9. Nearly half of respondents (46%) indicated some vocational reasons for joining the sector, this was followed by just over a third of
of respondents), closely followed by those who wanted to change their career path (19%).
10. A specific personal reason relating to women with families is the attraction of the sector’s comparative flexibility, particularly, compared with school teaching.
11. For a minority of staff working in the sector a major influencing factor was personal or family links to education or inspiration by a good teacher/trainer.
Key points relating to entry into the sector are as follows:
12. The majority of staff working in the sector (51%) believe that there are enough entry routes into the learning and skills profession, although around one third of respondents (31%) do not believe this to be the case. This is supported by the views of HR Managers in FE.
13. Staff in work based learning provision have a more negative view of the adequacy of entry routes compared with those in further education and adult and community learning.
14. The recruitment experience is generally perceived as straightforward with most members of staff undergoing a formal recruitment process involving an application for an advertised post and attending a
structured interview.
15. In a minority of cases more informal recruitment processes have been adopted involving networking and personal contacts.
16. A major barrier to entry is awareness of the sector and the opportunities within it.
17. Important concerns which may be limiting entry into the sector include difficulty in finding more permanent and longer term hours and, in some cases, a protracted recruitment period.
Key issues emerging relating to hard to fill vacancies are as follows:
18. There was a 10% turnover of teaching staff in FE. This compares favourably with other sectors. Most teachers leaving their post were taking a post in another FE college.
19. The level of vacancies is low in colleges (2%), with only 11% of
colleges indicating a rate of more than 5% of teaching/ staff. Although, nearly two fifths of colleges (38%) are experiencing hard to fill
vacancies.
more likely to be aware of recruitment difficulties (50%) than respondents in all other organisations.
21. Subjects where staff/HR Managers feel recruitment difficulties are most acute include health/social care and public services, engineering, construction, business administration.
22. The most common response to recruitment difficulties was to use staff from within the organisation to cover the job role. In a smaller number of cases, respondents indicated the use of agency cover and different advertising mediums.
23. Just over half of staff respondents (51%) felt that the measures taken by the organisation to cover vacancies when recruitment had not been successful were very or fairly effective. Teachers of science, English and maths were least likely to agree that recruitment measures had been effective.
24. The majority of HR Managers (86%) believe that measures to cover hard to fill vacancies have been effective.
25. A quarter of staff respondents felt that better pay would minimise recruitment difficulties with one in ten suggesting improvements in advertising would be beneficial.
26. Other factors mentioned by staff which might cause recruitment difficulties included job insecurity, difficulties of recruiting young staff, lack of suitable applicants and the negative view of the sector.
27. Specific recruitment problems in relation to maths and science vacancies included low numbers of applicants, a lack of ‘quality’ candidates, competition from the school sector and difficulties in recruiting part-time staff.
Key points relating to working in the sector are as follows:
28. One in ten members of the workforce has multiple jobs. Of these, nearly three quarters (72%) have one additional job.
29. Nearly half of staff (47%) have more than ten years experience in the learning and skills sector. Over a quarter of respondents (28%) have more than ten years experience in their current organisation.
30. Levels of satisfaction with the amount and quality of resources and facilities available to staff is very high (69% and 76% respectively). A minority of staff indicated dissatisfaction with the amount and quality of resources and facilities available (21% and 15% respectively).
31. In terms of subjects, teachers/trainers of science, English and
32. Key concerns where resources were not satisfactory, related to IT facilities being poor or lacking, poor working conditions and lack of equipment/up to date equipment.
33. Just over two fifths of respondents (42%) reported that they had
considered leaving their current employment during the last six months. A greater proportion of those working in further education colleges (48%) had considered leaving their job compared with all other types of organisations. Those undertaking in-house training for an employer were least likely to have considered leaving their job in the last six months (37%).
34. Of those respondents who had considered leaving their present job, one third (33%) said they had applied for other jobs during the previous six months. Overall this represents 14% of the learning and skills workforce.
35. Respondents who had actively applied for other jobs were more likely to be dissatisfied with their current job, to be younger and to be from black and minority ethnic groups.
36. Well over half of respondents (57%) who had applied for other jobs indicated that they were pursuing a job in a related sector within education. Just over a third of respondents (34%) had sought a job in a completely different sector.
37. The majority of respondents (83%) agreed that they intend to be working for their organisation in one year’s time.
38. Three fifths of respondents felt they had too much work to do, while over a third (37%) reported that they had the right amount of work to do. Managers were much more likely to indicate that they had too much work to do compared with other types of staff. Similarly, staff working in further education colleges and science subjects were much more likely to feel they had too much work to do.
39. Aspects of this perceived excessive workload indicated by staff
included too much paperwork, bureaucracy and lack of administrative support.
Key issues raised in this section relating to satisfaction, benefits and drawbacks are as follows:
41. Staff working in science, engineering and ICT subjects were least likely to be satisfied with their current job.
42. 60% of respondents agreed that morale is good within their
organisation. Over a quarter of respondents (28%) disagreed that morale was good.
43. Those with a less positive view of morale were more likely to be
working in further education, working in science or English, dissatisfied with their job and older.
44. A quarter of respondents felt that they are not valued and recognised for the work they do, although 66% of respondents disagreed with this statement.
45. Those who are less likely to feel valued include teachers/trainers, those working in further education colleges and those working in science subjects.
46. The most common reasons given for continuing to work in the post-16 learning and skills sector were helping people to develop (51%), job satisfaction/personal achievement (43%) and working with
people/learners (38%).
Key issues in relation to training and development across the sector are as follows:
47. Four fifths of respondents indicated that they have regular performance reviews, a written development plan, are engaged in a programme of continuous professional development and have participated in peer mentoring.
48. Just under half of respondents indicated that they have non-contact time set aside for continuous professional development.
49. Three fifths of respondents indicated that they had received subject specific training or general training concerning teaching/learning approaches. Over a third of respondents had received management and leadership training.
50. Qualitative findings indicated a strong ethos for training within the sector, although, some key concerns included the lack of a well defined career path, confusion over acceptable (new) teaching qualifications and, for some, there was limited opportunity to apply training in the workplace.
52. The most common qualification held across the sector is D32/33-A1/2. The proportions of qualifications are diverse across the staff working in different provider institutions.
Key issues raised in relation to government strategy are as follows:
53. Just under a third of staff (32%) indicated that they knew a great deal or a fair amount about the government’s Success for All strategy. A further 31% indicated that they knew a little, however, over a third of staff (37%) indicated that they had either only heard of it but knew nothing or had never heard of it.
54. Among those respondents who indicated that they were aware of Success for All, over half (53%) agreed that the strategy had had a positive effect. Less than one fifth felt they had not seen a positive effect.
1 INTRODUCTION
1.1 This report details the research findings across a range of
methodological elements that aim to explore the important issues of recruitment and retention of staff who work with learners across the post-16 learning and skills sector.
1.2 The assignment, commissioned by the Standards Unit within the Department for Education and Skills, has been undertaken by York Consulting in association with MORI Social Research Institute between September 2004 and September 2005.
1.3 The study has involved four key elements, comprising of:
• a large-scale quantitative telephone survey of teaching and learning staff working in further education, work based learning and adult and community learning;
• a large-scale quantitative telephone survey of HR Managers working in further education;
• large-scale qualitative face to face interviews with teaching and learning staff - with an emphasis on those working in maths and science subjects - working in further education, work based learning and adult and community learning;
• small-scale qualitative telephone interviews with dissatisfied teaching and learning staff - focusing on those working in maths, science, engineering and technology subjects - working in further education, work based learning and adult and community learning. These teachers had identified themselves as dissatisfied with their job during the initial survey.
1.4 This introduction to the report is covered under the following headings:
• definitions;
• policy issues;
• research objectives;
• research design and delivery;
• acknowledgements;
Definitions
1.5 A number of terms have been used during this study which benefit from a clear definition to ensure consistent understanding. These are as follows:
• post-16 learning and skills sector – this consists of provision contracted by the Learning and Skills Council (LSC) under the headings of further education (FE - including sixth form colleges and specialist colleges but excluding school sixth forms), work based learning (WBL) and adult and community learning (ACL);
• teaching workforce – this covers those staff working for providers (direct employees and agency workers, full-time and part-time staff)
who have a direct impact on learning, known variously as teachers,
lecturers, teaching assistants, trainers, assessors and managers. The definition does not encompass others in the workforce who are not connected to learning such as clerical staff, cleaners and
caterers. For expediency throughout this report the term
teachers/trainers is used to refer to this collective group. Where
other labels are used then analysis refers specifically to those groups.
Policy Issues
1.6 In November 2002, the DfES published Success for All – Reforming
Further Education and Training. This strategy includes four headline
themes. Theme Three is “developing the leaders, teachers, trainers and support staff of the future”. The work under this theme addresses several areas relating to the learning and skills sector workforce, including the recruitment and retention of teachers.
1.7 Success for All outlines a vision for the learning and skills sector of:
• incentives and rewards for good performance by individual staff in terms of both pay and prospects for progression;
• an improved ability to recruit and retain staff.
1.8 The primary purpose of this study is to inform policy making in this area by providing greater insight into the most important issues.
1.9 The development work to underpin Success for All is not taking place in isolation. There are currently several related initiatives and agendas that impact on the workforce in the post-16 learning and skills sector.
• Skills for Life and basic skills targets;
• the 14-19 agenda, which is starting to blur the boundaries between post-16 learning and skills and mainstream schooling;
• the Skills Strategy, which embraces the need for employer engagement and a more commercial approach to delivery of post-16 learning and skills provision;
• new curriculum materials under development as part of teaching and learning reforms under “Success for All”;
• the ten-year investment framework for science and innovation pledging “a supply of science, technology, engineering and
mathematics skills more responsive to the needs of the economy, and greater flexibility within schools and universities to attract the skills they need”;
• the Smith Inquiry focusing on the improvement in post-14 maths provision to address the issues of a shortage of specialist maths teachers, the failure of current curriculum to meet needs and lack of sustained continuing professional development to support teachers of maths;
• in the adult and community learning sector the ‘First Steps’ consultation1 has outlined proposals for developing the funding model for non-accredited provision and aligned the policy for this area of learning with wider post-16 skills policy, notably the Skills Strategy;
• the LSC’s ‘Agenda for Change’ running alongside the Foster Review, is addressing issues under the following themes:
skills/employers, quality, funding (including bureaucracy), business excellence, data and reputation.
Research Objectives
1.10 The main aims of this study are as follows:
• what motivates those who teach to join the sector;
• the main barriers to entering the sector;
• the main benefits of teaching in the sector and general levels of satisfaction;
• at what point in their career teachers join the sector (and their previous occupation) and at what point they leave the sector;
• reasons for leaving the sector and subsequent destinations.
Research Design and Delivery
1.11 There is little known about the learning and skills sector workforce as a whole, thus in order to inform and meet current objectives the DfES commissioned this large-scale study of the teaching workforce.
1.12 There is anecdotal evidence to suggest that there are recruitment and retention difficulties in the post-16 learning and skills sector. These are often cited as being related to a combination of issues such as:
• pay – it is purported by some that there is a disparity between staff pay in schools as opposed to the learning and skills sector and industry;
• ageing workforce – with a perceived increasingly ageing
workforce there is a need to attract and recruit new staff in to the profession;
• workload – survey evidence from NATFE suggests that staff working in the Further Education sector were dissatisfied with conditions of service, increased levels of paperwork, working hours and requirements for other duties that are a substantial part of the role such as material preparation and counselling students.
1.13 The Foster Review of Further Education includes as one of its core questions, “What are the most important aspects of college workforce needs that must be attended to?” and also seeks to review issues relating to bureaucracy, sector investment, poor public image and conflicting priorities.
1.14 Desk research indicated recent studies and data in related subject areas:
• Research into the Qualifications of Staff in LSC-funded Provision,
DfES, 2004 (conducted by HOST Policy Research). This study involved a self completion questionnaire completed by 6,279 respondents;
• Staff Individualised Record (SIR) undertaken by the Learning and Skills Council;
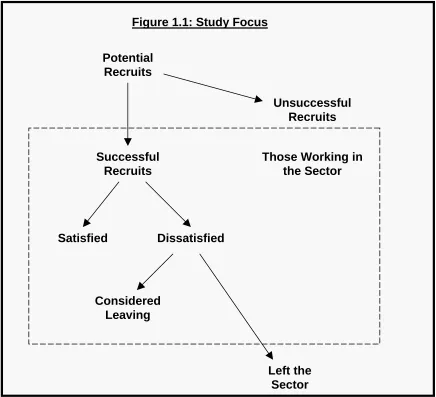
1.15 The focus of this study is indicated by the dotted box in Figure 1.1, which depicts a ‘flowchart’ of staff into and out of the sector. It covers those who have entered and are working in the sector, those who are satisfied and dissatisfied and those who have considered leaving. By definition, therefore, it does not consider potential recruits, those who have failed to get a job or those who have left the sector. The survey of HR Managers does however provide a view on turnover, thus
[image:14.595.88.524.261.658.2]considering the rate at which people are leaving, as well as destinations of those leaving.
Figure 1.1: Study Focus
Potential Recruits
Successful Recruits
Unsuccessful Recruits
Satisfied Dissatisfied
Considered Leaving
Left the Sector
1.16 Key question areas relevant to each strand of the study are summarised in Table 1.1. Full questionnaires and topic guides can be found in Annex A.
Table 1.1: Key Question Areas
Quantitative Telephone Survey across Learning and Skills Sector • motivations to join the sector
• satisfaction, benefits and drawbacks associated with job • recruitment issues
• intention to stay/leave • training and development • awareness of Success for All
Quantitative Telephone Survey of HR Managers in Further Education • characteristics of staff employed
• recruitment, turnover and hard to fill vacancies • characteristics of those leaving the sector • training and development
• perceptions of Government strategy
Qualitative Face to Face Interviews with Teaching and Learning Staff • emphasis on those working in maths and science subjects
• views of motivation to join, barriers to entry, benefits and drawbacks, intention to stay/leave, training and development
Qualitative Telephone Interviews with Dissatisfied Teaching and Learning Staff
• emphasis on those working in maths, science, engineering and technology subjects
• views of motivation to join, barriers to entry, benefits and drawbacks, training and development
Acknowledgements
Report Structure
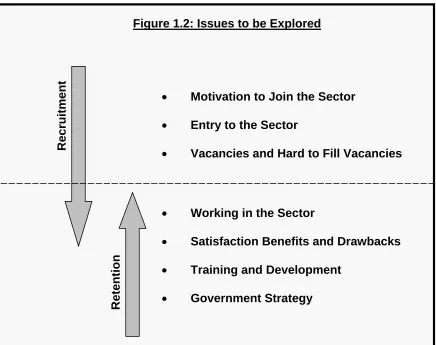
1.18 The balance between aspects of recruitment and retention is indicated in Figure 1.2.The diagram illustrates that some issues are focused
primarily on one of the two key themes, although others such as working in the sector may influence both aspects.
1.19 The report is set out in the following sections
• section 2 outlines the methodology and profile of respondents;
• section 3 focuses on what motivates staff to join the sector;
• section 4 reports on the experiences of staff on entry to the sector;
• section 5 covers turnover, vacancies and hard to fill vacancies;
• section 6 considers issues relating to working in the sector;
• section 7 reports on levels on satisfaction, benefits and drawbacks;
• section 8 reports on training and development issues;
• section 9 covers staff perceptions of government strategy;
[image:16.595.98.534.165.510.2]• section 10 draws together conclusions as a result of this research. Figure 1.2: Issues to be Explored
• Motivation to Join the Sector
• Entry to the Sector
• Vacancies and Hard to Fill Vacancies
• Working in the Sector
• Satisfaction Benefits and Drawbacks
• Training and Development
• Government Strategy
Retention
2
METHODOLOGY AND PROFILE OF RESPONDENTS
Introduction
2.1 In this section we outline the respondent profile across the different elements of this study. In addition we mention key methodological issues relevant to each element, which are important for interpretation of findings. The four aspects of the study are covered, namely:
(i) quantitative telephone survey across learning and skills sector; (ii) quantitative telephone survey of HR Managers in further education; (iii) qualitative face to face interviews with teaching and learning staff; (iv) qualitative telephone interviews with dissatisfied teaching and
learning staff.
2.2 Prior to undertaking these research elements a number of early consultations were held with a range of representative organisations including the Association of Colleges (AoC), the Association of Learning Providers (ALP), the National Network of Local Authority Learning (LEAFEA) and the Centre for Excellence in Leadership (CEL).
(i) Quantitative Telephone Survey across Learning and
Skills Sector
2.3 The key methodological elements relevant to this study are outlined below2. The survey comprised three elements; a quantitative pilot phase; recruitment of learning and skills organisations in order to generate individual staff leads, and the staff survey.
2.4 Both the recruitment and interview methodologies were piloted with institutions and individual respondents. Forty institutions were sent letters about the research, along with a reply faxback form to indicate whether they were willing to participate. Letters were addressed to the Chief Executive/ Principal of each organisation.
2.5 The pilot confirmed that a ‘cap’ of 30 leads should be applied in the recruitment phase, as beyond this, the process for most organisations became too much of an administrative burden (i.e. providers should be asked for a maximum of 30 leads). Minor amendments to both the recruitment and questionnaire were made as a result of the pilot.
2.6 The Department provided a list of institutions involved in further
education, work based learning and adult community learning. This list was a census of institutions from the LSC provider database. An additional 107 adult and community learning leads were generated, based on consultation with local authorities who sub-contract their adult and community learning provision.
2.7 A total of 914 institutions took part in the recruitment phase from a sample of 1,642 providers, representing an unadjusted response rate of 55%.
2.8 Each organisation was asked to provide names and contact details of members of staff with a direct impact on learning at the organisation; such as lecturers, teachers, trainers, managers, teaching assistants and learner support workers. Institutions were asked to include part-time as well as full-time staff, and those working in fractional posts or on
temporary contracts (including agency workers): this was highlighted both in the advance letter that was sent to organisations, and in the recruitment script. In addition, we asked institutions to ensure the staff leads they provided us with covered a good range of people with varying lengths of service and across different grades and levels of seniority.
2.9 The recruitment script also specified how many staff members were required in each broad subject area. Leads were required in a ratio of 2:1 to allow for non-response.
2.10 A total of 6,838 staff leads were collected from the 914 participating organisations, an average of 7 leads per institution. In practice, smaller institutions were only asked to provide 2-4 leads each; larger institutions (namely the large FE colleges) provided up to 30 leads each.
Survey Fieldwork
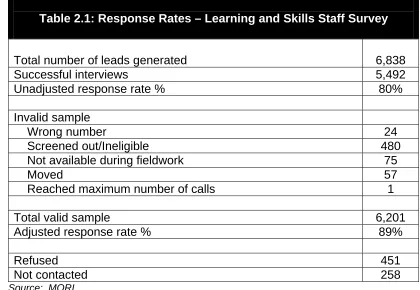
2.11 A total of 5,492 interviews were conducted across the 914 organisations. The adjusted response rate is 89% as shown in the Table 2.1.
2.13 Prior to the main survey, a full and detailed briefing was held with MTS interviewers at their Edinburgh offices. A comprehensive briefing pack was supplied to every interviewer involved in the project, including information on background to the study and guidelines on the recruitment and interviewing procedures.
2.14 The questionnaire (see Annex A) was designed in close consultation between DfES, York Consulting and MORI. As usual with computerised interviewing, several logic and consistency checks were included to minimise keying errors and implausible answers.
2.15 The data are presented unweighted. Due to the lack of definitive profile information on staff within the sector, it is not possible to apply weights.
[image:19.595.110.530.381.671.2]2.16 Coding was checked for verbatim answers entered by interviewers at open-ended and ‘other-specify’ questions. Code frames were prepared for all open-ended questions and where the ‘other-specifies’ constituted more than 10% of all responses.
Table 2.1: Response Rates – Learning and Skills Staff Survey
Total number of leads generated 6,838
Successful interviews 5,492
Unadjusted response rate % 80%
Invalid sample
Wrong number 24
Screened out/Ineligible 480
Not available during fieldwork 75
Moved 57
Reached maximum number of calls 1
Total valid sample 6,201
Adjusted response rate % 89%
Refused 451
Not contacted 258
2.17 Key dimensions of the survey respondents are presented under a range of headings as follows:
• personal characteristics; • job role and organisation; • working practices;
• subject.
Personal Characteristics
2.18 The personal characteristics of the respondents are presented below in terms of gender, age, ethnicity, and disability.
Gender, Age and Disability
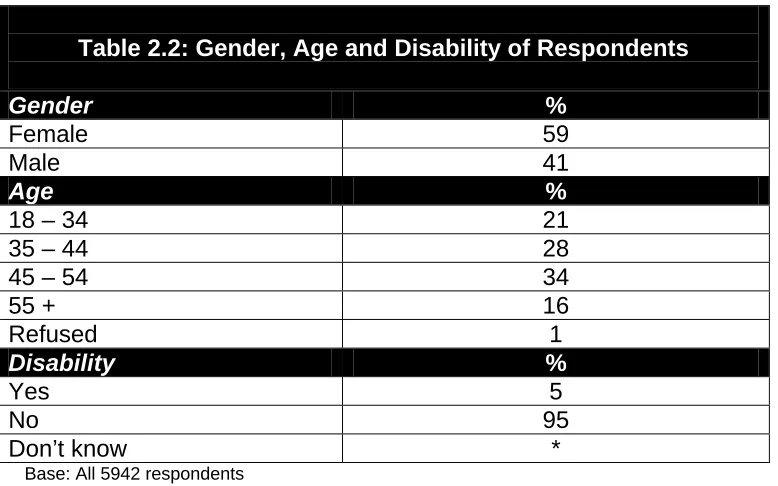
[image:20.595.106.495.363.606.2]2.19 Slightly more females (59%) participated in the survey than males (41%) (Table 2.2). This reflects the wider teaching population; similar results were identified through the HOST research and SIR reports that 59% of FE teaching staff are female.
Table 2.2: Gender, Age and Disability of Respondents
Gender %
Female 59 Male 41
Age %
18 – 34 21
35 – 44 28
45 – 54 34
55 + 16
Refused 1
Disability %
Yes 5 No 95
Don’t know *
Base: All 5942 respondents
Source: YCL/MORI quantitative survey of teaching/training staff, 2005
2.20 Approximately one-third of respondents (34%) were aged 45 to 54. 28% of respondents were aged 35 to 44, 21% were aged 18 to 34 and 16% were aged over 55. The HOST research indicated a similar age profile.
Ethnic Background
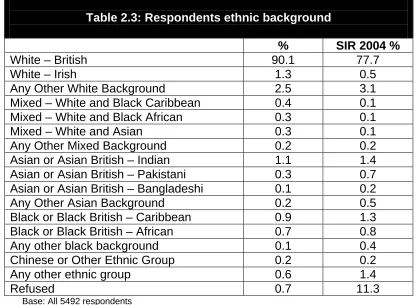
2.22 Nine out of ten respondents (90%) reported they belong to the ‘white-British’ group (Table 2.3). 2% of respondents reported they belong to the ‘other white background’ group and 1% of respondents reported they were ‘Asian British-Indian’, ‘black or black British-Caribbean’, and ‘black or black British-African’, respectively. This is similar to the HOST survey which found 92% of staff identified themselves as ‘white’ and 7% as specific minority ethnic groups.
[image:21.595.89.505.278.583.2]2.23 Furthermore, this is broadly in line with figures for the national population (7.9%, 2001 census) and the Staff Individualised Record (8.5%, SIR 2003-04).
Table 2.3: Respondents ethnic background
% SIR 2004 %
White – British 90.1 77.7
White – Irish 1.3 0.5
Any Other White Background 2.5 3.1
Mixed – White and Black Caribbean 0.4 0.1
Mixed – White and Black African 0.3 0.1
Mixed – White and Asian 0.3 0.1
Any Other Mixed Background 0.2 0.2
Asian or Asian British – Indian 1.1 1.4
Asian or Asian British – Pakistani 0.3 0.7 Asian or Asian British – Bangladeshi 0.1 0.2
Any Other Asian Background 0.2 0.5
Black or Black British – Caribbean 0.9 1.3
Black or Black British – African 0.7 0.8
Any other black background 0.1 0.4
Chinese or Other Ethnic Group 0.2 0.2
Any other ethnic group 0.6 1.4
Refused 0.7 11.3
Base: All 5492 respondents
Source: YCL/MORI quantitative survey of teaching/training staff, 2005 SIR 2003/04
Job Role and Organisation
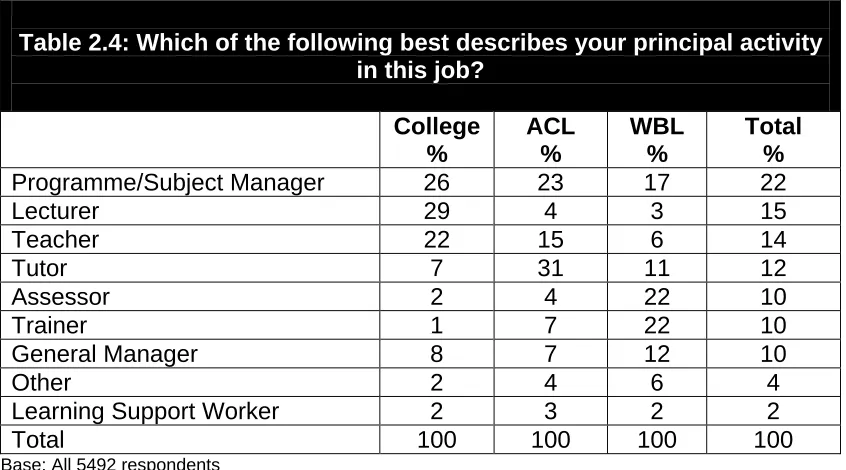
2.24 Respondents were asked to describe their principal job activity.
Table 2.4: Which of the following best describes your principal activity in this job?
College %
ACL %
WBL %
Total %
Programme/Subject Manager 26 23 17 22
Lecturer 29 4 3 15
Teacher 22 15 6 14
Tutor 7 31 11 12
Assessor 2 4 22 10
Trainer 1 7 22 10
General Manager 8 7 12 10
Other 2 4 6 4
Learning Support Worker 2 3 2 2
Total 100 100 100 100
Base: All 5492 respondents
Source: YCL/MORI quantitative survey of teaching/training staff, 2005
[image:22.595.118.541.110.345.2]2.25 The majority of respondents in the sample work for further education colleges (35%) and private training organisations (25%) (Table 2.5). Other organisations include adult and community learning services (14%) and sixth form colleges (12%). Smaller proportions of respondents work for employers providing in-house training (8%) and voluntary sector training organisations (4%).
Table 2.5: Which of the following best describes your organisation?
%
Sixth Form College 12
Further Education College 35
Adult and Community Learning Services 14
Private Training Organisation 25
Voluntary Sector Training Organisation 4 Employer Providing In-House Training 8
Other 2
Base: All 5942 respondents
Types of Provision
2.26 In addition to the organisation they work for, respondents were also asked what is the main area of LSC provision in which they work. Approximately one half of respondents (48%) work in further education funded provision (Table 2.6). A similar proportion (47%) are involved in work based learning provision. Approximately one-fifth (21%) of
respondents work in the adult and community learning sector.
Table 2.6: What is the main type of LSC funded provision you are involved with at this organisation?
%
Further Education 48
Work Based Learning 47
Adult and Community Learning 21
Other 1
Base: All 5942 respondents
Source: YCL/MORI quantitative survey of teaching/training staff, 2005
Note: sums to more than 100% because some respondents indicated that they work in more than one type of provision.
2.27 The vast majority of respondents (87%) work with 16 to 19 year olds (Table 2.7). Approximately two-thirds of respondents (67%) work with 20 to 24 year olds and 64% work with students aged over 25. A small
proportion of respondents (15%) work with 14 to 15 year olds.
Table 2.7: Which of these age groups do you work with?
%
14 – 15 years 15
16 – 19 years 87
20 – 24 years 67
25+ years 64
Base: All 5942 respondents
Source: YCL/MORI quantitative survey of teaching/training staff, 2005
Working Practices
Table 2.8: What is your current employment status in this job? College
%
ACL %
WBL %
Total %
Permanent 91 69 91 88
Fixed term contract (6 months or more) 6 15 5 7
Fixed term contract (6 months) 1 4 1 1
Sessional or hourly paid 2 10 1 3
Agency contract * * * *
Other * 2 2 1
Total 100 100 100 100
Base: All 5942 respondents
Source: YCL/MORI quantitative survey of teaching/training staff, 2005
2.29 The majority of respondents reported that they were employed full-time (80%). The remaining 20% were employed part-time, working an
average of 19 hours per week (Table 2.9). This differs from other estimates of the population, including those from the HR managers survey (see Table 2.16). The methodology sought full-time and part-time staff. This low proportion of part-time staff may be related to institutions under representing such staff in the sample provided for the survey.
Table 2.9: Are your standard weekly working hours in this job full-time or part-full-time?
%
Full-time 80 Part-time 20 Base: All 5942 respondents
Source: YCL/MORI quantitative survey of teaching/training staff, 2005
Subject
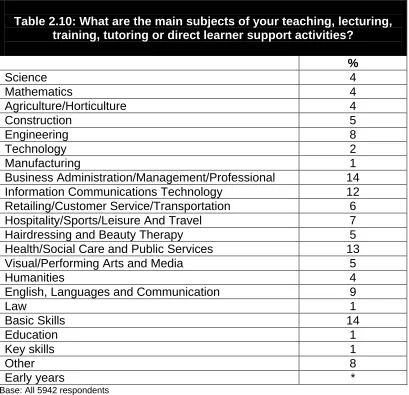
2.30 The main subjects taught by respondents are presented in Table 2.10. The largest proportion of respondents teach business/management related subjects (14%) and basic skills (14%). 13% of respondents teach health, social care and public services subjects and 12% teach
information communications technology. A small proportion of
Table 2.10: What are the main subjects of your teaching, lecturing, training, tutoring or direct learner support activities?
%
Science 4 Mathematics 4 Agriculture/Horticulture 4
Construction 5 Engineering 8 Technology 2 Manufacturing 1 Business Administration/Management/Professional 14
Information Communications Technology 12
Retailing/Customer Service/Transportation 6
Hospitality/Sports/Leisure And Travel 7
Hairdressing and Beauty Therapy 5
Health/Social Care and Public Services 13
Visual/Performing Arts and Media 5
Humanities 4
English, Languages and Communication 9
Law 1
Basic Skills 14
Education 1
Key skills 1
Other 8
Early years *
Base: All 5942 respondents
Source: YCL/MORI quantitative survey of teaching/training staff, 2005
2.31 Over a half (57%) of respondents indicated they spend some time per week teaching number based or arithmetic skills (Table 2.11).
Table 2.11: On average, how many hours a week do you spend teaching any number based or arithmetic skills?
%
Less than one hour 12
1-5 hours 25
6-10 hours 8
11-15 hours 4
16-20 hours 3
More than 20 hours a week 5
None 43
Base: All 5942 respondents
Source: YCL/MORI quantitative survey of teaching/training staff, 2005
2.33 Respondents were further asked if any of their main teaching or teaching related activities (regardless of the actual subject they taught) involved the specific programmes of learning presented in Table 2.12. Over one third of respondents indicated that they taught literacy (36%), 32% indicated they taught numeracy and 33% indicated they taught learners with learning difficulties and/or disabilities. 22% indicated that they work on the Entry to Employment Programme and 10% taught English as a second language.
Table 2.12: Are your main teaching or teaching-related activities in any of the following areas?
%
Literacy 36 Numeracy 32
English as a Second Language (ESOL) 10
Entry to Employment (E2E) 22
Learners with Learning Difficulties and/or Disabilities
33
None of these 39
Base: All 5942 respondents
Source: YCL/MORI quantitative survey of teaching/training staff, 2005
(ii) Quantitative Telephone Survey of HR Managers in
Further Education
2.34 The main aims of this survey of HR Managers were as follows:
• HR Managers views on the reasons for these;
• the reported impact of difficulties in recruitment and retention of staff.
2.35 Fieldwork was conducted between the 27th July and 16th August 2005. Of the 392 institutions many were unavailable during the fieldwork period. The final achieved sample size was 182 institutions (46% response rate). Key dimensions of the survey respondents are presented under a range of headings as follows:
• total staff employed;
• balance between part-time and full-time;
• use of temporary staff for teaching;
• use of agency staff.
Provider Type and Location
2.36 The sample’s characteristics in terms of provider type and location closely matched the proportions represented in the universe data (Table 2.13). General FE colleges were the largest sector accounting for
almost two thirds of respondents. Sixth form colleges represented just over a quarter of institutions and specialist colleges account for just under a tenth of colleges surveyed.
Table 2.13 Provider Type
Provider Type Respondents Population
General FE colleges 64% 65%
Sixth form colleges 27% 26%
Specialist colleges 9% 8%
Base: all 182 respondent Institutions
Source: YCL/MORI quantitative survey of FE HR managers, 2005
Table 2.14: Institution by Geographical Location
Survey sample Population
East of England 10% 10%
East Midlands 5% 7%
London 10% 10%
North East 7% 5%
North West 16% 17%
South East 19% 19%
South West 8% 9%
West Midlands 11% 13%
Yorkshire and Humberside 14% 11%
Total 100% 100%
Base: all 182 respondent Institutions
Source: YCL/MORI quantitative survey of FE HR managers, 2005
Teaching Staff and Management Staff
Table 2.15: Total Staff
Status ‘Occupation’ Numbers Percentage
Teaching Teachers/Lecturers 50,406 52%
Managers Teaching 3,823 4%
Total Teaching staff 54,229 56%
Non-teaching Principals/Deputy Principals 660 1%
Managers Non-teaching 1,891 2%
Other's3 41,066 42%
Total Total Staff4 97,846 100%
Base 174 Institutions supplying complete staffing numbers Source: YCL/MORI quantitative survey of FE HR managers, 2005 Note: Percentages do not sum to 100 due to rounding
Balance between part-time and full-time
2.39 HR managers reported that slightly fewer than three quarters of teaching staff are permanent (Table 2.16). Of these, the balance between full and part-time is 52% / 48%. This compares with 88% of permanent teaching in the teacher/tutor survey.
2.40 Results of the survey show that a significant proportion of staff in the post-16 college sector are employed on a non-permanent basis, this includes, agency and sessional staff, as well as those on a temporary contract.
3
Table 2.16: Working Arrangements of Teaching Staff
Status Numbers Percentage
Full-time (permanent) 25,865 38%
Part-time (permanent) 24,215 35%
Temporary (full and part-time) 14,492 21%
Agency Staff (full and part-time) 3,910 6%
Total 68,482 100%
Base: 174 Institutions supplying complete staffing numbers Source: YCL/MORI quantitative survey of FE HR managers, 2005 Note: the total in table 2.15 does not include agency staff
2.41 Over a quarter of institutions (28%) indicated that they currently use agency staff for teaching. Over three quarters (76%) of those institutions employing agency teaching staff indicated that these posts had been filled for more than six consecutive months (21% of the total sample).
2.42 The most common subject areas where teaching posts have been filled by agency staff for more than six months include:
• english, languages and communication;
• business administration, management and professionals;
• hairdressing and beauty therapy;
• ICT;
• health/social care and public services;
• visual/performing arts.
(iii) Qualitative Face To Face Interviews with Teaching
and Learning Staff
2.44 A total of 113 in-depth interviews, lasting around one hour, were conducted with teaching staff between March and June 2005.
Respondents were recruited from 30 learning and skills sector providers from the national LSC provider database. On average, four members of staff were interviewed in each providing organisation.
2.45 Selection of providers was balanced to ensure a spread of cases across the English regions. The 30 provider organisations were drawn from across the sector to reflect the proportionate size of each (in terms of number of providers):
• further education (8 providers);
• work based learning (14 providers);
• adult and community learning (8 providers).
2.46 Interviews were conducted with teaching staff from a range of subject areas. However, given the current policy emphasis on maths and science, teachers were disproportionately selected from these subject areas. The profile of participants by subject area is set out in Table 2.17 below.
Table 2.17: Profile of participants by Subject Area
Subject Number
Science 28 Maths 25
Other 59
Base: 113 valid respondents
Analysis
Limitations
2.48 This element of the research focussed on teachers/trainers who are currently working in the learning and skills sector. As such the research represents recruitment and retention issues from the personal
perspectives of those teachers who (presently) remain in the role. The views of those who have left the sector are not represented. This should be borne in mind when interpreting the findings.
(iv) Qualitative Telephone Interviews with Dissatisfied
Teaching and Learning Staff
2.49 This element of research involved a qualitative follow-up of staff working in the learning and skills sector, undertaken by MORI Social Research Institute. Follow-up interviews were conducted with 28 staff who had taken part in the quantitative phase of the research and reported dissatisfaction with their current post.
2.50 The purpose of the research is to explore the reasons behind
respondents’ dissatisfaction with their jobs and the implications of this on recruitment and retention in the learning and skills sector. Although respondents are drawn from a variety of subject areas, the study
concentrates on mathematics, science, engineering and technology staff because of the shortages in these subject areas.
2.51 A qualitative approach was selected for this study to explore in depth the reasons why respondents were dissatisfied with their job. This provided the opportunity to discuss issues in greater detail than the quantitative element of the research allowed.
2.52 A total of 28 telephone depth interviews - lasting around 30 minutes - were conducted between April and June 2005. During this period, interviews were suspended for a week due to the calling of a General Election. Respondents were selected from a list of teachers and trainers who said they were dissatisfied with their current job (see Q19 on the quantitative questionnaire), as well as having agreed to be re-contacted for further research during the quantitative interview.
3
MOTIVATION TO JOIN THE SECTOR
3.1 There are a range of reasons why people choose to join the post-16 learning and skills sector. This section covers issues relating to the background and characteristics of those joining and their specific motivations to join the sector.
Background and Characteristics of Those Joining
3.2 There is a wide range of variation across the sector in terms of the point at which teachers/trainers join the post-16 workforce. Key attributes explored below include:
• starting age;
• prior occupation.
Starting Age
3.3 Three-fifths of respondents (61%) started working in the learning and skills sector between the ages of 18 and 34. A further 28% of
respondents started between the ages of 35 and 44.
3.4 Those working only in further education were more likely to start working in the sector aged 18 to 34 (68%). Those working only in adult and community learning are less likely (51%) , but have a higher propensity to start working aged 35-44 (33%) and 45-54 (12%) compared with further education (24% and 6% respectively). The sector starting ages of those working in work based learning are between these two
extremes.
Prior Occupation
3.5 The majority of staff (78%) working in post-16 learning and skills occupations gained experience in other industry sectors. Smaller proportions came from different routes as outlined below:
• 12% of respondents had no previous occupational experience and came directly into the sector after full-time education;
• 9% of respondents worked as a school teacher before joining the sector;
3.6 Prior experience covered the whole range of industry sectors, the most common were:
• health and social work;
• other services;
• retail trade;
• education;
• public administration/defence.
3.7 Those in work based learning were more likely to have previously worked in industry, while those in further education and adult and community learning were more likely to have had no experience or to have worked as a teacher.
3.8 Qualitative research confirms that most entrants did not begin their career with a clear ambition to go into teaching/training in the post-16 sector. Thus, routes into the sector do not conform to a ‘traditional’ pathway direct from university or initial training.
3.9 Qualitative findings explore these routes further:
• entrants from industry;
• entrants from teaching;
• entrants with no previous experience.
Entrants from Industry
3.10 Many entrants from industry had experience of training or assessment – in some cases this informed their decision to go into teaching as they realised that they held an aptitude for, or enjoyed, teaching.
3.11 These entrants had worked in subjects as diverse as lab demonstration, parachute instruction and cookery – often acting as work based
assessors. Many left industry due to stress, or a desire to do something ‘more worth while'. These kinds of motivations included passing on or advancing their own knowledge, and contributing to the sector and practices within it: “I saw it as an opportunity to contribute to the way
apprentices are treated within the industry” [Work Based Learning].
Entrants from Teaching
3.13 Respondents who entered the post-16 sector after working for some time in secondary or primary school teaching had mostly trained in teaching or completed a PGCE directly after university. A small proportion trained in teaching later in their twenties or during their thirties. Most respondents from the schools sector indicated that they had not been aware of the post-16 sector at the beginning of their career.
3.14 The most frequently cited rationale for leaving school-teaching centred on discipline and learner motivation, many mentioned this as their primary motivation and most included it as a factor in their decision to move:
• “I don’t get rewarded for getting a student to sit still and behave,
what I enjoy doing is delivering my subject” [Further Education];
• “[adults] are only there because they want to learn” [Adult and
Community Learning];
• “I was tired of spending my time ‘lion taming’ [in school]” [Further
Education].
3.15 Teachers coming from both primary and secondary school also indicated that a desire to change their relationship with their main subject area had played a role in their move into the post-16 sector. Some primary school teachers expressed a desire to return to their subject, and secondary school teachers tended to want to teach at a higher level or hoped for greater flexibility in what aspects of their subject they would teach.
3.16 A proportion of female respondents with prior teaching experience entered the sector after having children because school teaching lacked the flexibility to fit around their family responsibilities.
Entrants with No Previous Experience
3.17 Only a small number of respondents join the sector early in their career after qualifying as a teacher via the PGCE route. Of those who do join as ‘new entrants’, after a teaching degree, very few embarked on teacher training with the expectation of working in the post-16 sector. Rather, this small sub-group tend to ‘discover’ the post-16 sector, specifically further education, whilst on their post-graduate course. Teaching in the post-16 sector is not a career that undergraduates are particularly aware of or aspire to:
• “once you have done a PGCE in science, you don’t automatically
think that is appropriate to go on and do FE or HE” [Further
• “I didn’t even know there was a PGCE in FE” [Further Education].
Motivation to Join
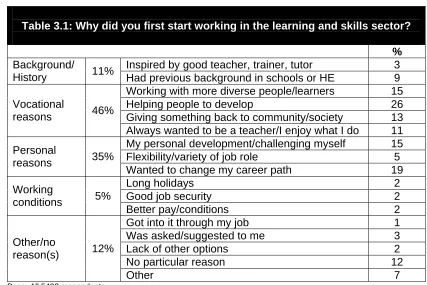
3.18 Overall, nearly half (46%) of respondents indicated some vocational reasons for joining the sector and just over a third (35%) indicated personal reasons (Table 3.1). One in ten (11%) reported
[image:36.595.111.538.199.484.2]background/history reasons and 5% mentioned working conditions.
Table 3.1: Why did you first start working in the learning and skills sector?
%
Inspired by good teacher, trainer, tutor 3 Background/
History 11% Had previous background in schools or HE 9 Working with more diverse people/learners 15 Helping people to develop 26 Giving something back to community/society 13 Vocational
reasons 46%
Always wanted to be a teacher/I enjoy what I do 11 My personal development/challenging myself 15 Flexibility/variety of job role 5 Personal
reasons 35%
Wanted to change my career path 19
Long holidays 2
Good job security 2 Working
conditions 5%
Better pay/conditions 2 Got into it through my job 1 Was asked/suggested to me 3 Lack of other options 2 No particular reason 12 Other/no
reason(s) 12%
Other 7
Base: All 5492 respondents
Source: YCL/MORI quantitative survey of teaching/training staff, 2005
3.19 The major specific reasons mentioned by respondents were helping people to develop (26%), 19% reported they wanted a change in career path and 15% wanted to work with more diverse people/learners or for their own personal development.
3.20 There are some differences in motivating factors, between types of provision and types of job role, which are identified below. However, motivating factors did not differ among subject area, age, gender and ethnicity. Each of the following major motivations is explored below:
• vocational reasons;
• personal reasons;
Vocational Reasons
3.21 This is the major motivating factor mentioned by all types of staff (except assessors where vocational and personal reasons were at a similar level). Approximately one quarter of respondents reported that they joined the sector to help other people develop (26%). Other major reasons included; working with more diverse people/learners, giving something back to community/society and always wanting to be a teacher/trainer.
3.22 Learning support workers were more likely to cite vocational reasons (52%) than any other group.
3.23 Staff often describe the sense of achievement they get from conveying information to students and then seeing their students develop:
• “I enjoy the success we have with people who have not done well
at school. I think of FE as a second chance and the number of people I’ve had who have failed or just scraped through GCSEs who have then come out with good A’ levels, that’s what gets me
out of bed in the morning”. [Further Education];
• “I had a lot of pleasure and success from teaching….and I felt that
adults would be more motivated” [Adult and Community Learning].
3.24 Those working in adult and community learning were more likely to be motivated by working with challenging learners or those with bad experiences of education.
Personal Reasons
3.25 The two major personal reasons mentioned by respondents include; my personal development/challenging myself and wanting to change my career path.
3.26 Respondents who work in work based learning were more likely to report personal reasons (38%) for joining the learning and skills sector than those in further education (29%) and adult and community learning (31%).
3.27 Qualitative evidence indicates that some enter the sector as a result of chance. They had originally seen it as an opportunity for career
• “I’d spent about 15 years working on aircraft on the shop floor and I didn’t really know much about teaching at all but I went for the interview and I passed. And really up until then I didn’t have any thoughts about going into teaching at all and now I love it, I’ve been doing it for nearly four years. So if I’m being honest, it was just the chance of promotion, that’s why I went for it but now I’m in it, I’m
here to stay” [Work Based Learning];
• “to be perfectly honest, originally I did it as a stopgap because I
wanted to go back to university and do research and I thought it would be a relevant thing to do for a few years and then I
thoroughly enjoyed it and remained a teacher”. [Further Education]
3.28 Other personal motivations revealed in qualitative research related to women with families who are attracted by the sector’s comparatively flexible hours: “after my children I didn’t want to return [to banking], so I
got into a teaching course” [Adult and Community Learning]. A number
of women in further education who had previously worked as school teachers cited the more mature learner group and flexibility as key motivations.
3.29 This applied to those working in all sub-sectors, although for some it was only this search for flexible work which led them to ‘discover’ further education: “[I] taught primary, because of my children. I had a break , then came in through sessional teaching in the evenings, working up from 4 hours initially. I hadn’t known about the possibility of FE before that” [Further Education].
Background/History Reasons
3.30 The major background/history reason related to a personal or family background in schools or higher education with a smaller number mentioning inspiration by a good teacher/trainer. Respondents who work in the further education sector and the adult and community
learning sector were significantly more likely to report background/history reasons for joining the sector (16% respectively) than those who work in the work based learning sector (9%).
3.31 Among qualitative respondents there were a number of specific references to family links and inspiration or advocacy by former teachers/trainers:
• “the tutor said to me – have you ever though of tutoring?” [Adult
and Community Learning];
• “I met one of the managers at a toy library, and they encouraged
me to apply” [Adult and Community Learning].
Summary
3.32 Key points arising from the research relating to individuals motivation to join the sector are as follows:
• the majority of staff (61%) started working in the sector between the ages of 18 and 34;
• most entrants did not begin their career with a clear ambition to go into teaching/training in the post-16 sector. The majority of staff entered the sector after working in other industry sectors – smaller numbers entered from teaching or with no previous experience;
• entrants from industry were most likely to go into work based learning or adult and community learning provision. Many left industry due to stress or a desire to do something ‘more worthwhile’;
• only a small number of respondents joined the sector early in their career after qualifying as a teacher via the PGCE route. Few planned to join the sector and most ‘discovered’ the sector through a variety of means;
• the common reasons for leaving the school sector included better discipline and learner motivation;
• nearly half of respondents (46%) indicated some vocational
reasons for joining the sector, this was followed by just over a third of respondents (35%) who indicated personal reasons. The
biggest single reason for joining the sector was to help people to develop (26% of respondents), closely followed by those who wanted to change their career path (19%);
• a specific personal reason relating to women with families is the attraction of the sector’s comparative flexibility, particularly, compared with school teaching;
4
ENTRY TO THE SECTOR
4.1 This section covers issues relating to entry into the sector. It is structured as follows:
• experiences of entry routes;
• perceptions of entry routes;
• barriers.
Experiences of Entry Routes
4.2 Qualitative findings indicate that the recruitment experience is generally perceived as straightforward. The majority of respondents indicated that they underwent a formal recruitment process involving an application for an advertised post and attending a structured interview. Almost all respondents entering further education were involved in a rigorous and formal recruitment process including, in some cases, the requirement to deliver a presentation or lesson. This approach is adopted in general across the subject range but appears to be used particularly in the recruitment of maths and science teachers.
4.3 In a minority of cases more informal recruitment processes have been adopted. These have sometimes involved adverts and interviews but have often involved an element of networking and personal contact which has led to appointments.
4.4 Some factors cited by respondents which have helped to improve their recruitment, which apply both to the more formal and informal
approaches described above, include:
• personal links – where former students might be encouraged by a teacher/trainer to consider working in the sector;
• work tasters – which provide an opportunity for potential recruits to experience the delivery of a teaching/training session;
• specific encouragement by a former teacher/trainer.
4.5 Most strategies adopted by provider organisations, which staff are aware of, aim to overcome the general lack of awareness that those outside of the learning and skills sector have of available opportunities. For
Perceptions of Entry Routes
4.6 A majority of respondents (51%) disagreed with the statement that there
are not enough entry routes into the learning and skills profession. This
compares with 31% of respondents who agreed with this statement .
4.7 Respondents in work based learning provision were more likely to agree that there are not enough entry routes (36%) than respondents in adult learning and community provision (25%) and further education provision (23%).
[image:41.595.92.540.342.662.2]4.8 Figure 4.1 presents the findings by type of organisation. Respondents in sixth form colleges (19%), further education colleges (27%) and adult and community learning organisations (31%) were least likely to agree that there are not enough entry routes into the learning and skills profession.
Figure 4.1: Respondents who agree that there are not enough entry routes into the learning and skills profession, by type of
organisation
37%
34%
32%
31%
27%
19%
0% 5% 10% 15% 20% 25% 30% 35% 40%
Private training
In-house training
Voluntary sector
ACL FE college Sixth form
Base: All 5492 respondents
Source: YCL/MORI quantitative survey of teaching/training staff, 2005
Figure 4.2: Respondents who agree that there are not enough entry routes into the learning and skills profession, by subject
area taught
39%
37% 37%
33%
31% 30% 30%
28% 28% 26% 23% 20% 0% 5% 10% 15% 20% 25% 30% 35% 40% 45% Retai l Engine erin g Manuf acturi ng Basi c ski
lls Hair /be aut y Busi ness adm in ICT Hea lth/s ocia l Engl ish Tech nolo gy Ma ths Sci ence
Base: All 5492 respondents
Source: YCL/MORI quantitative survey of teaching/training staff, 2005
4.10 Further education HR Managers are generally of the view that there are sufficient entry routes into the Learning and Skills Sector. 54% of HR Managers disagreed that ‘there are not enough entry routes into the Learning and Skills Sector’. This compares with only 21% of HR Managers who agreed with this statement.
4.11 Qualitative findings support these results with respondents identifying that a range of routes into the sector exist.
Barriers to Entry
4.12 A major barrier to entry is awareness of the sector and the opportunities within it. From an existing staff perspective, two main issues were highlighted:
• difficulty in finding suitable contracts;
4.13 In terms of finding suitable contracts, two differing perspectives emerged. Some were often looking for flexible working hours to suit their lifestyle, for example, older employees who were looking for part-time hours. Conversely, some who had part-part-time work were often seeking more permanent and longer hours:
• “I did part-time jobs at two colleges for a while in the hope that one
thing or another would come up – the situation of only doing ad hoc
hours was very unsatisfactory” [Further Education].
4.14 The issue of lengthy recruitment periods related, in particular, to the adult and community learning sector. Some respondents felt that this may lead to the loss of good candidates who take up other opportunities. Our understanding is that this lengthy process can be related to
formalised decision making and the need to follow strict local authority procedures:
• “one of the downsides of working for the local authority compared
to being in further education was the lack of flexibility. We are restricted by local authority protocols which make the recruitment
process very long” [ACL];
• “there was a delay from sending in the application to finding out if I
had an interview or if the post was actually going to be funded. I
think it must have been six weeks before I got a reply” [ACL].
4.15 Some concern was raised that the new teaching qualifications
requirement may be acting as a barrier to some potential new recruits. Some specific concerns were raised by those in the adult community learning sub-sector in relation to Skills for Life tutors. They felt that there would be a time lag in getting staff trained up to this level which might exacerbate existing staff shortage problems.
4.16 Managers within the sector highlighted low pay as a significant barrier to recruitment. In particular, they mentioned the sector’s inability to
compete with industry and school pay which has led to potential recruits in not accepting a position in the sector. This issue is considered as a particular concern for IT tutors who are likely to be better paid in the private sector and maths and science teachers who are likely to be better paid in the school sector.
Summary
4.18 Key points relating to entry into the sector are as follows:
• the majority of staff working in the sector (51%) believe that there are enough entry routes into the learning and skills profession. Three out of ten respondents (31%) do not believe that there are enough entry routes;
• this view is supported by HR Managers within the FE sector with over half (54%) believing there are sufficient entry routes into the sector. Compared with 21% who do not;
• staff in work based learning provision have a more negative view of the adequacy of entry routes compared with those in further
education and adult and community learning;
• the recruitment experience is generally perceived as
straightforward with most members of staff undergoing a formal recruitment process involving an application for an advertised post and attending a structured interview;
• in a minority of cases more informal recruitment processes have been adopted involving networking and personal contacts;
• a major barrier to entry is awareness of the sector and the opportunities within it;
5
TURNOVER, VACANCIES AND HARD TO FILL VACANCIES
5.1 In this section, we explore issues relating to vacancies and hard to fill vacancies across the post-16 learning and skills sector. These are covered under the following headings:
• turnover
• vacancies;
• recruitment difficulties;
• response to recruitment difficulties;
• factors causing hard to fill vacancies.
Turnover
5.2 The HR managers survey determined that, over the past year, a total of 5,511 teaching staff have left their jobs within the colleges surveyed. This represents a turnover figure of 10% for the year. This compares well with turnover figures identified for the other parts of the economy, such as the national average across all sectors of 16%, according to the Chartered Institute of Personnel Development5.
5.3 Turnover in secondary schools was 12.5% between 1998 and 2001 and 14.7% in primary schools (DfES, RR640, 2005).
Table 5.1: Turnover of Teaching Staff in FE
Total teaching staff 53,879
Total teaching staff leaving 5,463
Turnover rate 10%
Base 174 Institutions supplying complete staffing numbers Source: YCL/MORI quantitative survey of FE HR managers, 2005
5.4 Large institutions tend to have a slightly lower rate of turnover (8%) compared with all other groups (small-11%, small/medium-12%, medium/large-10%). Unsurprisingly data showed that permanent teachers, who form the bulk of most institutions staff, accounted for the largest proportion of staff choosing to leave institutions.
5.5 Just under half of colleges (49%) indicated that they regularly collect data on leaver’s destinations.
5
5.6 The main destination for teachers leaving their post in a college was to take a post at another FE college. Over half of staff (55%) who are leaving go to work at a different college. 16% of staff leave due to retirement and 10% left for a post in a different industry. Only 6% of leavers joined the schools sector.
5.7 The volume of staff leaving to teach in another FE establishment
suggests most staff turnover does not result in people leaving the sector.