City, University of London Institutional Repository
Citation:
Miao, X., Zhang, Q. ORCID: 0003-0982-2986, Atkin, C.J. ORCID: 0000-0003-2529-1978, Sun, Z. and Li, Y. (2018). Improving Purge Air Cooling Effectiveness by Engineered End-Wall Surface Structures-Part II: Turbine Cascade. Journal OfTurbomachinery, 140(9), 091002. doi: 10.1115/1.4040854
This is the accepted version of the paper.
This version of the publication may differ from the final published
version.
Permanent repository link:
http://openaccess.city.ac.uk/id/eprint/20897/Link to published version:
http://dx.doi.org/10.1115/1.4040854Copyright and reuse: City Research Online aims to make research
outputs of City, University of London available to a wider audience.
Copyright and Moral Rights remain with the author(s) and/or copyright
holders. URLs from City Research Online may be freely distributed and
linked to.
City Research Online: http://openaccess.city.ac.uk/ [email protected]
1
Improving Purge Air Cooling Effectiveness
by Engineered End-Wall Surface Structures
– Part II: Turbine Cascade
Xin Miao e-mail: [email protected] Qiang Zhang e-mail: [email protected] Chris Atkin e-mail: [email protected] Zhengzhong Sun e-mail: [email protected]
Department of Mechanical Engineering & Aeronautics City, University of London
Northampton Square, London, EC1V 0HB, United Kingdom
Y S Li
e-mail: [email protected]
Siemens Industrial Turbomachinery Limited Lincoln LN5 7FD, UK
ABSTRACT
Motivated by the recent advances in Additive Manufacturing (AM), a novel turbine end-wall aerothermal
management method is presented in this two-part paper. The feasibility of enhancing purge air cooling
effectiveness through engineered surface structure was experimentally and numerically investigated. The
fundamental working mechanism and improved cooling performance for a 90-degree turning duct are
presented in Part I. The second part of this paper demonstrates this novel concept in a low-speed linear
cascade environment. The performance in three purge air blowing ratios is presented and enhanced cooling
2
ratios. The CFD analysis indicates that the additional surface features are effective in reducing the passage
vortex and providing a larger area of coolant coverage without introducing additional aerodynamic loss.
INTRODUCTION
Purge air cooling has been one of the widely used cooling techniques to protect
the turbine end-wall from over-heating. In practice, one major challenge in purge air
cooling is the presence of passage secondary flow vortices, which could lift the cooling air
off the end-wall and result in a rapid decay in cooling performance.
The contribution of passage vortex to the total aerodynamic loss in a turbine blade
row can be as high as 30-50%, according to the study of Sharma and Butler [1]. A lot of
research efforts have been made towards this topic over the past decades. Hawthorne
[2] first proposed an end-wall vortex model, which shows the passage vortex but omitting
the formation of horseshoe vortex at the leading edge. Langston et al. [3] updated the
secondary flow model based on their measurement. They showed that at the inlet of the
blade passage, the boundary layer separates at the blade leading edge and gives rise to
the horseshoe vortex. One leg of the horseshoe vortex moves into the blade passage and
travels from the pressure side to the suction side and eventually evolves into passage
vortex. The other leg of the horseshoe vortex enters the adjacent passage and forms the
counter vortex. Sieverding and Bosche [4] studied the development and the interaction
between the passage vortex and counter vortex through smoke visualization. The
understanding of multi-vortex flow organization was further advanced by Wang et al. [5]
3
The highly three-dimensional flow in the cascade underpins the thermal
performance. Blair [6] studied the end-wall heat transfer in a vane passage and reported
that the end-wall heat transfer is strongly influenced by the existence of the large vortex
located in the corner between the end-wall and the suction surface. The end-wall heat
transfer measurement result by the work of Graziani et al. [7] show that the heat transfer
coefficient on the suction surface is influenced by the passage vortex, while the heat
transfer coefficient on the pressure surface is not affected by the secondary flow. Hylton
et al. [8] performed heat transfer measurement in an uncooled linear cascade end-wall,
and found that the Stanton number near the blade leading edge is about three times
higher than that at mid-pitch of the passage entrance. Goldstein and Spores [9] further
confirmed that very high heat transfer coefficient appears near the leading edge due to
the existence of horseshoe vortex. The passage vortex and corner vortex enhance the
heat transfer at downstream locations. Near the trailing edge, a significant increase in
heat transfer exists mainly due to the strong mixing of two flows from both sides of the
blade. The effect of free stream turbulence was considered in the study of Kang and Thole
[10] and Radomsky and Thole [11]. It was found that the heat transfer increases as the
turbulence intensity increases.
End-wall film cooling has been studied by many researchers, including Goldman
and McLallin [12], Sieverding and Wilputte [13], Freidrichs et al. [14], Han et al. [15], and
Chyu [16]. All these works deliver a consensus that the secondary flow has a strong
4
Much research attention has been paid to mitigating the secondary flow. End-wall
contouring is one of the passive flow control methods. Rose [17] pioneered the concept
of using a non-axisymmetric end-wall profile to alter the static pressure distribution. A
three-dimension end-wall profile was designed in both axial and circumferential
directions. The CFD results show that the end-wall contouring leads to 70% reduction of
the static pressure non-uniformities. Yan et al. [18] employed convex and concave
curvature on different regions of end-wall. Their experimental and numerical results
proved that 20% reduction in the pressure loss can be achieved. Harvey et al. [19]
designed the non-axisymmetric end-wall by using the linear design system. The CFD
results show that the exit flow overturning and underturning are largely reduced, the two
legs of the horseshoe vortex are appropriately controlled by the convex and concave
profile. Hartland et al. [20] and Ingram et al. [21] reported similar findings with a net
secondary loss reduction of about 24% by using end-wall contouring. Saha and Acharya
[22] profiled the end-wall by combining two curves which vary in the streamwise and
pitchwise direction respectively. The numerical results show that the total pressure loss
is lower than that in the smooth end-wall case. Praisner et al. [23] used a gradient-based
optimization algorithm to design the end-wall for the low-pressure turbine. The numerical
prediction shows that the non-axisymmetric endwall contouring is effective in reducing
passage vortex and pressure loss. Leading edge modification is another flow control
method to alter the horseshoe vortex development. Han and Goldstein [24] used fillet
geometry around the blade leading edge, which removes the horseshoe vortex and
5
geometry onto an inlet guide vane. The bulb design strengthens counter vortex, which
counter-acts the passage vortex. Becz et al. [26] compared both Sauer bulb and fillet
configurations in a large-scale cascade. The results indicate that the large bulb geometry
does not reduce total loss, while the small bulb and fillet geometries show equal
area-averaged total loss reduction of 8%. The principle of end-wall fence concept was to alter
the cross passage flow away from suction side by employing a single fence to the
end-wall surface. Kawai [27] installed the fence with several heights on the end-end-wall as well as
blade suction surface. The most effective control was achieved when the fence height
equaled to 1/3 of the undisturbed boundary layer thickness and placed in the middle of
the blade passage. Chung et al. [28-29] used the flow visualization method and LDV
measurement to study the effect of a triangular-shaped fence. The results show that the
strength of the vortical motion is largely reduced by the end-wall fence, especially for the
pressure side leg of the horse vortex. Latterly, Govardhan et al. [30] and Zhong et al. [31]
investigated end-wall fence with different length, height, and pitch-wise installation
location. The fences under investigation were also found effective in preventing the
development of the horseshoe vortex filament on the pressure surface. However, the
design has not been practically implemented in turbines due to the concern of being burnt
out by the hot gas.
Very recently, motivated by the advances in manufacturing technology, especially
Additive Manufacturing, Miao et al. [32-33] proposed a new secondary flow control
technique: adding engineered surface structure onto the end-wall surface. The strength
6
wavy grooves. The present study continues to investigate the feasibility of enhancing
purge air cooling effectiveness through these engineered surface features. Part I of this
paper presents experimental and numerical findings of cooling enhancement from a 90º
turning duct, which was used as a simplified turbine passage without the horseshoe
vortex. In the Part II of this paper, purge air cooling performance on the end-walls of a
linear cascade with and without small-scale ribs are reported. Cooling effectiveness, heat
transfer coefficient, and net heat flux reduction data were obtained and analyzed through
transient thermal experiment in a low speed tunnel. CFD simulation using commercial
code ANSYS FLUENT was also conducted to confirm the experimental findings and further
reveal the physics behind.
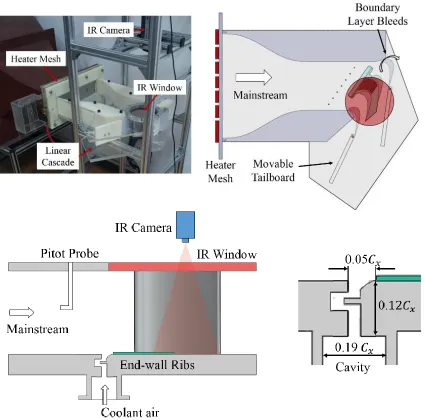
EXPERIMENTAL FACILITY AND MEASUREMENT TECHNIQUES
Transient thermal measurement was conducted in a low-speed linear cascade
facility shown in Fig.1. The test section contains four blades and three flow passages. Near
the suction-side sidewall, two boundary layer bleeds and two movable tail-flaps were
designed and adjusted to deliver a reasonable flow periodicity. The inlet test section is a
rectangular cross-section with dimensions of 130 mm (W) by 80 mm (H). The inlet velocity
was maintained at 20 m/s and the turbulence intensity at the test section inlet is about
1%.
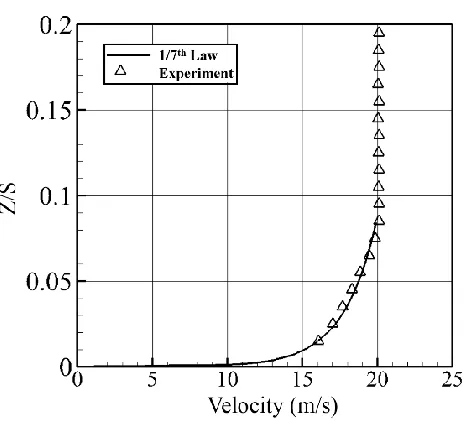
The inlet boundary layer thickness was measured by using a boundary layer probe
7
tip to minimize potential errors in total pressure measurement. Figure 2 shows the
measured inlet velocity profile. Due to the probe wall interaction, the data was not valid
within 1 mm height to the end-wall. A typical turbulent boundary layer characteristic can
be observed. The Inlet boundary layer thickness and shape factor are 6mm and 1.3,
respectively. The inlet total and static pressures were measured by a pitot-static probe at
the same location. In the present study, the turbine blade profile is similar to the one
studied by Wright et al. [34]. Details of the flow condition and blade geometry are
summarized in Table 1.
A heater mesh was installed upstream of the test section to provide a step
increase in mainstream flow temperature. The mesh is powered by a 100 kW DC power
and raises the mainstream temperature to 345K. A zinc selenide window was flush
mounted into the cascade top wall, so that the entire middle passage is within the field
of view of the infrared (IR) camera.
FLIR A325 IR camera was employed in the thermal measurement. It has a spatial
resolution of 320×240 pixels with a 16-bit grayscale. The IR camera is equipped with a
lens of 18 mm focal length. The frequency of the IR camera is 60 Hz. An In-situ calibration
of the IR camera, similar to previous research by Schulz [35], O’Dowd et al [36], and Zhang et al. [37-39], was conducted in the present study.
Two types of end-wall, smooth and ribbed were used in the experiments. On the
ribbed end-wall surface, the ribs start from the rim seal exit to 55% chord downstream of
8
material has a very low thermal conductivity. The rib array geometry is summarized in
Table 2.
The purge air system is similar to the one used in the Part I paper. The cooling air
of 293 K is supplied through a vortex tube, and the flow rate was measured by a digital
flow meter. A thermocouple is attached inside the cavity. The cooling flow enters the
wind tunnel through a labyrinth-like rim seal. Detailed geometry of the rim seal is also
shown in Fig.1. This rim seal design prevents ingestion of the hot mainstream gases into
the engine cavity and accurately represents the stator-rotor rim seals in real turbine. The
rim seal is located 22.7% 𝐶𝑥 upstream of the blade leading edge and covered a width of
1.5 blade passages. The slot dimensions and flow conditions are same as the experiment
of Wright and Han [34]. Three purge air blowing ratios (0.7, 1.0, and 1.3) were studied.
Transient thermal measurement technique was used in the present study. Figure
3a presents the time histories of the cold purge air, end-wall and inlet temperatures
during a typical transient experiment. After a step heating by the heater mesh, the
mainstream temperature (red color) and the temperate of cold purge air (blue color) were
maintained at a relatively constant value for a short period of time.
For an established flow field near the end-wall surface, the heat transfer
coefficient can be defined as,
𝑞′′ = ℎ(𝑇𝑎𝑑− 𝑇𝑤) (1) where 𝑞′′ is the heat flux, 𝑇
𝑎𝑑 is adiabatic wall temperature, 𝑇𝑤 is end-wall
temperature. For the solid side, it is reasonable to assume one dimensional semi-infinite
9
local heat flux can be calculated directly based on the transient wall temperature history
and material thermal properties. In this study, a well-established Impulse Response
Method, developed by Oldfield [40] and further implemented by a series of research by
O’Dowd et al. [36], Zhang et al. [37-39], and Ma et al [41], was employed. This method uses discrete deconvolution and a pair of nonsingular analytical solutions to the
convective heat transfer equation to derive a digital filter impulse response, then the heat
flux can be determined from temperature traces based on the convolution integral. The
measured thermal product √𝜌𝐶𝜅 of the end-wall material is 564 √𝑠/m2K (previously
reported by Ma et al [41]).
Figure 3b shows the time history of local heat flux (calculated) and wall temperature
(measured) for a sample location on the end-wall during one transient measurement.
Both heat flux and temperature values were non-dimensionalized. All the data points in
Fig. 3b follow a linear trend, which indicates and proves the validity of the convection
equation (1) and establishment of the flow field during the transient experiments. Both
heat transfer coefficient and adiabatic wall temperature can be obtained from linear
regression: the slope of the regression line is the Nusselt number and the x-axis
interception is the adiabatic wall temperature.
However, the semi-infinite 1-D conduction is a poor assumption near all the corners
of the ribs as lateral conduction (mostly 2D) effects dominate (O’Dowd et al. [36] and
Jiang et al. [42]). In the present study, a case study on 2D transient conduction analysis
was conducted to assess the errors for the near-rib region if the 1D conduction is still
10
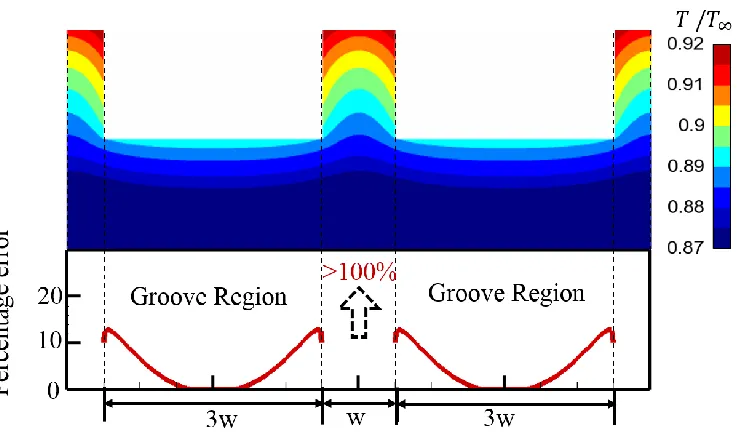
practice can be found in Jiang et al. [42]. Figure 4 shows the temperature contour within
the solid three seconds after the ribbed wall is suddenly exposed to convection with a
typical constant heat transfer coefficient value and fluid driving temperature (70 w/m2K
and 345 K, respectively, in the present experiments). The Impulse Response method is
employed next to calculate the heat flux history based on the semi-infinite 1D assumption
and the complete temperature trace during the transient heating history. The percentage
differences between the calculated values and the specified heat transfer coefficient (true
value) is shown in Fig. 4. The 1D conduction assumption is proved to be reasonable for
locations at the central region of rib groove, which covers about 60% of the ribbed surface
area. As expected, the solution shows an overestimated heat transfer coefficient with an
error over 10 percent near the corner. The semi-infinite assumption is absolutely not valid
for rib top surface (over 110% error). Therefore, data shown on the rib top surface and
groove corner regions can only be cautiously examined for their qualitative trend.
EXPERIMENTAL UNCERTAINTY
A jitter analysis described by Moffat [43] was used to determine the overall
uncertainty in the experimental study. The sources of experimental uncertainty include
measured wall temperature, material properties, the calibration of the IR camera,
mainstream and coolant temperature variations and measurement, etc. For transient
thermal measurement and the Impulse method employed in the present work, the linear
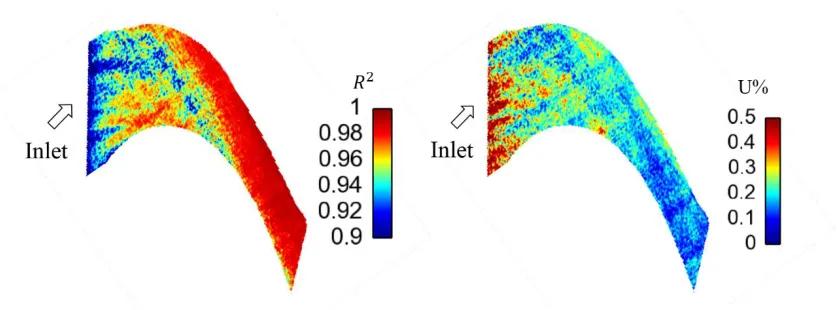
11 presents a detailed distribution of R2 in the measurement area for the smooth end-wall
case. For the majority of the measurement region, R2 is well above 0.9.
The 95% confidence level was used to estimate the uncertainty in the transient
thermal measurement. Four repeated transient tests were taken for each type of
end-wall surface. Figure 5b shows the contour of relative uncertainty in adiabatic end-wall
temperature. The relative uncertainty in Tad is below 0.5% for most of the test surface.
In the present experimental study, the element systematic error sources mainly come
from the wall temperature measurement and the determination of end-wall material
property (also reported previously by O’Dowd et at. [36]). A summary of uncertainty
values for various measurement properties is presented in Table 3.
COMPUTATIONALDETAILS AND VALIDATION
Steady Reynolds-Averaged Navier-Stokes (RANS) simulation was performed by
using ANSYS FLUENT software. The k-ω shear stress transport (SST) turbulence model was
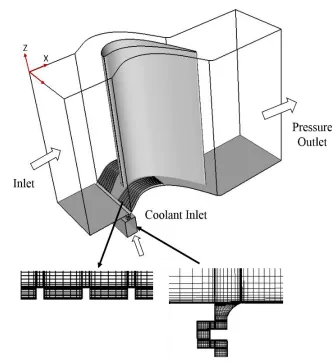
selected to model the turbulence. The computational domain is shown in Fig. 6, which
includes one blade with periodic boundary conditions, rim seal and purge air cavity. The
blade profile, flow angel and inlet boundary conditions are the same as the experiment
setup. The temperatures at cascade inlet and purge air inlet were set as 345 and 293K,
respectively, according to the thermocouple measurements. The duct outlet boundary
condition was specified as ambient pressure. Isothermal boundary conditions with two
different temperatures, namely 300 K and 310 K, are applied on the end-wall for the
12
two-point method is based on the assumption that the flow field is independent of the
temperature boundary condition within the range of the two isothermal values.
The flow domain shown in Fig. 6 is discretized with fully structured hexahedra
mesh created by using Pointwise software. The grids in the purge air rim seal and around
the ribs are also shown in Fig. 6. The total grid size is about 5 million cells and the 𝑦+on
the end-wall is in the range of 1-2. The blade pitch is used as the length scale for
non-dimensionalization. Three grid sizes were studied to check the grid independence. The
grid of 5 million cells was chosen for further analysis, considering the heat flux value is
not changed with larger grid density. Visualization of the CFD results was accomplished
by using a commercial software Ensight.
The simulation strategy employed in this paper was validated against
benchmarking experimental data previous by Wright et al. [45] in a linear cascade. Same
experimental boundary conditions and turbine cascade dimension are employed in the
CFD simulation. Figure 7 shows the end-wall film cooling effectiveness distributions from
both experiment and CFD. The overall agreement is satisfactory. The coolant in CFD
prediction is less diffused than in experiment, which is a typical performance behavior for
a standard RANS solver. The interaction between secondary flow and cooling fluid needs
to be better resolved by CFD solvers with high-fidelity, such as LES. Results in Figs 6a and
6b consistently indicate that the purge air is quickly swept to the blade suction side after
13
Note that the CFD data in Fig. 6 are only for benchmarking comparison. There is a
slight difference in purge air slot location between Wright et al. [34] and Wright et al. [45].
Results presented next are from a configuration similar to Wright et al. [34].
RESULTS AND DISCUSSIONS
Experimental data of cooling effectiveness, heat transfer coefficient, and Net Heat
Flux Reduction, for different purge air blowing ratios (BR=0.7, 1., 1.3) are firstly presented
in this session. The case for BR=1.0 was selected for further comparison with CFD and
detailed analysis. The flow physics associated with the end-wall ribs are discussed,
together with design optimization strategy and potential applications.
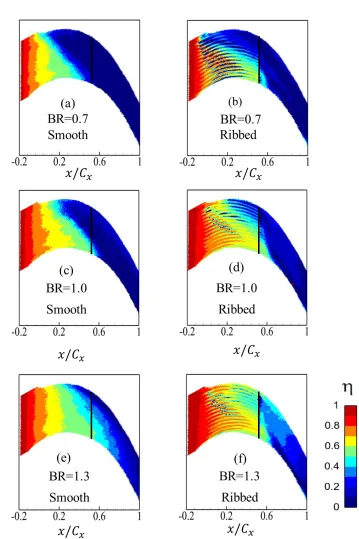
Figure 8 presents film cooling effectiveness 𝜂 measured on the smooth and ribbed
surface for different blowing ratios. The film cooling effectiveness is calculated from:
𝜂 =𝑇∞− 𝑇𝑎𝑑
𝑇∞− 𝑇𝑐 (2)
where 𝑇𝑐 is the cold purge air temperature, 𝑇∞ is the mainstream temperature, and 𝑇𝑎𝑑
is the adiabatic wall temperature.
In Fig. 8, a consistent enhancement in cooling effectiveness from the ribbed
end-wall cases can be observed by comparing to the results from the smooth cases. At all three
blowing ratios. Aligned by the small ribs, the cooling purge air is allowed to penetrate
further downstream and provide a much large coverage area. The higher effectiveness
with higher blower ratio is well-expected. However, for the cases with relatively lower
BRs, the film cooling effectiveness value is still low around the near pressure side region
14 surface due to insufficient cooling flow rate. Apparently, for a specific blowing ratio,
further design optimization of the surface structure is needed to avoid their direct contact
with the hot gas. As discussed in Part I of this paper, it is not possible to fully stop the
radial migration of the purge air flow. This ribbed end-wall concept should be combined
to conventional film cooling (or effusion cooling) in practice.
Figure 9 shows the distributions of heat transfer coefficient ratio ℎ𝑓
ℎ0 for cases with
three blowing ratios, where ℎ𝑓 is heat transfer coefficient measured with purge air flow,
and ℎ0 represents heat transfer coefficient without purge air flow for smooth end-wall.
High heat transfer coefficient ratio occurs near the exit of the purge air rim seal slot for
all the cases. Adding ribs increases the local heat transfer coefficient. An important
message from Fig. 9 is that, if this enhancement cannot be balanced out by a good level
of cooling effectiveness, there will be no benefit from ribbed end-wall design.
Net Heat Flux Reduction (NHFR), previously defined by Sen et al. [46], has been widely
used by to assess the combined outcome of the changes in film cooling effectiveness and
heat transfer coefficient. The NHFR is defined as below:
𝑁𝐻𝐹𝑅 = 1 −ℎ𝑓 ℎ0
(1 − 𝜂𝜑) (3)
𝜑 is the non-dimensional metal temperature, which is dependent on the metal
conductivity and internal cooling technology. The definition of 𝜑 is:
𝜑 =𝑇∞− 𝑇𝑐 𝑇𝑟− 𝑇𝑏
15
where 𝑇∞ is the mainstream temperature, Tc is the coolant total temperature, Tb is the
blade metal temperature, Tr is the recovery temperature. For a typical operational film
cooled turbine blade, a value of 1.6 is used based on the work of Sen et al. [46].
For end-wall region with ribs, the heat load introduced by additional surface area
needs to be taken into account. To fully assess the performance of ribbed structure, a Net
Heat Load Reduction (NHLR) is defined as,
𝑁𝐻𝐿𝑅 = 1 −
∫ ℎ𝐴 𝑓(𝑇𝑎𝑑− 𝑇𝑤)𝑑𝐴𝑓
𝑓
∫ ℎ𝐴 0(𝑇∞− 𝑇𝑤)𝑑𝐴0
0
= 1 −
∫ ℎ𝑓(𝑇𝑎𝑑 𝑇 𝑤
⁄ − 1) 𝑑𝐴𝑓 𝐴𝑓
∫ ℎ𝐴0 0(𝑇∞⁄𝑇𝑤− 1) 𝑑𝐴0
(5)
where the temperature ratios 𝑇∞/𝑇𝑤, 𝑎𝑛𝑑 𝑇𝑎𝑑/𝑇𝑤 can be replaced by typical values at
engine conditions. The NHLR definition can be further simplified as follows:
𝑁𝐻𝐿𝑅 = 1 −
∫ ℎ𝐴𝑓 𝑓(1 − 𝜂𝜑)𝑑𝐴𝑓
∫ ℎ𝐴0 0𝑑𝐴0
(6)
Due to the experimental errors near the small ribs and lack of information from
the rib side walls, it is not possible to estimate and compare experimental NHLR values.
NHLR data can only be assessed based CFD data discussed next.
The distributions of NHFR based on experimental data are still presented in Fig. 10
to illustrate the local performance over the projected end-wall wall. For the BR=1.0 and
1.3 cases, significant NHFR enhancement by ribbed surface can be observed near the
purge air entry region as well as the further downstream area. This is mostly due to the
16 needs from the downstream end-wall region should be greatly reduced. On the other
hands, the benefit of ribbed surface for BR=0.7 case is less obvious. There are some
enhancements from the ribs near the suction side region, however a large amount of
ribbed surface area is exposed to the hot gas due to low cooling flow supply. The rib
geometry needs to be carefully optimized to suit the operational range of purge air
blowing ratio.
In addition, the overall improvement is less significant compared with the results
reported in Part I paper for a simplified curved channel, which can be attributed to the
detrimental effect from the strong horseshoe vortex.
Next, CFD results for BR=1.0 case are presented, and the detailed flow structure
and aerodynamic performance are discussed.
Figures 11, 12, and 13 presents CFD results of the film cooling effectiveness, heat
transfer coefficient ratio ℎ𝑓
ℎ0, and NHFR, respectively. Overall a good qualitative agreement
can be observed in comparison with the experimental results shown in Figs 8-10.
Quantitively, there are discrepancies between experimental and CFD results. Similar to
the performance shown in Part I paper, the RANS CFD results are less diffused than the
measurement data. The complex interactions between horseshoe vortex, passage vortex,
and end-wall ribs needs to be better resolved by CFD solvers with high-fidelity (such as
LES).
For BR=1.0 case, the overall Net Heat Load Reduction (NHLR) based on all the exposed
17
case. More improvement on NHLR is expected for the BR=1.3 case based on the
observations in Figs. 10e and 10f. It seems that, instead of reducing the global heat load,
the benefit of ribbed end-wall is on spreading the coolant to a much wider end-wall area.
Potentially additional film cooling might not be needed for some further downstream
region. There should also be a large design space to optimize the rib structure to gain
further enhancement in NHLR (as discussed in Part I paper).
The vortices developing in the turbine blade passage with and without ribbed
surface structure are visualized through Q-criterion, as shown in Fig. 14. The end-wall
surface is colored by the film cooling effectiveness 𝜂. Over the smooth surface (Fig. 10a),
the low momentum boundary layer fluids separates at the blade leading edge and
develops into the horseshoe vortex, which splits into two legs. One leg of the horseshoe
vortex develops over the blade suction surface and eventually joins the passage vortex.
The purge air injected through the rim seal is merged within the pressure side of
horseshoe vortex and swept to suction side quickly. This is consistent with the film cooling
effectiveness contour on end-wall surface. Figure 14b shows the horseshoe vortex is
greatly modified by the ribbed surface. The strength of suction side leg of horseshoe
vortex is much reduced, so as the passage vortex developed further downstream.
To visualize the coolant coverage over the end-wall, an iso-temperature surface
with non-dimensional fluid temperature 𝜃 = 0.6 is shown in Fig. 15. 𝜃 is defined as:
𝜃 = 𝑇 − 𝑇𝑐 𝑇∞− 𝑇𝑐
where 𝑇𝑐 is the cold purge air temperature, 𝑇∞ is the mainstream temperature and T is
18
is also an indication of the purge air concentration. Figure 15a clearly shows the injected
purge air is swept towards the blade suction side due to the strong pressure gradient.
With the addition of rib structures on the surface, the purge air cannot be immediately
swept towards the suction side, instead, it follows the streamlined ribs, and remains close
to the wall surface for a longer distance, resulting in a larger coverage over the
end-wall.
The distribution of non-dimensional fluid temperature 𝜃 within three
cross-sections along the blade passage is shown in Fig. 16. The three cross-sectional planes are
located at 20%, 50% and 65% chord from the leading edge. As revealed in Fig. 16, the low
temperature air tends to accumulate onto the suction side for both cases. At the 65% 𝐶𝑥
plane of the smooth end-wall case, the cold air has been lifted off the wall and are
contained in the passage vortex. For the ribbed surface case, most purge air concentration
spreads wider in the pitchwise direction while stays closer to the end-wall and occupy the
rib channels at 20% and 50% 𝐶𝑥 cross sections. Compared with the smooth case, the near
wall temperature in ribs surface passage is much lower.
The streamwise vorticity in the three cross planes at 20%, 50% and 65%Cx are
presented in Fig. 17 to reveal the evolution of the secondary flow. The streamwise
vorticity is calculated as
𝛺𝑠 = 𝛺𝑥𝑐𝑜𝑠𝛽𝑚𝑖𝑑+ 𝛺𝑦𝑠𝑖𝑛𝛽𝑚𝑖𝑑,
where 𝛽𝑚𝑖𝑑 is the relative angle between the local blade camber angle and x-axis in
19
vorticity (red in color) is associated with the secondary vortex, while the positive vorticity
(blue in color) represents the vortex with an opposite rotation.
For the case with smooth end-wall, as the flow is turning, the passage vortex which
has negative streamwise vorticity develops and moves quickly across the passage. It
accumulates in the suction surface and end-wall corner at 65% Cx. While in the ribbed
case, the strength of passage vortex is largely reduced by the blockage effect of ribs. The
ribs also introduce vorticity with an opposite sign, which have been revealed as vortices
of smaller scale than the passage vortex. Two zoomed in pictures are also shown in Fig.
17b to illustrate the detailed flow development over these ribs. The black lines indicate
the secondary streamlines projected to the cross plane. Due to the occupation of the
positive vorticity, the cross flow cannot follow the ribs curvature well and an earlier
lift-off of the streamlines can be observed. These flow structures are consistent and similar
to previous findings by Miao et al. [33].
Figure 18 shows contours of dimensionless entropy generation rate per unit
volume at three axial planes. As proposed by Denton [47], the entropy generation rate
per unit volume is given by
𝑇𝑆̇𝑣𝑜𝑙 = 𝜏𝑑𝑉
𝑑𝑛 +
𝜆 (𝑑𝑇𝑑𝑛) 2
𝑇
In Fig. 18, the value of 𝑇𝑆̇𝑣𝑜𝑙 normalized by 𝜌𝑒𝑉𝑒3/𝐶𝑥𝑇𝑒. As expected, high entropy
generation rate region is associated suction side and end-wall surfaces for both cases. But
there are apparent differences which are interesting to compare in detail. The stronger
20
relatively higher entropy generation rate, as shown in Fig. 18a. For the ribbed end-wall
case in Fig. 19b, higher entropy generation rate produced by the friction of rib surfaces is
shown in-between and on top of the ribs. This additional entropy generation due to
friction balances the benefit from the reduction of passage vortex. When the purge air
[image:21.612.90.523.312.377.2]exits the rib grooves, a higher rate region occurs due to the mixing loss at 65% Cx.
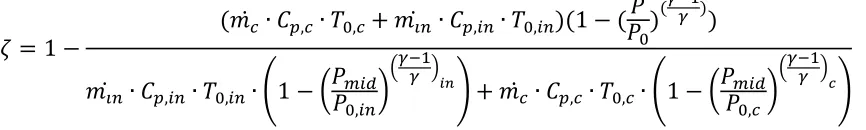
Figure 19 presents the distributions of aerodynamics loss coefficient at the exit
plane of the blade passage. The aerodynamics loss coefficient is defined as
𝜁 = 1 −
(𝑚̇ ∙ 𝐶𝑐 𝑝,𝑐∙ 𝑇0,𝑐+ 𝑚𝑖𝑛̇ ∙ 𝐶𝑝,𝑖𝑛∙ 𝑇0,𝑖𝑛)(1 − (𝑃 𝑃0)
(𝛾−1𝛾 ) )
𝑚𝑖𝑛̇ ∙ 𝐶𝑝,𝑖𝑛∙ 𝑇0,𝑖𝑛∙ (1 − (𝑃𝑃𝑚𝑖𝑑 0,𝑖𝑛)
(𝛾−1𝛾 )
𝑖𝑛) + 𝑚
𝑐
̇ ∙ 𝐶𝑝,𝑐∙ 𝑇0,𝑐∙ (1 − (𝑃𝑃𝑚𝑖𝑑 0,𝑐)
(𝛾−1𝛾 )
𝑐)
The difference between smooth and ribbed cases in aerodynamic loss is within 2%,
which is negligible considering the numerical accuracy of the RANS calculations. For the
ribbed end-wall, there is a trade-off between the additional mixing loss due to more
coolants brought to further downstream and the weakened passage vortex. Further
experimental investigation is needed to confirm this numerical observation.
SUMMARY AND CONCLUSIONS
The present study investigates a novel design methodology to improve purge air
cooling effectiveness by engineered end-wall surface structure in a linear turbine cascade
21
presented to demonstrate the feasibility of the concept and the working mechanism
behind.
Similar to the findings from the simplified turning duct study in the Part I paper, it
has been consistently observed that adding small ribs is able to reduce the horseshoe
vortex and passage vortex and provide favorable alignment to the cooling flow. The purge
air flow is found to cover a much larger area over the turbine end-wall. The enhancement
in cooling effectiveness is significant for purge air blowing ratio BR=1.0 and BR=1.3. CFD
results for BR=1 case show that there is no additional overall heat load introduced by the
increased surface area, and the additional aerodynamic penalty introduced by the small
ribs is negligible.
It is suggested that the surface feature should be optimized according to purge air
blowing ratio, blade loading, incoming flow boundary layer characteristics, etc. It should
be combined with conventional film cooling technique in practical design. Following the
similar flow control mechanism, small-scale surface feature can also be applied to other
aspects in turbomachinery, such as the exit region of film cooling holes and internal
cooling channels. The extra design space and flexibility offered by the advances in
22
NOMENCLATURE
𝐶𝑥 Axial chord
d Rib distance
EXP Experiment
h Rib height, Heat transfer coefficient (W/(m2-K))
IR Infrared
𝑚̇ Mass flow rate
n Rib number
P Pitch, Pressure
PS Pressure side
RANS Reynolds-Averaged Navier-Stokes
𝑅2 Coefficient of determination
S Span
SS Suction side
T Local temperature
𝑇𝑎𝑑 Adiabatic wall temperature
𝑇𝑏 Blade metal temperature
23
𝑇𝑟 Recovery temperature
𝑇𝑤 End-wall temperature
𝑇∞ Mainstream temperature
𝑉∞ Inlet velocity
w Rib width
Y/P Pitch-wise measurement location normalized by pitch
y+ Non-dimensional wall distance: y uty
Z/S Span-wise measurement location normalized by span
NHFR Net heat flux reduction
NHLR
Net heat load reduction 𝑁𝐻𝐿𝑅 = 1 −
∫𝐴𝑓ℎ𝑓(1−𝜂𝜑)𝑑𝐴𝑓
∫𝐴0ℎ0𝑑𝐴0
β Pitch angle
𝜃 Non-dimensional fluid temperature
δ Boundary layer thickness
𝜑 Non-dimensional metal temperature
𝜂 Film cooling effectiveness
24
REFERENCES
[1] Sharma, O., and Butler, T., 1987, “Predictions of End-wall Losses and Secondary Flows
in Axial Flow Turbine Cascades,” ASME J. Turbomach., 109, pp. 229-236.
[2] Hawthorne, W. R., 1955, “Rotatiional Flow through Cascades,” The Quarterly Journal
of Mechanics and Applied Mathemati, 8(3), 266-292.
[3] Langston, L.S., 1980, “Crossflows in a Turbine Cascade Passage,” ASME J. of
Engineering for Power, Vol. 102, pp. 866–874.
[4] Sieverding, C., and Bosche, V. D., 1983, “The use of colored smoke to visualize secondary flows in a turbine-blade cascade,” Journal of Fluid Mechanics, Cambridge
University Press, 134, pp. 85-89.
[5] Wang, H. P., Olson, S. J., Goldstein, R. J., and Eckert, E. R. G., 1997, “Flow Visualization
in a Linear Turbine Cascade of High Performance Turbine Blades,” ASME J. Turbomach.,
119, pp. 1-8.
[6] Blair, M.F., 1974, “An experimental study of heat transfer and film cooling on large-scale turbine endwalls,” ASME J. Heat Transfer, 96(4), pp.524-529.
[7] Graziani, R.A., Blair, M.F., Taylor, J.R. and Mayle, R.E., 1980, “An experimental study of endwall and airfoil surface heat transfer in a large scale turbine blade cascade,” Journal
of Engineering for Power, 102(2), pp.257-267.
[8] Hoylton, L.P., Mihelc, M.S., Turner, E.R. and York, R.E., 1981, “Experimental
Investigation of Turbine Endwall Heat Transfer,” AFWAL-TR-81-2077, Vols. 1–3.
[9] Golstein, R.J. and Spores, R.A., 1988, “Turbulent Transport on the Endwall in the
Region between Adjacent Turbine Blades,” ASME J. of Heat Transfer, Vol. 110, pp. 862–
869.
[10] Kang, M.B. and Thole, K.A., 1999, “Flow field Measurements in The Endwall Region
25
[11] Rodamsky, R.W. and Thole, K.A. 2000, “High Freestream Turbulence Effects on
Endwall Heat Transfer for a Gas Turbine Stator Vane,” ASME Paper 2000-GT-0201.
[12] Goldman, L.J. and McLallin, K.L., 1977, “Effect of Endwall Cooling on Secondary Flows
in Turbine Stator Vanes,” AGARD CP-214.
[13] Sieverding, C.H. and Wilputte, Ph., 1981, “Influence of mach Number and End Wall
Cooling on Secondary Flows in a Straight Nozzle Cascade,” ASME J. Engineering for Power,
Vol. 103, pp. 257–264.
[14] Friedrichs, S., Hodson, H.P. and Daws, W.N., 1996, “Distribution of Film-Cooling Effectiveness on a Turbine Endwall Measured Using Ammonia and Diazo Technique,”
ASME J. of Turbomachinery, Vol. 118, pp. 613–621.
[15] Han, J.C., Dutta, S., and Ekkad, S.V., 2000, Gas Turbine Heat Transfer and Cooling Technology, Taylor and Francis, New York, 646 pages.
[16] Chyu, M.K., 2001. Heat Transfer Near Turbine Nozzle Endwall. Annals of the New York Academy of Sciences, 934(1), pp.27-36.
[17] Rose, M., 1994, “Non-axisymmetric end-wall profiling in the HP NGV’s of and axial
flow gas turbine,” ASME Paper No. 94-GT-249.
[18] Yan, P. J., Gregory-Smith, D. G., and Walker, P. J., 1999, “Secondary Flow Reduction
in a Nozzle Guide Vane Cascade by Non-Axisymmetric End-wall Profiling,” ASME Paper
No. 99-GT-339.
[19] Harvey, N. W., Rose, M. G., Taylor, M. D., Shahpar, S., Hartland, J., and Gregory-Smith,
D. G., 2000, “Non axisymmetic Turbine End Wall Design: Part I: Three-Dimensional Linear
Design System,” ASME J. Turbomach., 122(2), pp. 278-285.
[20] Hartland, J. C., Gregory-Smith, D. G., Harvey, N. W., and Rose, M. G, 2000, “Non
axisymmetic Turbine End Wall Design: Part II – Experimental Validation,” ASME J.
Turbomach., 122(2), pp. 286-293.
[21] Ingram, G., Gregory-Smith, D., Rose, M., Harvey, N., and Brennan, G., 2002, "The Effect of End-wall Profiling on Secondary Flow and Loss Development in a Turbine Cascade," ASME Paper No. GT2002-30339.
[22] Saha, A. K., and Acharya, S., 2006, “Computations of Turbulent Flow and Heat
Transfer through a Three Dimensional Non-Axisymmetric Blade Passage,” ASME Paper
26
[23] Praisner, T. J., Allen-Bradley, E., Grover, E. A., Knezevici, D. C., and Sjolander, S. A,
2007, “Application of Non-Axisymmetric End-wall Contouring to Conventional and
High-Lift Turbine Airfoils,” ASME Paper No. GT2007-27579.
[24] Han, S. and Goldstein, R.J., 2005, “Influence of Blade Leading Edge Geometry on Turbine Endwall Heat (Mass) Transfer,” ASME Paper
No. GT2005-68590.
[25] Sauer, H., Muller, R., and Vogeler, K., 2001, “Reduction of Secondary Flow Losses in
Turbine Cascades by Leading Edge Modifications at the End-wall,” ASME J. Turbomach.,
123(2), pp. 207-213.
[26] Becz, S., Majewski, M. S., and Langston, L. S., 2004, “An Experimental Investigation of Contoured Leading Edges for Secondary Flow Loss Reduction,” ASME Paper No.
GT2004-53964.
[27] Kawai, T., 1994, “Effect of combined boundary layer fences on turbine secondary flow and losses,” JSME International Journal Series B Fluids and Thermal Engineering, 37(2),
pp.377-384.
[28] Chung, J. T., Simon, T. W., and Buddhavarapu, J., 1991, “Three-Dimensional Flow near the Blade/End-wall Junction of a Gas Turbine: Application of a Boundary Layer Fence,”
ASME Paper No. 91-GT-45.
[29] Chung, J.T. and Simon, T.W., 1993, “Effectiveness of the gas turbine endwall fences
in secondary flow control at elevated freestream turbulence levels,” ASME Paper No. 93 -GT-051.
[30] Govardhan, M., Rajender, A., and Umang, J. P., 2006, “Effect of Streamwise Fences
on Secondary Flows and Losses in a Two-Dimensional Turbine Rotor Cascade,” J. Thermal
Sciences, 15(4), pp. 296-305.
[31] Zhong, J., Han, J.A., Liu, Y. and Tian, F., 2008, “Numerical simulation of endwall fence
on the secondary flow in compressor cascade,” ASME Paper No. GT2008-50888.
[32] Miao, X., Zhang, Q., Atkin, C. and Sun, Z., 2016, “End-Wall Secondary Flow Control
Using Engineered Residual Surface Structure,” ASME Paper No. GT2016-57347
[33] Miao, X., Zhang, Q., Wang, L., Jiang, H., & Qi, H, 2015, “Application of riblets on
turbine blade endwall secondary flow control,” Journal of Propulsion and Power, 31(6),
27
[34] Wright, L.M., Blake, S.A. and Han, J.C., 2008, “Film cooling effectiveness distributions
on a turbine blade cascade platform with stator-rotor purge and discrete film hole flows,”
Journal of Turbomachinery, 130(3), p.031015.
[35] Schulz, A., 2000, "Infrared Thermography as Applied to Film Cooling of Gas Turbine Components." Measurement Science and Technology, vol. 11, no. 7, pp. 948.
[36] O’Dowd, D.O., Zhang, Q., He, L., Ligrani, P.M. and Friedrichs, S., 2011, “Comparison
of heat transfer measurement techniques on a transonic turbine blade tip,” Journal of
Turbomachinery, 133(2), p.021028.
[37] Zhang, Q., He, L., Wheeler, A.P.S., Ligrani, P.M. and Cheong, B.C.Y., 2011, “Overtip
shock wave structure and its impact on turbine blade tip heat transfer,” Journal of
Turbomachinery, 133(4), p.041001.
[38] Zhang, Q., O’Dowd, D.O., He, L., Oldfield, M.L.G. and Ligrani, P.M., 2011, “Transonic
Turbine Blade Tip Aerothermal Performance with Different Tip Gaps—Part I: Tip Heat
Transfer,” Journal of Turbomachinery, 133(4), p.041027.
[39] Zhang, Q., He, L., Cheong, B.C.Y. and Tibbott, I., 2013, “Aerothermal performance of a cooled winglet at engine representative Mach and Reynolds numbers,” Journal of
Turbomachinery, 135(1), p.011041.
[40] Oldfield, M.L., 2008. Impulse response processing of transient heat transfer gauge signals. Journal of Turbomachinery, 130(2), p.021023.
[41] Ma, H., Zhang, Q., He, L., Wang, Z. and Wang, L., 2017, “Cooling Injection Effect on a
Transonic Squealer Tip—Part I: Experimental Heat Transfer Results and CFD Validation,”
Journal of Engineering for Gas Turbines and Power, 139(5), p.052506.
[42] Jiang, H., Chen, W., Zhang, Q. and He, L., 2015, “Analytical-Solution Based Corner Correction for Transient Thermal Measurement,” ASME Journal of Heat Transfer, 137(11), p.111302.
[43] Moffat, R. J., 1988, “Describing the Uncertainties in Experimental Results,”
Experimental Thermal and Fluid Science, vol. 1, pp. 3–17.
[44] Devore, J.L., 2011, “Probability and Statistics for Engineering and the Sciences,”
Cengage learning.
[45] Wright, L.M., Gao, Z., Yang, H. and Han, J.C., 2008, “Film cooling effectiveness
distribution on a gas turbine blade platform with inclined slot leakage and discrete film
28
[46] Sen, B., Schmidt, D.L., and Bogard, D.G., 1996, “Film Cooling with Compound Angle
Holes: Heat Transfer”, J. of Turbomachinery, Vol. 118.
[47] Denton,J.D., 1993,”Loss Mechanisms in Turbomachines,” Journal of Turbomachinery,
29
Figure Captions List
Fig. 1 A schematic of experiment facility.
Fig. 2 Inlet end-wall boundary layer velocity profile measured one axial chord
upstream of the blade leading edge.
Fig. 3 (a) Time histories of the cold purge air, end-wall and inlet temperatures,
and (b) variations of wall heat flux and surface temperature during one
typical transient measurement for one selected wall location.
Fig. 4 Measurement errors due to 1D semi-infinite conduction assumption,
assessed through a 2D transient conduction analysis.
Fig. 5 (a) R2 distribution for linear regression, and (b) Relative uncertainty (%U)
in 𝑇𝑎𝑑 distribution.
Fig. 6 Computational domain and mesh.
Fig. 7 Film cooling effectiveness distributions obtained by Wright et al. [45]) and present CFD study.
Fig. 8 Distributions of film cooling effectiveness. (experimental data)
Fig. 9 Distributions of hf/ho. (experimental data)
Fig. 10 Distributions of NHFR. (experimental data)
Fig. 11 Distributions of film cooling effectiveness. (CFD results)
Fig. 12 Distribution of hf/ho. (CFD results)
Fig. 13 Distribution of NHFR. (CFD results)
30
Fig. 15 An iso-temperature surface with 𝜃 = 0.6
Fig. 16 Non-dimensional temperature 𝜃 distributions at three cross sections.
Fig. 17 Streamwise vorticity distribution at three cross sections.
Fig. 18 Dimensionless entropy generation rate per unit volume distributions at
three cross sections.
31
Table Caption List
Table 1 Flow condition of the test section and blade geometries.
Table 2 Geometry of ribs array on the end-wall.
32
33
34
Figure 3. (a) Time histories of the cold purge air, end-wall and inlet temperatures, and (b)
variations of wall heat flux and surface temperature during one typical transient
[image:35.612.163.474.65.415.2]35
Figure 4. Measurement errors due to 1D semi-infinite conduction assumption, assessed
36
Figure 5. (a) R2 distribution for linear regression, and (b) Relative uncertainty (%U) in 𝑇 𝑎𝑑
[image:37.612.96.515.244.399.2]37
38
[image:39.612.175.477.139.372.2](a) Experimental study (Wright et al. [45]) (b) CFD results from the present study
39
40
41
42
[image:43.612.97.525.125.345.2](a) Smooth surface (b) Ribbed surface
43
[image:44.612.92.516.153.380.2](a) Smooth surface (b) Ribbed surface
44
[image:45.612.94.505.154.362.2](a) Smooth surface (b) Ribbed surface
45
(a) Smooth surface
[image:46.612.167.445.122.477.2](b) Ribbed surface
46
[image:47.612.103.508.132.371.2]
(a) Smooth surface (b) Ribbed surface
47
[image:48.612.161.457.77.424.2](a) Smooth surface (b) Ribbed surface
48
[image:49.612.141.517.75.446.2](a) Smooth surface (b) Ribbed surface
49
[image:50.612.147.474.73.445.2](a) Smooth surface (b) Ribbed surface
Figure 18: Dimensionless entropy generation rate per unit volume distributions at three
50
[image:51.612.138.484.193.394.2](a) Smooth surface (b) Ribbed surface
51
Table 1. Flow condition of the test section and blade geometries.
Inlet Reynolds number (based on 𝐶𝑥) 7.44 × 10⁴ Exit Reynolds number (based on 𝐶𝑥) 1.86 × 10⁵
Inlet boundary layer thickness 6mm Inlet boundary layer momentum thickness 0.6mm Purge air Blowing Ratio 0.7, 1.0, 1.3
Inlet flow angle (from axial) 35°
Mean exit flow angle (from axial) 72.49°
Axial chord 56mm
Pitch 56mm
Span 80mm
Inlet flow angle (from axial) 35°
52
53
Table 3. Measurement uncertainties
Measurement Relative uncertainty 95% confidence Material property 5% (564±28 √𝑠/m2K)
Measured wall temperature 1K
h 9.7%

![Figure 7: Film cooling effectiveness distributions obtained by Wright et al. [45]) and present CFD study](https://thumb-us.123doks.com/thumbv2/123dok_us/1383778.91554/39.612.175.477.139.372/figure-film-cooling-effectiveness-distributions-obtained-wright-present.webp)