DATA DRIVEN APPROACH TO DECENTRALIZED CONTROL: A PRIMARY
FREQUENCY CONTROL STUDY
Mazheruddin H. SYED1, Efren GUILLO-SANSANO1, Eleftherios O. KONTIS2, Steven M. BLAIR1, Yan XU3 and Graeme M. BURT1
1University of Strathclyde 2Aristotle University of Thessaloniki 3Nanyang Technological University
United Kingdom Greece Singapore
[email protected] [email protected] [email protected]
ABSTRACT
The emerging needs and advantages of prioritizing remedial frequency control measures closer to the source of an imbalance event, i.e., to achieve targeted local frequency response, have recently been actively discussed in literature. This paper proposes the use of data driven approach to complement and enhance the robustness of one such decentralized targeted local primary frequency control. The methodology and implementation of the proposed approach is demonstrated by means of a case study on a reduced five area dynamic model of Great Britain power system and its performance verified by means of real-time simulations.
INTRODUCTION
The need to prioritize frequency response closer to the source of an imbalance event, within the first seconds of its occurrence, to ensure stable operation in a future, changing, constrained grid has been demonstrated in [1] and further discussed in [2] and [3]. Acknowledging this emerging need to incorporate locational information for a targeted remedial response to a power system imbalance, in [4], the term responsibilization has been introduced to denote the prioritization of remedial control measures closer to the source of an imbalance event.
Targeted local response requires fast-acting control and therefore it is best incorporated within primary frequency control (PFC), as proposed in [5]. This approach effectively coordinates a targeted local response by means of a location identification technique enabled by a wide-area monitoring system. The effectiveness of the approach within Icelandic and Great Britain (GB) power systems has been demonstrated. However, to reduce the costs associated with communications and measurements infrastructure associated with the proposed control, more decentralized approaches are being actively sought. One such approach, presented in [6], utilizes a new observable referred to as the transient phase offset (TPO) for effective location identification and a linear curve to introduce targeted local response by means of droop adaptation. The proof of introduction of targeted local response is demonstrated using a five-area reduced dynamic model of the GB power system. Although decentralized approaches alleviate the dependency on real-time communications and measurement infrastructures, the robustness of such approaches has not been thoroughly investigated. In
particular, the ability of these methods to distinguish true frequency disturbances from other system disturbances or events, such as faults, has not been discussed.
To address this gap, in this paper, the robustness of the TPO based decentralized PFC, proposed in [6], is discussed. To enhance the robustness of the adopted decentralized approach, a data mining technique is introduced to complement targeted local response. A number of data-driven approaches to complement frequency control have been presented in literature, however, none of the existing approaches tackle the objective of targeted local frequency response [7, 8]. In this paper, a data-driven model to identify the location of frequency events in a decentralized manner is developed. Towards this objective, the five-area reduced dynamic equivalent model of GB power system has been subjected to several disturbances. In the analysis, both “false” frequency events, such as faults, as well as “true” frequency events, such as loss of generation and loads, are examined. The performance of four classifiers is analysed and ranked based on their performance determined by their individual confusion matrix and model build time. To demonstrate the feasibility of the proposed approach for practical applications, a real-time validation of the best performing model is undertaken within a real-time digital simulator.
PRIMARY
FREQUENCY
CONTROL
APPROACHES
In this section, first the conventional PFC is briefly introduced to form a basis for clear explanation of targeted local approaches. This is followed by a brief review of a recently reported technique for targeted local response in literature [6]. In addition, the robustness of the approach is further discussed.
Conventional Primary Frequency Control
Figure 1: Example conventional droop curve.
𝑃𝑜𝑢𝑡= 𝑃0+
1
𝑅(𝑓0− 𝑓𝑚𝑒𝑎𝑠)
(1)
where 𝑃𝑜𝑢𝑡, 𝑃0 are the output active power and the power
set-point at nominal frequency (𝑓0,) respectively, 𝑓𝑚𝑒𝑎𝑠 is
the measured frequency and R is the droop gain. In a synchronous power system, the system operator designs the PFC such that each of the LFC areas within the synchronous area responds proportional to its capacity irrespective of where a disturbance originates within the system.
Targeted Local Primary Frequency Control
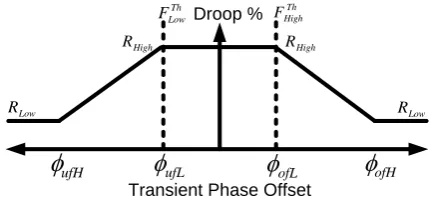
In [6], a PFC capable of achieving targeted local response is proposed. Targeted local response is achieved by means of identifying the location of the disturbance allowing for the droop of the LFC areas to be changed within[𝑅𝐿𝑜𝑤, 𝑅𝐻𝑖𝑔ℎ] upon the excursion of the frequency beyond
set frequency threshold [𝐹𝐿𝑜𝑤𝑇ℎ , 𝐹𝐻𝑖𝑔ℎ𝑇ℎ ] in the timeframe of
PFC. The new value of droop is dependent upon the measurand TPO calculated as
∅ = 360 ∫(∫(𝑅𝑜𝐶𝑜𝐹). 𝑑𝑡). 𝑑𝑡 (2)
where 𝑅𝑜𝐶𝑜𝐹 is the rate of change of frequency. Defining the under and over frequency TPO thresholds as
([∅𝑢𝑓𝐻, ∅𝑢𝑓𝐿], [∅𝑜𝑓𝐻, ∅𝑜𝑓𝐿]), the droop value is modified
based on the curve shown in Figure 2. The PFC therefore enables higher active power response from the area within which the disturbance has originated while at the same time decreases the active power contribution from other areas.
Robustness of Targeted Local Primary Frequency
Control
As can be observed from the previous sub-section, the targeted local PFC of [6] is dependent upon calculation of TPO that is the double integral of the RoCoF. The feasibility of the approach has been proven subject to “true” frequency disturbances. Here the term “true” frequency disturbances refers to the deviation in frequency due to an imbalance of generation and load within the system. However, there is a perceived change in frequency of the system upon occurrences of events such as faults in the network. Such events are referred to as the “false” frequency disturbances.
Typically, the performance of any control scheme dependent upon TPO can be made robust against false
Droop %
Transient Phase Offset
High R
Low R
ufH
Th Low
F Th
High F
ufL
ofL
ofHLow R High
R
Figure 2: Example conventional droop curve.
frequency events by means of introduction of following two simple logics: (i) fault detection, i.e., if the voltage is below a certain threshold it can be assumed that the system is experiencing a fault or (ii) activation of the control only after fault clearing times, such as for example if the frequency has returned within a nominal band within 200-300ms then no control action is taken. However, the aforementioned logical implementations present certain limitations. Fault detection based on voltage threshold will work for majority of the faults experienced within the present grid but might fail in cases of high impedance faults where the voltage magnitude may not fall beyond the chosen threshold. Furthermore, introduction of a dead-time to allow for a fault to clear delays the primary frequency response support and may not be desired.
Data Driven Approach to Enhance Robustness of
Targeted Local Primary Frequency Control
Complementing the TPO measurand with a data driven approach, the robustness of the targeted local PFC can be enhanced. A number of data mining algorithms present in literature have the capability for classification and are used for wide range of applications. Therefore, in context of targeted local PFC, the objective of the classification is twofold: (i) to positively identify if a perceived disturbance is a true frequency disturbance and (ii) to positively identify if the perceived disturbance is within the LFC area. Only upon a positive classification from the chosen classifier, and upon measurement of TPO beyond lower thresholds (∅𝑢𝑓𝐿, ∅𝑜𝑓𝐿), the droops of the LFC area aremodified. The detailed methodology is presented in the following section.
DATA DRIVEN METHODOLOGY
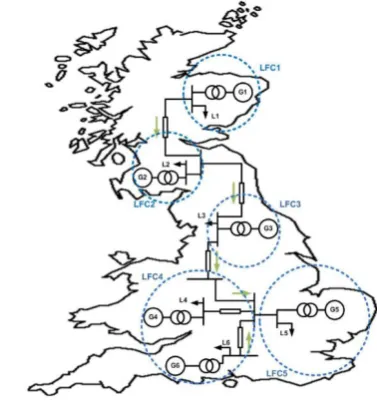
Figure 3: Test power system.
Data Collection
In this sub-section, first the test power system will be presented followed by the description of frequency disturbances considered and features chosen.
Test Power System
To analyse the data driven approach to PFC, in this paper a reduced six-machine dynamic model of the GB power system has been chosen as the test system. The GB power system is one synchronous area with no LFC areas, however, for purpose of analysing targeted local frequency response the buses of the model have been clustered to serve as LFC areas as shown in Figure 1. The identified regions have been developed around major generation sources, power flow corridors and load centers [9]. The test power system has been developed in RSCAD for real-time simulations at 50μs within a digital real-time simulator from RTDS Technologies [10].
The detailed modelling along with its parameters can be found in [4]. The validity of the model has been verified by means of load flow and dynamic response tests, details of which can be found in [11].
Features
A total of twenty features (or observables) have been chosen for recording. The twenty observables are: frequency of the network, RoCoF, three phase instantaneous voltage magnitudes, three phase instantaneous currents magnitudes, three phase instantaneous voltage phases, three phase instantaneous current phases three individual phase rms voltage and three individual phase rms current. Each of the twenty features are measured locally within each of the LFC area. A data recording rate of 200Hz is chosen to provide evidence of the feasibility of the proposed approach to operate based on PMU measurements expected to be available in abundance in the future power network.
Frequency Disturbances
Two types of frequency disturbances are considered, one
true frequency disturbance emulated by means of additional load on the system and one false frequency disturbance emulated by means of a three phase fault at each bus. Data is recorded for 2s for every disturbance, with pre-trigger set at 10%.
True Frequency Disturbances: Every area of the GB power system is subject to ten true frequency disturbances in independent consecutive runs. The magnitude of the disturbance is varied from 100MW to 1000MW in steps of 100MW. Therefore, in total 50 true disturbances are considered which leads to five datasets, one for every area, of 20,000 data points each (2 (seconds) x 200 (Hz) x 50 (disturbances)).
False Frequency Disturbances: The first transmission connected bus of every area of the GB power system is subject to five false frequency disturbances, i.e., a three phase fault. The impedance of the fault is varied from 0.01Ω to 100Ω in steps of tens multiple. Therefore, in total 25 false frequency disturbances are considered which leads to five datasets, one for every area, of 10,000 data points (2(seconds) x 200 (Hz) x 25 (disturbances)).
The true and false frequency disturbance datasets for each of the areas are combined to give 5 datasets of 30,000 data points each. To aid classification, an additional column of states, i.e. true state and false state, is added to the dataset. It is clear that the 10,000 data points from false frequency disturbances within each of the dataset are false states. However, only 3600 data points of each LFC dataset are true states. This is because the remainder of the 20,000 data points are steady state instances (related to 10% pre-trigger) or instances of true frequency disturbances within other LFC areas.
Feature Selection, Classifier Training and Testing
For the purpose of feature selection, classifier training and testing, an open source machine learning software – Weka [12] – is utilized. In this paper, four classifiers have been chosen for performance evaluation: (i) naïve Bayes, (ii) k-nearest neighbour, (iii) multi-layer perceptron and (iv) decision tree. As the focus is on decentralized control, one classifier model per LFC area will be developed. For feature extraction, the accuracy of the developed classifier model is compared by means of removing features one after the other from the feature set per iteration. This process is stopped when the accuracy of the developed model changes significantly from the previous iteration resulting in the minimal viable feature set for the purpose of classification. For the study under consideration, only eight features are retained: frequency, RoCoF, three phase instantaneous voltage magnitudes and three phase instantaneous current magnitudes.Table 1: Naïve Bayes Table 2: k-Nearest Neighbour
Summary Summary
Total number of instances 30000 Total number of instances 30000
Correctly classified 9017 30.05% Correctly classified 29408 98.03%
Incorrectly classified 20983 69.95% Incorrectly classified 592 1.97%
Confusion Matrix Confusion Matrix
False True classified as False True classified as
5441 20959 False 25935 465 False
24 3576 True 127 3473 True
Statistics Statistics
Time to build model 0.11s Time to build model 0.07s
Mean absolute error 0.6982 Mean absolute error 0.0198
Root mean squared error 0.8301 Root mean squared error 0.1405
Table 3: Multi-Layer Perceptron Table 4: Decision Tree
Summary Summary
Total number of instances 30000 Total number of instances 30000
Correctly classified 29408 98.03% Correctly classified 29906 99.69%
Incorrectly classified 592 1.97% Incorrectly classified 94 0.31%
Confusion Matrix Confusion Matrix
False True classified as False True classified as
25935 465 False 26357 43 False
127 3473 True 51 3549 True
Statistics Statistics
Time to build model 17.62s Time to build model 0.48s
Mean absolute error 0.0198 Mean absolute error 0.0044
Root mean squared error 0.1405 Root mean squared error 0.0553
relatively faster build time compared to the multi-layer perceptron and highest accuracy.
Real-Time Validation
For the purpose of real-time validation, the best performing classifier is chosen, i.e., the decision tree. The approach to import the classifier model from Weka to RTDS for its real-time validation is presented in Figure 4. Weka provides the option of generating a Java source code of the trained classifier model that is then ported to Matlab that allows for code generation for its import within the RTDS. As previously stated (and shown in Figure 4), the process is repeated for individually trained model for each LFC area.
Weka Classifier
Model
Java Source
Code
Porting Java to Matlab Matlab
Code Generation
[image:4.595.323.526.504.753.2]Classifer Model for Import RTDS
Figure 4: Real-time validation approach.
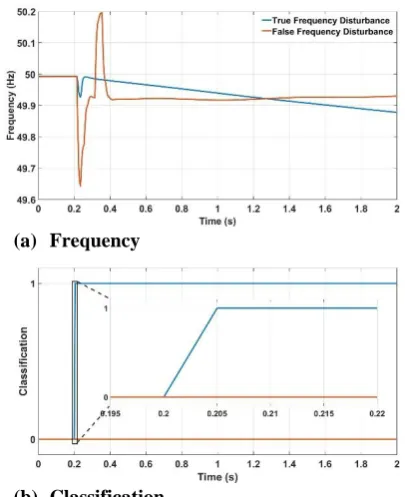
For the purpose of real-time validation, two cases are considered. The first case is a 750MW step increase in load in LFC area 1 at t=0.2s simulated as the true frequency disturbance. The second case is a 0.2Ω three phase
(a) Frequency
(b) Classification
[image:4.595.51.284.550.757.2]fault in LFC area 1 at t=0.2s for a duration of 100ms simulated as the false frequency disturbance. The frequency and the classification results for the two cases are shown in Figure 5 a and b. Classification as 1 refers to a true frequency disturbance while 0 to a false frequency disturbance. As can be observed, the classifier model of LFC area 1 is able to distinguish between true and false frequency disturbances within the first 50ms of its occurrence. It is important to note that the load step magnitude and fault impedance values chosen for real-time validation are not part of the training dataset. This further provides confidence in the versatility and robustness of the proposed approach, i.e., the classifier can identify disturbances that had not been a part of the training dataset.
This validation provides evidence of the capability of data driven approaches to run in real-time for practical world applications. The compiled rule-based decision tree classifier model is computationally efficient and is able to execute in real-time at a time-step of 50 µs.
CONCLUSIONS AND FUTURE WORK
In this paper, a data-driven approach to enhance the robustness of decentralized targeted local primary frequency control is presented. By means of using the Great Britain power system model as a case study, the methodology and process of implementation of the approach is described and demonstrated. The minimal set of observables or features that are required for the purpose of local disturbance location identification are determined. Four classifier models have been evaluated for the purpose of true frequency location identification. From the analysis presented, it can be said that naïve Bayes classifier is not suitable for the objective at hand while the decision tree based classifier performs the best in terms of build time and accuracy. To further prove the feasibility of the proposed approach, the performance of a decision tree based classifier has been validated in real-time.
Proving the feasibility of the approach in real-time provides a proof of concept and a number of future directions for the presented work can be identified. Firstly, the proposed method should be elevated to higher technology readiness level by means of controller and power hardware-in-the-loop experiments. In addition, the proposed method can be extended for its application to secondary frequency control by means of which the response speeds can be improved. These will be reported by the authors in subsequent publication.
Acknowledgments
The work in this paper has been supported by the European Commission, under the FP7 project ELECTRA (grant no: 609687) and Horizon 2020 project ERIGrid (grant no: 654113). The work has also been in part supported by the Nokia Energy Innovation Center, Plano, Texas, USA. Any opinions, findings, and conclusions or recommendations expressed in this material are those of the authors and
do not necessarily reflect those of the European Commission.
REFERENCES
[1] Terzija, V.V., “Adaptive underfrequency load shedding based on the magnitude of the disturbance estimation,” IEEE Transactions on Power Systems, vol. 21, no. 3, pp. 1260–1266, Aug 2006.
[2] Wilson, D., “Advances in wide area monitoring and control to address emerging requirements related to inertia, stability and power transfer in the GB power system,” in 2016 CIGRE, 2016.
[3] Wall P., Shams, N., Terzija, V., Hamidi, V., Grant, C., Wilson, D., Norris, S., Maleka, K., Booth, C., Hong, Q., and Roscoe, A., “Smart frequency control for the future gb power system,” in 2016 IEEE PES Innovative Smart Grid Technologies Conference Europe (ISGT-Europe), Oct 2016, pp. 1–6.
[4] M. H. Syed, “Enhanced frequency control for greater decentralisation and distributed operation of power systems: Design to Laboratory Validation”, PhD Thesis, University of Strathlcyde, 2018.
[5] Wilson, D., Heimisson, B., Gudmansson, R., Baldursdotter, I., Armannson, O., Halldorsson, K., Linnet, E., and Bagleybter, O., “Icelandic operational experience of synchrophasor-based fast frequency response and islanding defence,” in CIGRE, Aug 2018, pp. 1–12.
[6] Syed, M.H., Guillo-Sansano, E., Blair, S.M., Roscoe, A.J. and Burt, G.M. 2018, “A novel decentralized responsibilizing primary frequency control”, IEEE Transactions on Power Systems, vol. 33, pp. 3199-3201. [7] Dai, Y., Xu, Y., Dong, Z., Wong K. and Zhuang, L.,
“Real-time prediction of event-driven load shedding for frequency stability enhancement of power systems”, in IET Generation, Transmission & Distribution, vol. 6, no. 9, pp. 914-921, September 2012.
[8] Yin, L., Yu, T., Zhou, L., Huang, L., Zhang X., and Zheng, B., “Artificial emotional reinforcement learning for automatic generation control of large-scale interconnected power grids”, in IET Generation, Transmission & Distribution, vol. 11, no. 9, pp. 2305-2313, 22 6 2017.
[9] Electricity Ten Year Statement, National Grid, 2016. [Online]. Available: http://www2.nationalgrid.com/UK/ Industry- information/Future-of-Energ/Electricity-ten-year-statement
[10] Real Time Power System Simulation, RTDS Technologies, 2018. [Online]. Available:
https://www.rtds.com/real-time-power-system-simulation/
[11] Emhemed, A., Adam, G., Hong, Q., and Burt, G., “Studies of dynamic interactions in hybrid ac-dc grid under different fault conditions using real time digital simulation,” in 13th IET International Conference on AC and DC Power Transmission, Feb 2017, pp. 1–5. [12] Eibe Frank, Mark A. Hall, and Ian H. Witten (2016). The