City, University of London Institutional Repository
Citation
:
Asif, W., Rajarajan, M. and Lestas, M. (2018). Increasing user controllability on
device specific privacy in the Internet of Things. Computer Communications, 116, pp.
200-211. doi: 10.1016/j.comcom.2017.11.009
This is the accepted version of the paper.
This version of the publication may differ from the final published
version.
Permanent repository link:
http://openaccess.city.ac.uk/19508/
Link to published version
:
http://dx.doi.org/10.1016/j.comcom.2017.11.009
Copyright and reuse:
City Research Online aims to make research
outputs of City, University of London available to a wider audience.
Copyright and Moral Rights remain with the author(s) and/or copyright
holders. URLs from City Research Online may be freely distributed and
linked to.
City Research Online:
http://openaccess.city.ac.uk/
[email protected]
Increasing User Controllability on Device Specific Privacy in the Internet of Things
Waqar Asifa,∗, Muttukrishnan Rajarajana, Marios Lestasb
aSchool of Engineering and Mathematical Sciences, City, University of London, UK. bDepartment of Electrical Engineering, Frederick University, Nicosia, Cyprus.
Abstract
With recent advancements in information technology more and more devices are integrated in the Internet of Things. These devices gather significant amount of private information pertinent to a user and while, in some cases it helps in improving the life style of an individual, in others it raises major privacy concerns. This trade-off between utility and privacy is highly dependent upon the devices in consideration and as the utility of the generated data increases, the privacy of an individual decreases. In this paper, we formulate a utility-privacy trade-off that enables a user to make appliance specific decisions as to how much data can be shared. This is achieved by parametrizing the degree of privacy allowed for each device and enabling the user to configure the parameter of each device. We use the smart metering application as the test case scenario for the proposed approach. We evaluate its performance using simulations conducted on the ECO data set. Our results indicate that, the proposed approach is successful in identifying appliances with an accuracy of 81.8% and a precision of 70.1%. In addition, it is demonstrated that device specific changes of the configuration parameters allow the degree of privacy achieved for the particular device and the utility to be well controlled, thus demonstrating the effectiveness of the proposed approach. Moreover, it is shown that, as expected, devices with higher power consumption contribute more to the overall privacy and utility achieved. A comparative study is also conducted and the proposed approach is shown to outperform the existing ElecPrivacy approach by producing a trace that is harder to identify, as reported after testing the Weiss’ and Baranski’s algorithm, both of which are well known Non-Intrusive Load Monitoring algorithms. Finally, it is demonstrated that the addition of noise, which is an integral part of the propose approach, can greatly improve performance.
Keywords: Smart Meter, Privacy, Utility-Privacy trade-off, Mutual Information, Non-Intrusive Load Monitoring.
1. Introduction
Internet of Things (IoT) has been one of the key inno-vations of the last decade. It eliminates the requirement of having a homogeneous network for ensuring information exchange, thus, enabling multiple devices to communicate with each other. By 2020, it is expected that 24 billion devices will be connected using this innovative technology thus, generating an expected benefit of 1.2 trillion USD for the communication industry [1]. IoT objectives go beyond serving the communications industry, aiming to improve the quality of life. IoT devices are built on a common architecture of repetitive sensing and forwarding of infor-mation thus forming time-series data. This time series data keeps the client aware and updated about the chang-ing parameters thus enablchang-ing him to react accordchang-ingly. A smart health monitoring device enables a doctor to con-stantly update the record of a patient’s health and later use this to make a detailed analysis [2] Likewise, a smart baby monitor empowers parents with the capability to take
∗Corresponding author
Email addresses: [email protected](Waqar Asif ), [email protected](Muttukrishnan Rajarajan), [email protected](Marios Lestas)
pre-emptive measures against the reduced growth of their child with the aid of a constantly updated record of their child’s activity pattern[3][4]. Similarly, smart meters en-able consumers to have knowledge on their consumption pattern thus allowing them to adopt a more cost effective lifestyle [5][6]. The benefits of having these IoT devices is only worthwhile if the generated time-series data is kept secure from the access of an adversary.
An adversary can use this data to learn vital informa-tion about a person with informainforma-tion spanning from as small as his average heart rate for a certain period of time to as huge as a detailed analysis of a person’s heart rate, location and estimated activity pattern, all using the same health monitor. Such highly private data collection may happen with or without the consent of the user and poten-tially without informing the users how this data can affect their privacy [7]. The entity collecting the data may also make this data available to third parties such as insurance companies for accessing one’s daily lifestyle to identify if they are maintaining a healthy schedule and then adjust-ing the premium accordadjust-ingly [8], marketadjust-ing agencies for initiating targeted advertisements, law enforcement agen-cies for detecting illegal activities and burglars for finding out the habits of the occupants of a house [9]. Each IoT
device poses a different set of privacy risks and this has led to different privacy preserving solutions. One common ap-proach that exists in literature is that of completely hiding the generated time-series data, either by using data ag-gregating methods or randomization techniques [10][11]. These approaches perform well in ensuring privacy but they curtail the benefits of installing these IoT devices by excessively protecting an individual’s data thus, de-priving a user from all the possible set of benefits. The problem then is to ensure that the privacy issue does not limit the access to valuable information thus dampening the data economy and at the same time, the privacy door is not widely open for anyone to extract vital information. The need then is to devise a mechanism that empowers the user with complete control over their information thus leaving it at their disposal to decide on the kind of ben-efits they want in exchange for their private information. Each IoT device harvests a different level of information and while some devices are very clear in what informa-tion they gather, others, such as the smart meters, work in disguise.
Smart meters are advertised as devices that sense and forward the consumption pattern of a household but the time-series data that they generate reveals a lot more in-formation. An adversary can extract vital information such as the living pattern of an individual along with thor-ough information regarding the appliances installed in the household, such as the time of use and the brand of the washing machines, dryer, kettle, stove, freezer and televi-sion [9][12]. It is key to highlight here that, smart me-ters merely store the power consumption for as small as a single second and then forward it to the utility provider on a predefined data forwarding rate. The accuracy and timeliness of this data is the key to all the benefits re-lated to the smart meters and despite the concerns of a user, the utility provider would not be willing to let any-one alter the average power consumption reported between two data forwarding instances. This bounds the user from adding or subtracting any information thus, limiting the choices to merely distorting the available data. Data dis-tortion can be done using various approaches. One ap-proach is to add an external hardware, where the privacy concerned users install an extra battery that is charged and discharged at irregular intervals, thus generating a distorted consumption pattern [13]. Another approach in-volves amending the smart meter network structure and ensuring neighbourhood-level aggregation of data before relaying it back to the utility provider (Electric company) [12]. These approaches have been reported to perform well in their considered scenarios but the distortion of data at irregular intervals ensures privacy at the cost of the poten-tial benefits of smart meters.
In this paper, we propose a novel data distortion ap-proach that returns the data sharing authority back to the hands of the user. We formulate a utility-privacy trade-off mechanism that enables the user to decide “what percent-age”, of “what data”, related to “which device” should
be shared with the utility provider. The proposed ap-proach uses the unique signature pattern of each appliance to identify its existence in a harvesting interval and then, based on the choice of the user, hides the signature. We use the term harvesting interval as the time between two data forwarding instances. The proposed approach is tested on the ECO (Electricity Consumptions and Occupancy) data set [14] that provides a unique combination of qual-ity and quantqual-ity of electricqual-ity consumption. In particular, it contains aggregate electricity consumption data, includ-ing real and reactive power for each of the three phases and plug level measurements of selected household appliances. The data is being collected at 1Hzgranularity and over a period of 8 months. Despite the size of the data and the huge variation in power consumption pattern of different devices in a household, the proposed approach was success-ful in correctly identifying appliances with an accuracy of 81.8% and a precision of 70.1%. Simulation results also in-dicate that the proposed approach is successful in enabling the user to control the privacy of each individual appliance with the aid of a configurable parameter. Furthermore, it is established that the degree of change in the result-ing total privacy and utility is proportional to the power consumption of an appliance. The proposed approach is also compared to the existing ElecPrivacy approach [13] where the resultant smart meter readings are tested using two well-known Non-Intrusive Load Monitoring (NILM) algorithms namely: Weiss’ [15] algorithm and Baranski’s algorithm [16]. The proposed approach has been shown to outperform the existing approach by generating traces that are harder to identify thus demonstrating its effec-tiveness.
The rest of the paper is organized as follows: in Section II we highlight the related work in this field, in Section III, we formulate the considered problem and in Section IV we present the proposed approach. In section V we evaluate its performance using simulations and finally in Section VI we offer our conclusions and future research directions.
2. Related Work
The constantly increasing awareness regarding the re-lationship between smart meter data and privacy has led to some interesting research in this field of study. The research involves proposed approaches stretching between smart meter data aggregation for introduction of anonymity to fixing the problem at the origination point and altering smart meter data before it is read by the smart meter.
utility provider. The baseline assumption is that the util-ity provider only needs energy consumption reading for a substation. These approaches introduce privacy to an in-dividual’s data and offer some utility to the utility provider in understanding the average energy consumption pattern of a certain location but it mitigates the benefits that an individual can obtain from his own smart meter reading, as he cannot identify the appliances which contribute most to the total energy consumption thus undermining his ability to achieve energy efficiency.
To address this problem, authors in [20] focus on dis-torting the data at the origination point. This would min-imize the chances of a malicious node’s participation in the smart meter network for both a passive or an active attack and would also enable an individual to keep a con-stant check of his energy consumption pattern. They pro-pose the use of a stationary Gaussian Markov model for the energy load measurements. They report that privacy-utility trade-off can be optimized through water-filling and for this the privacy mechanism distorts the time-series data off-line after obtaining the whole sequence, thus using memory that increases exponentially with the reduction of the energy harvesting interval. On the other hand, the authors in [21][22] introduce the notion of partial informa-tion hiding by introducing uncertainty about individual values in a time-series by perturbing them. A similar no-tion is presented in [13][23] where it is pointed out that simple data perturbation would be easy to identify by the utility provider as he can identify the actual consumption pattern by installing a similar smart meter at the power origination point. It is thus better to off-load some of the power consumption to batteries at random time intervals. The proposed approach performs well in hiding the con-sumption pattern at the source but it affects the average consumption per harvesting interval, thus mitigating some benefits of having a smart meter.
Authors in [24][25] highlight the risks of sharing pri-vate data and propose appropriate trade-off mechanisms where the user is informed about the usage of his data and an incentive equal to the privacy cost is offered in re-turn. In [26] a new Multi-party Access Control (MPAC) model was proposed that uses Nash Equilibrium to obtain a unique solution for sharing data with multiple parties and identify an appropriate incentive. The difficulty with these approaches is that, they are highly influenced by the truthfulness and greediness of the user which can entice them into affecting the originality of the data. This was dealt with in [27] where, the authors addressed the issue of participation of consumers in data analytical projects using a game theoretic model. The main idea is to encour-age contribution into these studies at an individual self chosen level of precision, with the condition that the pro-vided data is authentic. The analyst sets a requirement for data precision, which has to be met by the provided data.
In this paper, we formulate a utility-privacy trade-off problem around which we propose a solution that
en-ables users to decide what amount of information regard-ing which appliance is shared. This enables the user to bargain with the utility provider about the information he is willing to share and the benefits he can get in return while maintaining the same average consumption per har-vesting interval. The next section explains in detail the problem formation and later we explain the proposed ap-proach.
3. Problem Formulation
Time series data extracted using a smart meter is crit-ical for ensuring efficient load management and is perilous if in the hand of an adversary. An adversary can use this data to extract key private information about a user. In this section, we formulate the utility-privacy trade-off us-ing a mathematical framework, where the utility of the data refers to the amount of meaningful information that can be extracted from it.
We assume that the harvesting interval of a smart me-ter is set by the utility provider and remains constant. During each harvesting interval, t time-series values are stored by the smart meter. These time-series values are collectively represented as a set XT, where T represents the data forwarding instance. The time-series values in XT can be partitioned into two subsets, the public setS which the user is willing to share and the private data set Qrwhich the user wants to hide, whereXT = (S∪Qr) and (S∩Qr) =φ. The private data setQrcomprises ofr sub-sets (Q1∪Q2∪...∪Qn) =Qr, where each subset refers to
a unique appliance in a household. Each unique appliance works for a different length of time, therefore, each data set XT contains unique length subsets |Q1|,|Q2|, ...|Qr|
where, |.|represents the cardinality of a set. With such a data set, the requirement for maintaining the actual av-erage consumption per harvesting interval is fulfilled by merely spreading the private data setQracross the public set S thus producing a new time-series data XˆT, where ( ˆXT ∩Qr) = φ. This data can then be released to the provider for ensuring privacy.
We build on the information leakage approach pro-posed in [28] to identify the mutual information between the private and the randomized data,I(Qr; ˆXT) =H(Qr)− H(Qr|XˆT), whereH(.) andH(.|.) denote the entropy and the conditional entropy respectively. Here, entropy is re-ferred to as the expected amount of information contained. An optimal utility-privacy trade-off approach should min-imize the expected distortion between the original and the randomized data while ensuring a privacy constraintrset by the user for each individual secure data set Qr, thus forming the following optimization problem:
O= min
p( ˆXT|XT,Qr)E
[d(XT,XˆT)] (1)
subject toI(Qr; ˆXT)≤(1−r)×I(Qr;XT),∀r
Mutual information has been widely used as a privacy metric due two main reasons: its well understood prop-erties and its strong correlation with the well-known -differential privacy [29][30][31]. Differential privacy guar-antees that two adjacent databases which differ in only one entry are statistically indistinguishable [32]. This guaran-tee is particularly effective in making individuals comfort-able in contributing personal information in to a database. Consider a database Dn = (D
1, ..., Dn) that returns a
query responseY according to a random mechanismPY|Dn
and let D−i denote the set of database entries excluding Di then:
Definition 1. ((,δ)-Differential Privacy (DP) [33]). A randomized mechanism PY|Dn satisfies (, δ)-differential
privacy if for all neighbouring database instances dn and ˜
dn
PY|Dn=dn (,δ)
≈ PY|Dn= ˜dn (2)
Where a randomized mechanismPY|Dn satisfies-
dif-ferential privacy if it satisfies (,0)-differential privacy. Here, a smaller value ofrepresents a higher level of privacy. An adversary if generates a query Y for a sufficiently small in -differential privacy, then the query response would be insufficient to distinguish between the two databases Dn and D−i. In order to build an information theoretic un-derstanding of the phenomenon of -differential privacy it is combined with mutual information thus yielding Mutual Information Differential Privacy [34][35].
Definition 2. (Mutual-Information Differential Privacy (MI-DP)[35]). A randomized mechanism PY|Dn satisfies
-mutual information differential privacy if:
sup
(i,PDn)
I(Di;Y|D−i)≤ bits (3)
The interpretation of -differential privacy into infor-mation theoretic science relaxes the strict privacy con-straints of -differential privacy thus sandwiching Mutual Information Differential Privacy between-differential pri-vacy and (,δ)-differential privacy [35]:
−DP ≥M I−DP ≥(, δ)−DP (4)
The claim herein is that MI-DP is a weaker constraint than -DP but a stronger constraint than (,δ)-DP. That is if a mechanism holds -MI-DP than it holds (,δ)-DP [35]. Where, a lower value ofrepresents a higher level of privacy [34]. The rationale build using the aforementioned privacy definitions states that the lower the mutual infor-mation between the private datasetQrand the time-series dataset ˆXT in the optimization problemO, the lower the mutual information between the removed private dataset entriesDiand the query responseY|D−i in Eq 3. There-fore, a higher r would yield a lower for -MI-DP thus yielding a higher privacy level.
4. Proposed Approach
In this section, we describe the rationale behind the proposed approach with relevance to the optimization prob-lemO. The proposed approach is built on the basis that, smart meters read consumption data for each household after every small time interval and this can be as small as a single second. The smaller the time interval the finer the granularity of the extracted data and thus the bigger the privacy risk. These meters store these readings for a certain time and then relay it to the central unit or neigh-bouring nodes for data aggregation and forwarding. This is merely a design choice and we assume for simplicity that, the user is sending data directly to the utility provider. It is worth mentioning that, this assumption only exists for ease of understanding and the proposed approach would work equally well when data is relayed to neighbouring nodes for data aggregation.
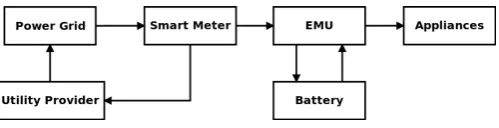
The proposed approach comprises of two steps: the data acquisition and pre-processing step and the data dis-tortion step. The data acquisition step builds a signature database for all the appliances using the peak and rms volt-ages and currents along with the real and reactive power. The data distortion step uses the output of the first step to identify the appliances and then alter the smart me-ter signature. The granularity of the extracted data and the continuous store and forward mechanism of a smart meter requires the smart meter reading to be changed on a real time basis. This motivates the need of an Energy Management Unit (EMU) that keeps a constant check on the energy requirement of the household and controls an energy storage unit, a battery in our case, that can either store or provide energy on the desired time instance as shown in Fig 1. The EMU maps the energy requirement of each time instance onto the available appliance signa-tures in search of a positive identification. In the event of a positive identification at a particular instance, the cor-responding value is then hidden based on the user defined rvalue. In case an appliance identified at timetneeds to be hidden then, the EMU calculates the average consump-tionγ of the household up till time t and uses this value to decide if the battery needs to be charged or discharged. The objective is to ensure that the smart meter is only providing the average consumption γ. The rest is offered by the battery. This differentiates the average consump-tion reported by a smart meter from the actual household consumption per harvesting interval. The difference be-tween the two averages is realized by altering the average consumption γ of future instances using a noise addition approach explained in detail in the next section.
4.1. Step 1: Data Acquisition and Pre-processing
Figure 1: Block Diagram.
purely resistive whereas, a fan can be predominantly in-ductive. A resistive appliance is simple, as it uses the available current and voltage to produce power. The ca-pacitive and inductive circuitries on the other hand act differently. An inductive circuit advances the current with respect to the voltage and the opposite happens in case of a capacitive circuit. As a consequence the power trans-ferred to an appliance is less than the simple product of voltage and current that is applied across them. To bet-ter understand this concept, the bet-terms active and reactive power are used. In general, appliances work through the active power, while the reactive power is due to the pres-ence of an inductive or capacitive component of an appli-ance. The combination of the active and reactive power forms another key parameter known as the power factor. The combination of the active power, reactive power and the power factor define the signature parameters of an ap-pliance and these are explained in detail later in this sec-tion. For steady state linear time-invariant loads, complex power can be calculated from voltage, current and phase angles as follows [36]:
S =1 2VmIme
j(θV−θi)=P+jQ (5)
P f =P/|S| (6)
where variablesVmandImare maximum values of volt-age and current respectively and variables θV andθI are phase angles of voltage and current respectively. Here,P represents the real power, Q the reactive power and P f represents the power factor of the system.
The computation of power is different for non-linear loads and is represented using Fourier series expansion. The number of terms in the expansion represents the di-mensions of the features and each coefficient corresponds to the current and voltage in each of the harmonics. Real and reactive power can thus be computed by [36]:
In=Zn−1Vn=YnVn (7)
where the real power is defined as:
P = N
X
n=0
Pn =V0I0+
N
X
n=1
VnIncos(θVn−θIn) (8)
and the reactive power is defined as:
Q=X
n=1
N VnInsin(θVn−θIn) (9)
where nis the frequency number, Yn and Zn are the admittance and impedance matrices respectively. V0 and
I0are the DC voltage and current respectively andVnand In are their effectiventhharmonic.
The power, current and voltage values are then used to differentiate between different appliances and each of the unique consumption pattern is referred to as the signature of an appliance. An appliance signature can be obtained using various mechanism. One common approach requires the installation of smart plugs. Each appliance in a house-hold is powered using a separate smart plug which then connects the appliance with the EMU. An EMU can then keep a constant track of the power utilization pattern of a household. A secondary and more feasible approach is the use of an outlier/anomaly detection algorithm at the EMU. Anomaly detection algorithms such as Z-score anal-ysis [37], the modified Z-Score [38] or Kurtosis computa-tion [39] enable the EMU with the capability of identifying the installation of a new appliance in the household which was not registered with the EMU earlier. With the help of these algorithms, the EMU keeps a look-out for any anomaly in the power utilization pattern. An anomaly once identified is reported by the EMU and can be la-belled by the user as an appliance that was powered ON at that particular instance. In this work, we use the latter approach for storing appliance signatures. The underline assumption is that the EMU would detect the anomaly in the power consumption pattern and the user is aware of the appliance that was powered ON at that particular instance. Once all the appliances in a household are regis-tered, the user would not have to give any further inputs to the EMU. The appliance signatures obtained using the aforementioned approach has the following features:
• Real power: This is the first component that dif-ferentiates between appliances with dissimilar con-sumptions.
• Power factor: Appliances with similar consumption are differentiated based on the power factor, which can differ between appliances of resistive, capacitive and inductive types.
• Peak current: Appliance signatures also store the peak current which is the maximum amount of cur-rent the appliance requires before reacting. This re-lates directly to the appliance circuit and can help identify appliances of similar type but different man-ufacturers.
• Peak voltage: This identifies the maximum voltage required by the appliance to start. This along with the peak current forms the initial spike that is used to identify the start of a new appliance.
• RMS current: After the initial peak current, the current requirement of an appliance follow a time-varying sinusoidal function. The effective value of
this current function is referred to as the RMS cur-rent.
• RMS voltage: Similar to the RMS current, after the initial peak voltage, the voltage requirement of an appliance follows a time-varying sinusoidal function and the effective value of this voltage function is re-ferred to as the RMS voltage.
The signature data base generated using the aforemen-tioned features is later used in the next step to identify the appliances in the smart meter acquired time-series data and once the appliances are identified, their signatures are scattered using a novel battery charging and discharging pattern.
4.2. Step 2: Data Distortion
In this section we explain in detail how the proposed approach introduces distortion in the smart meter data on run-time basis.
We consider the smart meter harvested data as a fi-nite value data set XT where the cardinality |XT| de-pends on the harvesting interval β and the granularity with which the smart meter stores the consumption read-ing. The EMU maps each valueXT
i ∈XT with the appli-ance signature databaseQr. A positive match between the signature database Qr and XiT initiates the data distor-tion process. The EMU comparesr, the user defined pri-vacy level, withµthe constantly updated threshold. Here, {r|r ∈ R,0 ≤ r ≤ 1} with r = 1 representing
maxi-mum privacy and r = 0 representing minimum privacy. The constantly updating threshold,µ=Ehr/(Etr+Ecr) is the ratio between the total hidden signature Ehr, the total energy consumed by an appliance Etr and the en-ergy required by the appliance Ecr. The comparison be-tweenrandµcan yield two possible outcomes: 1)r< µ, 2)r ≥ µ. The first outcome means no distortion is re-quired and thus the signature should be left un-altered. The second outcome on the other hand, requires the sig-nature to be altered and this is achieved by repeatedly charging or discharging the battery in a manner that the smart meter reads a value close to the average consump-tion value of a household. The average consumpconsump-tion is represented by γand it is calculated using:
γ= i
X
n=0
XnT +Ni (10)
Here, N represents noise and it is explained in de-tail later in this section. The average consumption γ is later compared with the current energy requirement of the household to decide between the charging or discharging cycles of the battery. In an ideal scenario, if XT
i > γ the EMU would discharge the battery, requesting an amount of XT
i −γ Joules from the battery and fulfilling the total energy requirement by requesting γ joules from the util-ity provider through the smart meter. On the flip side, if
XT
i < γ the EMU would charge the battery, requesting an amount ofγfrom the utility provider and charging the battery using the surplus amount ofγ−XT
i Joules. The constant charging and discharging of the battery will re-sult in the constant difference between the average energy consumption reported by the smart meter and the actual average consumption per harvesting interval. This differ-ence from the average consumption per harvesting interval is stored inRm and is later used to form noise N for Eq 10.
4.2.1. Battery Discharge (XT i > γ)
Every battery is upper and lower bounded by its maxi-mum and minimaxi-mum storage capacity respectively and this limits it from providing XiT −γ joules for all the desired incidences. To overcome this limitation, the EMU makes a decisiondd=max((XiT−γr),(Bc−Bmin)) that will re-sult in two possible cases. HereBcis the current energy of the battery,B0
cis the remaining energy in the battery and Bmin is the minimum energy required to keep a battery alive.
• Case 1: (XT
i −γ)>(Bc−Bmin)
When the difference in the energy requirement of a household and the running average is greater than the capacity of the battery then, the battery is com-pletely drained and the remaining energy require-ment is fulfilled by the electricity provider which dic-tates the smart meter reading. The energy required from the battery and the smart meter are calculated using the following equations:
ˆ
XiT =XiT −(Bc−Bmin) (11)
Rm=Rm+ (Bc−Bmin) (12)
B0c=Bc−Bmin (13)
• Case 2: (XiT−γ)<(Bc−Bmin)
When the difference in energy requirement of a house-hold and the running average is less than the capac-ity of the battery then, only the average consumption γis fulfilled by the electricity provider which dictates the smart meter reading and the rest is fulfilled from the battery. The energy requirements are calculated using the following equations:
ˆ
XiT =XiT−(XiT−γ) (14)
Rm=Rm+ (XiT −γ) (15)
Bc0 =Bc−(XiT −γ) (16)
4.2.2. Battery Charging (XT i < γ)
battery, the EMU will make the decision dc =max((γ− XT
i ),(Bmax−Bc)). This decision would result in the fol-lowing two cases:
• Case 1: (γ−XT
i )>(Bmax−Bc)
When the difference between the average energy and the energy required by the household is greater than the capacity of the battery, then the decision of the amount of energy to be forwarded to the battery and the energy fulfilled through a smart meter are made as follows:
ˆ
XiT =XiT + (Bmax−Bc) (17)
Rm=Rm−(Bmax−Bc) (18)
B0c=Bc+ (Bmax−Bc) (19)
• Case 2: (γ−XT
i )<(Bmax−Bc)
When the difference between the average energy and the requested energy is less than the maximum avail-able capacity of the battery, then the EMU will ex-tract the average energy from the smart meter and forward the excess energy to the battery as follows:
ˆ
XiT =XiT + (γ−XiT) (20)
Rm=Rm−(γ−XiT) (21)
Bc0 =Bc+ (γ−XiT) (22)
Notice that the battery charge and discharge mecha-nisms mentioned in this section update the battery status along with the required energy at every time instance i where, ican be as small as a single second but this does not mean that the battery is expected to switch between charging and discharging state at every time instance. Any appliance running in a household requires an initial power spike to start its operation, thus generating the peak volt-age and peak current pattern, which is then followed by a constant RMS current and voltage requirement that keeps the appliance running. This complete power consumption pattern consumes multiple time instances, usually the or-der to hundreds thus eliminating the need for the battery to change states at every time instance. The charging and discharging pattern of a battery is highly dependent upon the type of battery being used. these different patterns compliment the noise addition objective of the proposed approach therefore, in this paper we do not specify a par-ticular battery type.
4.2.3. Noise Addition (N)
The calculation of noise N is inspired by the Haar Wavelet transform (HWT) [40] and is used to accommo-date the deviation between the actual average consump-tion of the household during a harvesting interval and the average consumption being reported by the smart meter after distortion. The difference between the averages is
spread across the future time indices of a harvesting in-terval to influence the calculation of γ. The addition of noise ensures that the smart meter reports actual average consumption of a household.
The Noise N is calculated by using multiple random pairs [Lm,−Lm] that form the leaf nodes of a tree, where 0 < Lm < Bmax and the sum of all the leaf nodes is zero. These leaf nodes are used to generate the wavelet coefficients c for each of the internal nodes, such that c = (a1 −a2)/2, where a1 and a2 are the average
val-ues for the leaves in the left and right subtree. The depth of the tree is a design choice with a smaller depth yield-ing more benefits. After processyield-ing all the internal nodes, an additional coefficient, referred to as the base coefficient c0 is generated by taking the mean of all leaves nodes.
[image:8.595.317.549.297.441.2]The base coefficient will always result in a zero due to the selection of the random pairs [Lm,−Lm].
Figure 2: Haar Wavelet Transform.
Example: Fig 2 illustrates a HWT with 8 entriesv1, ...v8.
Each number in a circle shows the value of a wavelet coef-ficient. The base coefficientc0 equals the mean of the
en-tries. The coefficientc1is the mean difference between the
averages of the left and right subtreec1= (45−(−45)/2.
Once the leaf values are spread, the base coefficient is updated withRm as: co =co+Rm
2l , wherel is the depth
of the tree. In order to reduce the chances of an adver-sary identifying the amount of addition into a leaf node, Laplacian noise is added into each branch coefficient. This Laplacian noise is drawn from the Laplacian distribution with the probability density functionp(x|λ) = 1
2λe −|x|/λ,
whereλis a design choice.
The addition of Laplacian noise will affect the average consumption of a household reported by the smart meter. This is taken care by the use of a mean subtraction pro-cedure. The mean subtraction procedure divides all but the base coefficient into disjoint sibling groups such that each maximal set of coefficients have the same parent in the tree. For example, in Fig 2, the tree can be divided into three sibling groups: {c2, c3}, {c4, c5}, and {c6, c7}.
Next for each sibling group, the noise mean is computed and subtracted from each coefficient in the group, thus ensuring no change in average harvesting interval energy.
The intuition is that, after the mean subtraction, the noise coefficient in the same siblings group will sum up to zero. Finally,Ni for all future instances is calculated as follow-ing:
Ni=c0+
l
X
j=1
(gj.c) (23)
wheregj equals 1 (−1) ifvis in the left(right) subtree ofc.
5. Performance Evaluation
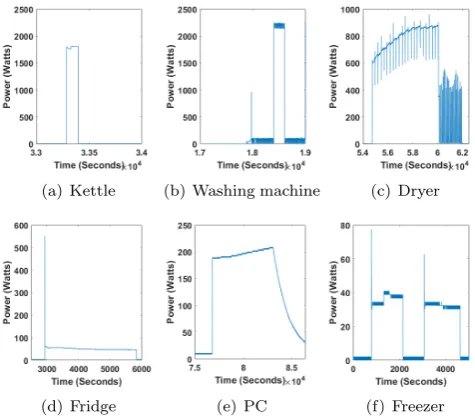
In this section, we evaluate the performance of the pro-posed user controllable device specific privacy preserving approach by testing it on the ECO data set and conduct-ing simulations on Matlab. The ECO data set presents real sensor data for 6 households in Switzerland over a pe-riod of 8 months (June 2012 to January 2013). It contains measurements of real and reactive power for each of the three phases in a household and also provides the plug-level data at 1 Hz frequency. We test the proposed ap-proach on household 1 from the ECO data set which has 6 different appliances namely: PC, dryer, washing machine, kettle, fridge and freezer.
(a) Kettle (b) Washing machine (c) Dryer
[image:9.595.308.558.137.198.2](d) Fridge (e) PC (f) Freezer
Figure 3: Example of appliance signature
Every time-series data generated by a household com-prises of multiple appliances working in conjunction. The household under consideration has 6 different appliances working together. These appliances work for variable length of time and generate a power consumption pattern as re-ported in Fig 3. In the first set of experiments, we test the appliance detection accuracy of the proposed approach. We feed as input the actual smart meter data to the pro-posed approach and use the generated time-series data of the identified appliances to generate a confusion matrix.
We evaluate the accuracy of appliance identification by comparing the results generated by the proposed approach with the available plug level data.
Table 1: Confusion Matrix
Detected Condition Total Energy Detected Positive Detected Negative
Condition Positive TP=5.737×10⁹ FN=2.5498×10⁹ TPR=69.2% Condition Negative FP=2.4507×10⁹ TN=3.486210 FPR=6.5%
Accuracy=81.8% Precision=70.1% FNR=30.7% TNR=93.4%
Table 1 presents the confusion matrix of the proposed approach for identifying the number of times in which an appliance was either confused with other appliances or was detected correctly. The number of times an appliance was correctly identified while being powered ON is referred to as True Positive (TP), whereas, if an appliance was not working and was incorrectly reported as being powered ON, is referred to as False Positive (FP). Similarly, the number of times an appliance was classified OFF when it was actually ON is referred to as False Negative (FN) and lastly, an appliance correctly classified OFF is referred to as True Negative (TN). The fraction of times an appliance was correctly classified as being ON while it was actually ON is referred to as the true Positive Rate (TPR) and the fraction of times the appliance was incorrectly classified ON while it was actually OFF is referred to as the False Positive Rate (FPR). Similarly the False Negative Rate (FNR) and the True Negative Rate (TNR) are defined as shown below:
T P R= T P
(T P +F N), F P R=
F P
(F P +T N) (24)
F N R= F N
(T P +F N), T N R=
T N
(F P +T N) (25)
[image:9.595.42.280.397.607.2]Table 2: Percentage participation of each appliance with varyingrfor individual devices.
Percentage participation per appliance
Appliance 1= 0 1= 0.25 1= 0.5 1= 0.75 1= 1 2= 0 2= 0.25 2= 0.5 2= 0.75 2= 1
Fridge (1) 8.61% 6.46% 4.30% 2.15% 0.01% 8.61% 8.61% 8.61% 8.61% 8.61%
Dryer (2) 0.85% 0.85% 0.85% 0.85% 0.85% 0.85% 0.64% 0.42% 0.21% 0.00%
Kettle (3) 4.89% 4.52% 4.16% 3.79% 3.44% 4.89% 4.89% 4.89% 4.89% 4.89%
Washing Machine (4) 29.70% 29.70% 29.70% 29.70% 29.70% 29.70% 29.70% 29.70% 29.70% 29.70%
PC (5) 0.01% 0.01% 0.01% 0.01% 0.01% 0.01% 0.01% 0.01% 0.01% 0.01%
Freezer (6) 33.79% 33.79% 33.79% 33.79% 33.79% 33.79% 33.79% 33.79% 33.79% 33.79%
Others 22.15% 24.67% 27.18% 29.70% 32.19% 22.15% 22.36% 22.57% 22.79% 23.00%
3= 0 3= 0.25 3= 0.5 3= 0.75 3= 1 4= 0 4= 0.25 4= 0.5 4= 0.75 4= 1
Fridge (1) 8.61% 7.65% 6.53% 5.53% 4.52% 8.61% 8.61% 8.61% 8.61% 8.61%
Dryer (2) 0.85% 0.85% 0.85% 0.85% 0.85% 0.85% 0.85% 0.85% 0.85% 0.85%
Kettle (3) 4.89% 3.66% 2.44% 1.22% 0.01% 4.89% 4.89% 4.89% 4.89% 4.89%
Washing Machine (4) 29.70% 29.70% 29.70% 29.70% 29.70% 29.70% 22.26% 14.85% 7.42% 0.02%
PC (5) 0.01% 0.01% 0.01% 0.01% 0.01% 0.01% 0.01% 0.01% 0.01% 0.01%
Freezer (6) 33.79% 33.79% 33.79% 33.79% 33.79% 33.79% 30.56% 27.35% 24.12% 20.92%
Others 22.15% 24.34% 26.68% 28.90% 31.12% 22.15% 32.81% 43.43% 54.10% 64.70%
5= 0 5= 0.25 5= 0.5 5= 0.75 5= 1 6= 0 6= 0.25 6= 0.5 6= 0.75 6= 1
Fridge (1) 8.61% 8.61% 8.61% 8.61% 8.61% 8.61% 8.61% 8.61% 8.61% 8.61%
Dryer (2) 0.85% 0.85% 0.85% 0.85% 0.85% 0.85% 0.85% 0.85% 0.85% 0.85%
Kettle (3) 4.89% 4.89% 4.89% 4.89% 4.89% 4.89% 4.89% 4.89% 4.89% 4.89%
Washing Machine (4) 29.70% 29.70% 29.70% 29.70% 29.70% 29.70% 22.22% 14.83% 7.39% 0.00%
PC (5) 0.01% 0.008% 0.006% 0.002% 0.000% 0.01% 0.008% 0.006% 0.003% 0.000%
Freezer (6) 33.789% 33.785% 33.782% 33.779% 33.777% 33.789% 25.341% 16.894% 8.447% 0.005%
Others 22.146% 22.155% 22.159% 22.166% 22.170% 22.146% 38.076% 53.914% 69.805% 85.642%
RMS power of 40±5 Watts, therefore, it is highly likely that when a Washing Machine is in operation, it is diffi-cult to identify the operation status of a Freezer. This goes without saying that the Freezer is in operation throughout the day and a single operation cycle of a Washing Machine overshadows multiple operation cycles of the Freezer thus resulting in a lower TPR value of 69%. In such a sce-nario, the proposed approach performs well in identifying the appliances correctly with an accuracy of 80.1% and a precision of 70.1%.
In the next set of experiments, we investigate the change in percentage of the identifiable appliance signature asris increased for each appliance individually. Each appliance has a distinctive power consumption pattern thus gener-ating a unique signature as reported in Fig 3. Adequate changes to this signature pattern would render the appli-ance non identifiable. The increase inr, associated to an appliancer, is expected to reduce the percentage of identi-fiable appliance signature. Fig 4a reports the percentage of identifiable appliance signature for each individual appli-ance in the smart meter data for a single day when,r= 0 ∀r. Anr= 0 is the minimum privacy setting and means that the appliance signature should be left un-altered. Fig 4b, shows a different setting. Each individual appliance is assigned a different privacy setting using differentvalues. Fridge 1= 0.5, Dryer2 = 0.8, Kettle3 = 0.7, Washing
Machine4= 0.2, PC5= 1 and Freezer6= 0.3. It is
ob-served that the percentage participation of each individual appliance reduces according to its own epsilon value. For example, the freezer whose 6has increased from 0 to 0.3
has reported a participation decrease from 30% to 24%. The decrease in the participation of all the appliances has
(a)r= 0∀r (b)1 = 0.5,2= 0.8,3 = 0.7,
[image:10.595.304.559.104.515.2]4= 0.2,5= 1,6= 0.3
Figure 4: Percentage contribution of each appliance for differentr
values. Here, Fridge=1, Dryer=2, Kettle=3, Washing Machine=
4, PC=5 and Freezer=6
resulted in the increase of the Other category, which refers to the consumption reading that does not fall into any of the appliance signatures.
We further elaborate on the change in percentage con-tribution of each appliance signature when the privacy set-tingrfor only a single appliance is altered at a time, keep-ing the rest unaltered. Table 2 reports the results when for a single appliance is changed from zero to 1 in steps of 0.25 and the rest are kept zero. It can be observed from table 2 that, as the privacy for a particular appliance increases with an increasing value of, the percentage con-tribution, of that particular appliance decreases.
The original data set shows that, the overall power con-sumption of the household is divided into three phases. The Fridge and Kettle work on one phase, the dryer works separately on one phase and the Washing Machine along
with the PC and Freezer work on the remaining phase. In a scenario when the user is willing to hide only a single ap-pliance from the power consumption pattern, an efficient privacy preserving algorithm would be expected to iden-tify the appliance correctly even if it is working concur-rently with multiple other devices and hide the signature accordingly. This would, as a result, affect the percentage contribution of the devices that are working on the same time instance as the concerned device. This phenomenon is also visible from Table 2 where, by changing the privacy setting of the Fridge, the percentage contribution of the Kettle is also being affected and likewise, by changing the privacy setting of the Freezer, the contribution of the PC and Washing Machine are also affected, hence highlighting that the proposed approach correctly identifies appliances that are working concurrently.
[image:11.595.311.550.168.271.2]We further validate the performance of the proposed approach using information theory principles. In particu-lar, we observe the change in mutual information between the original smart meter reading and the smart meter read-ing after it is scattered usread-ing the proposed approach. Mu-tual information quantifies the amount of information two data sets share and thus how much does one data set reveal about the other [41]. We use mutual information between the original and the scattered data set as a measure of util-ity. Fig 5 reports the change in mutual information when r associated to a particular appliance is increased from zero to one thus increasing the privacy of the appliance. An increase in privacy should result in a decrease in mu-tual information and thus a decrease in utility of the data. However, the question which arises is, which appliances have the most effect on the overall privacy. Fig 5 reports that the larger the contribution of an appliance reported in Fig 4a, the greater the decrease in mutual information thus a greater decrease in the utility of the data.
Figure 5: Change in mutual information between the Original data and the smart meter data scattered using the proposed approach for increasingr.
Mutual information can also be used to assess privacy where privacy is a measure of the percentage contribution of each individual appliance. An increase in privacy in the considered environment implies that the percentage contribution of each individual appliance signature should reduce. We test this by reporting the change in mutual information between the smart meter data scattered us-ing the proposed approach and the plug data available for
[image:11.595.44.282.515.615.2]each appliance. Fig 6 reports that, as the privacy setting is increased for each individual appliance, the mutual in-formation between the plug data and the scattered data decreases thus showing an increase in privacy. The largest rate of decrease is reported by the Freezer which has the highest contribution to the overall consumption.
Figure 6: Change in mutual information between the plug data and the smart meter data scattered using the proposed approach for in-creasingr.
We complement our claims using another set of sim-ulations. In these simulations, we test the privacy pre-serving capability of the proposed approach against two well-known Non-Intrusive Load Monitoring (NILM) algo-rithms, namely: The Weiss’ algorithm and the Baranski’s algorithm. The time-series data generated using the pro-posed approach is analysed by these NILM algorithms and the number of appliances being identified reported. The larger the number of successfully identified appliances, the lower the level of privacy. Therefore, in ideal case, maxi-mum privacy would be assured when no appliance is being detected.
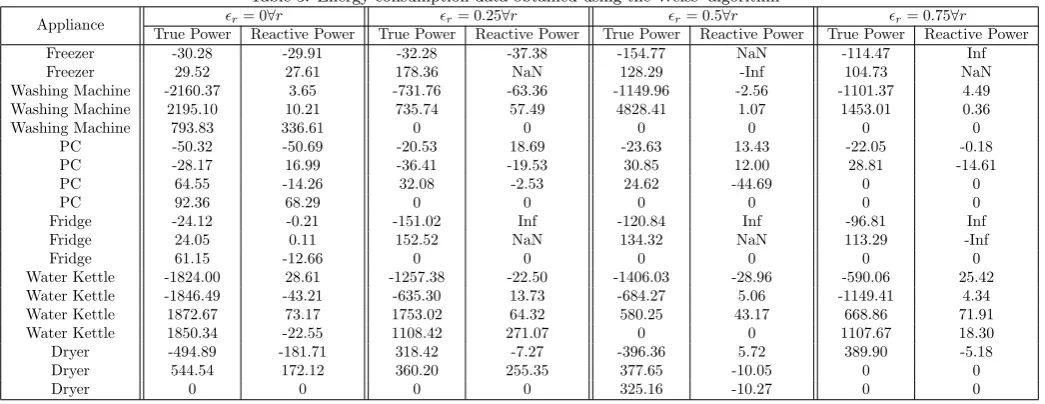
Table 3: Energy consumption data obtained using the Weiss’ algorithm
Appliance r= 0∀r r= 0.25∀r r= 0.5∀r r= 0.75∀r
True Power Reactive Power True Power Reactive Power True Power Reactive Power True Power Reactive Power
Freezer -30.28 -29.91 -32.28 -37.38 -154.77 NaN -114.47 Inf
Freezer 29.52 27.61 178.36 NaN 128.29 -Inf 104.73 NaN
Washing Machine -2160.37 3.65 -731.76 -63.36 -1149.96 -2.56 -1101.37 4.49
Washing Machine 2195.10 10.21 735.74 57.49 4828.41 1.07 1453.01 0.36
Washing Machine 793.83 336.61 0 0 0 0 0 0
PC -50.32 -50.69 -20.53 18.69 -23.63 13.43 -22.05 -0.18
PC -28.17 16.99 -36.41 -19.53 30.85 12.00 28.81 -14.61
PC 64.55 -14.26 32.08 -2.53 24.62 -44.69 0 0
PC 92.36 68.29 0 0 0 0 0 0
Fridge -24.12 -0.21 -151.02 Inf -120.84 Inf -96.81 Inf
Fridge 24.05 0.11 152.52 NaN 134.32 NaN 113.29 -Inf
Fridge 61.15 -12.66 0 0 0 0 0 0
Water Kettle -1824.00 28.61 -1257.38 -22.50 -1406.03 -28.96 -590.06 25.42
Water Kettle -1846.49 -43.21 -635.30 13.73 -684.27 5.06 -1149.41 4.34
Water Kettle 1872.67 73.17 1753.02 64.32 580.25 43.17 668.86 71.91
Water Kettle 1850.34 -22.55 1108.42 271.07 0 0 1107.67 18.30
Dryer -494.89 -181.71 318.42 -7.27 -396.36 5.72 389.90 -5.18
Dryer 544.54 172.12 360.20 255.35 377.65 -10.05 0 0
Dryer 0 0 0 0 325.16 -10.27 0 0
Table 4: Energy consumption data obtained using the Weiss’ algo-rithm
Appliance Proposed Approachr= 1∀r ElecPrivacy [13] True Power Reactive Power True Power Reactive Power
Freezer 0 0 -30.27 -29.69
Freezer 0 0 29.39 27.04
Washing Machine 0 0 -2190.65 -13.70 Washing Machine 0 0 854.92 373.17 Washing Machine 0 0 2194.01 10.59
PC 0 0 -42.30 -4.90
PC 0 0 64.55 -14.26
PC 0 0 92.36 68.29
PC 0 0 0 0
Fridge 0 0 -24.16 -0.21
Fridge 0 0 24.36 0.26
Fridge 0 0 0 0
Water Kettle 0 0 -1832.91 -9.06 Water Kettle 0 0 1848.75 -30.02 Water Kettle 0 0 1862.13 82.14
Water Kettle 0 0 0 0
Dryer 0 0 -494.89 -181.71
Dryer 0 0 544.54 172.12
Dryer 0 0 0 0
is unsupervised and thus operates without having infor-mation about the appliances existing in a household. It identifies recurring electricity consumption events in the aggregate electricity consumption of a household and clus-ters these events assuming that events in the same cluster belong to the same appliance. In these experiments, we also compare the proposed approach with an existing ap-proach referred to as the ElecPrivacy [13] apap-proach. The selection of this approach is due to its most relevance to the proposed approach as the authors therein identify the importance of individual appliances in a household. They divide the storage capacity of the battery source into equal sized slots where the number of slots is equal to the num-ber of appliances in the household and use a unique charge and discharge pattern to hide all the appliances together. We evaluate the performance of the proposed approach against the existing ElecPrivacy approach by testing the generated scrambled time-series data using the Weiss’ and the Baranski’s algorithm. An algorithm would be
con-sidered efficient in ensuring privacy if it is able to hide all the appliances, if required by the user, with the hid-ing behid-ing confirmed when Weiss’ and/or the Baranski’s algorithm are not able to detect the appliances in a house-hold. Table 3 reports the results when smart meter data is scattered using the proposed approach and the resulting scattered data is fed into the Weiss’s algorithm to identify appliances in the household. In this set of experiments,r is increased from 0 to 0.75 in steps of 0.25. The Weiss’s algorithm is fed with the original plug data along with the altered smart meter data and then the appliance utiliza-tion is identified. Table 3 shows the change in true power and reactive power at On and OFF switching events, where a positive true power refers to an On switching event and a negative true power refers to an OFF switching event. It is evident that asrincreases from 0 to 0.75, the magnitude of true and reactive powers identified for each individual appliance decreases. This shows that with an increase in rfewer number of switching events are classified for each individual appliance thus ensuring an increase in privacy. A reactive power ofInfandN aNis a result of false detec-tion of an appliance. In the ECO data set, the smart me-ter power readings are accompanied by the corresponding changing current and voltage values and when the current and voltage curves do not support the power curve, the Weiss’ algorithm reports aN aN orInf value. Thus it is clear from Table 3 that the proposed approach works con-siderably well despite a low accuracy and precision value reported in Table 1. We also compare the proposed ap-proach with r = 1 against the existing ElecPrivacy ap-proach and report the observed results in Table 4. It is observed that the proposed approach performs well in hid-ing an appliance as the Weiss’ algorithm does not identify any appliance whereas, it identifies most of the appliances when the existing ElecPrivacy approach is used. The main reason for this identification of appliances is that they di-vide the battery energy into equal number of slots, where
[image:12.595.38.288.340.507.2]this number is decided by the number of appliances in a household. Each appliance uses the available slot to hide its signature and the battery is charged when no appli-ance is consuming energy. In the considered ECO data set there are 6 appliances and very few intervals during which the battery can be charged using their defined approach. On the contrary, the proposed approach uses a novel bat-tery charging pattern which ensures that the batbat-tery is charged at all possible intervals using a different amount of energy, hence enabling us to add noise into the smart meter reading.
We further strengthen our privacy claim by testing the proposed approach against the unsupervised Baranski’s al-gorithm. Similar to the previous experiment, the Baran-ski’s algorithm is fed as input the time-series data scram-bled using the proposed approach with varying r from 0 to 1 in steps of 0.25 and comparing the obtained results with the ElecPrivacy approach. Privacy is measured by the number of appliances that are successfully identified by the Baranski’s algorithm, where a higher number of identified appliances is interpreted as a lower level of pri-vacy.
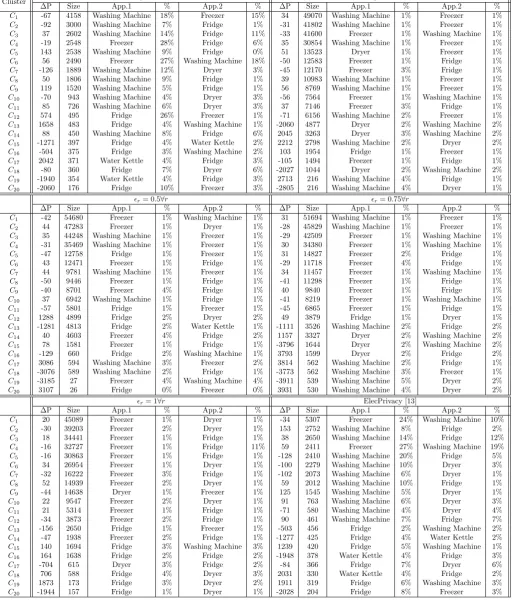
The Baranski’s algorithm takes as input the aggregate 1Hz electricity consumption data for the household. We set the resulting number of clusters to 20 with the base-line condition that each appliance can only have two states with a maximumON state of 60 minutes. Table 5 reports the results from the experiment. Each cluster shows the set of switching events that report a similar change in the electricity consumption pattern with the column size rep-resenting the number of events in a cluster. To enhance the usability and understandability of the obtained results, time stamps in the plug level information are used to as-sign each event to an appliance. The percentage of each assigned event in a cluster is reported in the % column and it is calculated using the proportion of events assigned to the appliance divided by the overall number of events in the cluster. Column App.1 and App.2 represent the appli-ances that have the highest and second highest number of assigned events in a cluster respectively. It is noticeable that, when no privacy is introduced withr= 0∀r, Cluster 4 and Cluster 6 exclusively contain stop and start event of the Freezer respectively. Whereas, Cluster 1 reports a switching event due to both the Washing Machine and the Freezer. Table 5 highlights that, as r ∀r increases from 0 to 1, the overall size of clusters increase result-ing in a decrease in participation of individual appliances. On the same time, the magnitude of the change in power ∆P also decreases with increasing r. These changes are merely a result of the increase in noise in the generated time-series data. The addition of noise divides a single high power spike into multiple small steps thus generat-ing a large number of clusters with smaller ∆P values. In the considered household, the Fridge and the Freezer con-sume the smallest amount of RMS power, this results in the identification of mostly these devices when more noise is added into the generated time-series data. In a
house-hold, a Fridge and a Freezer run continuously for the whole day and they show no correlation with the presence or ab-sence of an individual, therefore the increase in number of clustered reporting Fridge and/or Freezer is referred to as the success of the proposed approach. On the contrary, when the same Baranski’s algorithm is used to identify appliances from the time-series data generated using the ElecPrivacy approach, table 5 reports that, most of the appliances are still easily identifiable with only a slight change in the magnitude of ∆P.
(a) Original
(b) Proposed
[image:13.595.314.548.208.523.2](c) ElecPrivacy [13]
Figure 7: Smart meter reading of a household on 7/06/2012 for com-parison between the a)original reading b) after scrambling using the proposed approach c) after scrambling using the existing ElecPrivacy approach.
Table 5: Event clusters provided by Baranski’s algorithm
Cluster r= 0∀r r= 0.25∀r
∆P Size App.1 % App.2 % ∆P Size App.1 % App.2 %
C1 -67 4158 Washing Machine 18% Freezer 15% 34 49070 Washing Machine 1% Freezer 1%
C2 -92 3000 Washing Machine 7% Fridge 1% -31 41802 Washing Machine 1% Freezer 1%
C3 37 2602 Washing Machine 14% Fridge 11% -33 41600 Freezer 1% Washing Machine 1%
C4 -19 2548 Freezer 28% Fridge 6% 35 30854 Washing Machine 1% Freezer 1%
C5 143 2538 Washing Machine 9% Fridge 0% 51 13523 Dryer 1% Freezer 1%
C6 56 2490 Freezer 27% Washing Machine 18% -50 12583 Freezer 1% Fridge 1%
C7 -126 1889 Washing Machine 12% Dryer 3% -45 12170 Freezer 3% Fridge 1%
C8 50 1806 Washing Machine 9% Fridge 1% 39 10983 Washing Machine 1% Freezer 1%
C9 119 1520 Washing Machine 5% Fridge 1% 56 8769 Washing Machine 1% Freezer 1%
C10 -70 943 Washing Machine 4% Dryer 3% -56 7564 Freezer 1% Washing Machine 1%
C11 85 726 Washing Machine 6% Dryer 3% 37 7146 Freezer 3% Fridge 1%
C12 574 495 Fridge 26% Freezer 1% -71 6156 Washing Machine 2% Freezer 1%
C13 1658 483 Fridge 4% Washing Machine 1% -2060 4877 Dryer 2% Washing Machine 2%
C14 88 450 Washing Machine 8% Fridge 6% 2045 3263 Dryer 3% Washing Machine 2%
C15 -1271 397 Fridge 4% Water Kettle 2% 2212 2798 Washing Machine 2% Dryer 2%
C16 -504 375 Fridge 3% Washing Machine 2% 103 1954 Fridge 1% Freezer 1%
C17 2042 371 Water Kettle 4% Fridge 3% -105 1494 Freezer 1% Fridge 1%
C18 -80 360 Fridge 7% Dryer 6% -2027 1044 Dryer 2% Washing Machine 2%
C19 -1940 354 Water Kettle 4% Fridge 3% 2713 216 Washing Machine 4% Fridge 1%
C20 -2060 176 Fridge 10% Freezer 3% -2805 216 Washing Machine 4% Dryer 1%
r= 0.5∀r r= 0.75∀r
∆P Size App.1 % App.2 % ∆P Size App.1 % App.2 %
C1 -42 54680 Freezer 1% Washing Machine 1% 31 51694 Washing Machine 1% Freezer 1%
C2 44 47283 Freezer 1% Dryer 1% -28 45829 Washing Machine 1% Freezer 1%
C3 35 44248 Washing Machine 1% Freezer 1% -29 42509 Freezer 1% Washing Machine 1%
C4 -31 35469 Washing Machine 1% Freezer 1% 30 34380 Freezer 1% Washing Machine 1%
C5 -47 12758 Fridge 1% Freezer 1% 31 14827 Freezer 2% Fridge 1%
C6 43 12471 Freezer 1% Fridge 1% -29 11718 Freezer 4% Fridge 1%
C7 44 9781 Washing Machine 1% Freezer 1% 34 11457 Freezer 1% Washing Machine 1%
C8 -50 9446 Freezer 1% Fridge 1% -41 11298 Freezer 1% Fridge 1%
C9 -40 8701 Freezer 4% Fridge 1% 40 9840 Freezer 1% Fridge 1%
C10 37 6942 Washing Machine 1% Fridge 1% -41 8219 Freezer 1% Washing Machine 1%
C11 -57 5801 Fridge 1% Freezer 1% -45 6865 Freezer 1% Fridge 1%
C12 1288 4899 Fridge 2% Dryer 2% 49 3879 Fridge 1% Dryer 1%
C13 -1281 4813 Fridge 2% Water Kettle 1% -1111 3526 Washing Machine 2% Fridge 2%
C14 40 4603 Freezer 4% Fridge 2% 1157 3327 Dryer 2% Washing Machine 2%
C15 78 1581 Freezer 1% Fridge 1% -3796 1644 Dryer 2% Washing Machine 2%
C16 -129 660 Fridge 2% Washing Machine 1% 3793 1599 Dryer 2% Fridge 2%
C17 3086 594 Washing Machine 3% Freezer 2% 3814 562 Washing Machine 2% Fridge 1%
C18 -3076 589 Washing Machine 2% Fridge 1% -3773 562 Washing Machine 3% Freezer 1%
C19 -3185 27 Freezer 4% Washing Machine 4% -3911 539 Washing Machine 5% Dryer 2%
C20 3107 26 Fridge 0% Freezer 0% 3931 530 Washing Machine 4% Dryer 2%
r= 1∀r ElecPrivacy [13]
∆P Size App.1 % App.2 % ∆P Size App.1 % App.2 %
C1 20 45089 Freezer 1% Dryer 1% -34 5307 Freezer 24% Washing Machine 10%
C2 -30 39203 Freezer 2% Dryer 1% 153 2752 Washing Machine 8% Fridge 2%
C3 18 34441 Freezer 1% Fridge 1% 38 2650 Washing Machine 14% Fridge 12%
C4 -16 32727 Freezer 1% Fridge 11% 59 2411 Freezer 27% Washing Machine 19%
C5 -16 30863 Freezer 1% Fridge 1% -128 2410 Washing Machine 20% Fridge 5%
C6 34 26954 Freezer 1% Dryer 1% -100 2279 Washing Machine 10% Dryer 3%
C7 -32 16222 Freezer 3% Fridge 1% -102 2073 Washing Machine 6% Dryer 1%
C8 52 14939 Freezer 2% Dryer 1% 59 2012 Washing Machine 10% Fridge 1%
C9 -44 14638 Dryer 1% Freezer 1% 125 1545 Washing Machine 5% Dryer 1%
C10 22 9547 Freezer 2% Dryer 1% 91 763 Washing Machine 6% Dryer 3%
C11 21 5314 Freezer 1% Fridge 1% -71 580 Washing Machine 4% Dryer 4%
C12 -34 3873 Freezer 2% Fridge 1% 90 461 Washing Machine 7% Fridge 7%
C13 -156 2650 Fridge 1% Freezer 1% -503 456 Fridge 2% Washing Machine 2%
C14 -47 1938 Freezer 2% Fridge 1% -1277 425 Fridge 4% Water Kettle 2%
C15 140 1694 Fridge 3% Washing Machine 3% 1239 420 Fridge 5% Washing Machine 1%
C16 164 1638 Fridge 2% Fridge 2% -1948 378 Water Kettle 4% Fridge 3%
C17 -704 615 Dryer 3% Fridge 2% -84 366 Fridge 7% Dryer 6%
C18 706 588 Fridge 4% Dryer 3% 2031 330 Water Kettle 4% Fridge 2%
C19 1873 173 Fridge 3% Dryer 2% 1911 319 Fridge 6% Washing Machine 3%
C20 -1944 157 Fridge 1% Dryer 1% -2028 204 Fridge 8% Freezer 3%
hide an appliance that might be running on the particu-lar instance but it changes the average consumption per harvesting interval thus forcing the consumer to pay more due to the altered smart meter reading. Moreover, a pat-tern similar to the original meter is reported in the interval from 2.4×10⁴and 2.8×10⁴as a result of the battery not
having sufficient energy to alter the smart meter reading thus revealing all the appliances.
6. Conclusion
In this work, we highlight the relationship between ap-pliance specific privacy of an individual and the utility of a smart meter generated data. We proposed a new ap-proach that allows the user to control the amount of in-formation that is being shared regarding each individual appliance. This allows the user to trade between the level of user data privacy in exchange to the utility of the re-sultant smart meter data. Simulations were conducted to test the proposed approach with respect to the amount of privacy achieved and the resulting smart meter data utility. Results indicate the proposed approach is success-ful in controlling the privacy of each individual appliance and the utility of the resulting smart meter data. Appli-ances with higher power consumption are also found to have a larger effect on the total privacy achieved. The obtained results also indicate an improvement in perfor-mance of the proposed approach when compared with the existing ElecPrivacy approach. This comparison was con-ducted by feeding the resulting smart meter data into the Weiss’ and the Baranski’s algorithm which highlight that, the traces generated by the proposed approach are harder to identify. The latter demonstrates its effectiveness. In the future, we aim at adopting a more analytical approach to the considered problem by attempting a direct or sub-optimal solution to the posed optimization problem.
References
[1] A. Majeed, Internet of things (iot): A verification framework, in: IEEE 7th Annual Computing and Communication Workshop and Conference (CCWC), 2017, pp. 1–3.
[2] M. Hooshmand, D. Zordan, D. Del Testa, E. Grisan, M. Rossi, Boosting the battery life of wearables for health monitoring through the compression of biosignals, IEEE Internet of Things Journal.
[3] T. Zheng, J.-C. Wang, M.-J. Weng, Y.-M. Liang, Y.-T. Liu, C.-J. Lin, Using intelligent agent to build toddler monitoring system, in: International Conference on Machine Learning and Cybernetics (ICMLC), Vol. 1, IEEE, 2015, pp. 433–438. [4] A. G. Ferreira, D. Fernandes, S. Branco, J. L. Monteiro,
J. Cabral, A. P. Catarino, A. M. Rocha, A smart wearable system for sudden infant death syndrome monitoring, in: In-ternational Conference on Industrial Technology (ICIT), IEEE, 2016, pp. 1920–1925.
[5] R. Van Gerwen, S. Jaarsma, R. Wilhite, Smart metering, Leonardo-energy. org 9.
[6] R. Dong, A. A. C´ardenas, L. J. Ratliff, H. Ohlsson, S. S. Sastry, Quantifying the utility-privacy tradeoff in the smart grid, arXiv preprint arXiv:1406.2568.
[7] P. Institute, New ponemon study points to need for smart grid education (2010).
URLhttp://www.ponemon.org/news-2/39
[8] A. Yassine, A. A. N. Shirehjini, S. Shirmohammadi, Smart me-ters big data: Game theoretic model for fair data sharing in deregulated smart grids, IEEE Access 3 (2015) 2743–2754. [9] K. Weaver, A perspective on how smart meters invade
individ-ual privacy (2014).
[10] A. Santos, J. Macedo, A. Costa, M. J. Nicolau, Internet of things and smart objects for m-health monitoring and control, Proce-dia Technology 16 (2014) 1351–1360.
[11] J. Baek, Q. H. Vu, J. K. Liu, X. Huang, Y. Xiang, A secure cloud computing based framework for big data information manage-ment of smart grid, IEEE transactions on cloud computing 3 (2) (2015) 233–244.
[12] A. Molina-Markham, P. Shenoy, K. Fu, E. Cecchet, D. Ir-win, Private memoirs of a smart meter, in: Proceedings of the 2nd ACM workshop on embedded sensing systems for energy-efficiency in building, ACM, 2010, pp. 61–66.
[13] G. Kalogridis, R. Cepeda, S. Z. Denic, T. Lewis, C. Efthymiou, Elecprivacy: Evaluating the privacy protection of electricity management algorithms, IEEE Transactions on Smart Grid 2 (4) (2011) 750–758.
[14] W. Kleiminger, C. Beckel, T. Staake, S. Santini, Occupancy detection from electricity consumption data, in: Proceedings of the 5th ACM Workshop on Embedded Systems For Energy-Efficient Buildings, ACM, 2013, pp. 1–8.
[15] M. Weiss, A. Helfenstein, F. Mattern, T. Staake, Leveraging smart meter data to recognize home appliances, in: Interna-tional Conference on Pervasive Computing and Communica-tions (PerCom), IEEE, 2012, pp. 190–197.
[16] M. Baranski, J. Voss, Genetic algorithm for pattern detection in nialm systems, in: ieee international conference on systems, man and cybernetics, Vol. 4, IEEE, 2004, pp. 3462–3468. [17] E. Shi, H. Chan, E. Rieffel, R. Chow, D. Song,
Privacy-preserving aggregation of time-series data, in: Annual Network & Distributed System Security Symposium (NDSS), Internet Society., 2011.
[18] V. Rastogi, S. Nath, Differentially private aggregation of dis-tributed time-series with transformation and encryption, in: Proceedings of the 2010 ACM SIGMOD International Confer-ence on Management of data, ACM, 2010, pp. 735–746. [19] C. Efthymiou, G. Kalogridis, Smart grid privacy via
anonymiza-tion of smart metering data, in: First IEEE Internaanonymiza-tional Con-ference on Smart Grid Communications (SmartGridComm), IEEE, 2010, pp. 238–243.
[20] L. Sankar, S. R. Rajagopalan, S. Mohajer, Smart meter pri-vacy: A theoretical framework, IEEE Transactions on Smart Grid 4 (2) (2013) 837–846.
[21] S. Papadimitriou, F. Li, G. Kollios, P. S. Yu, Time series com-pressibility and privacy, in: Proceedings of the 33rd interna-tional conference on Very large data bases, VLDB Endowment, 2007, pp. 459–470.
[22] S. Wang, L. Cui, J. Que, D.-H. Choi, X. Jiang, S. Cheng, L. Xie, A randomized response model for privacy preserving smart me-tering, IEEE transactions on smart grid 3 (3) (2012) 1317–1324. [23] M. Jawurek, F. Kerschbaum, G. Danezis, Sok: Privacy tech-nologies for smart grids - a survey of options, Microsoft Res., Cambridge, UK.
[24] M. Erol-Kantarci, H. T. Mouftah, Smart grid forensic science: applications, challenges, and open issues, IEEE Communica-tions Magazine 51 (1) (2013) 68–74.
[25] Y. Chen, S. Chong, I. A. Kash, T. Moran, S. Vadhan, Truthful mechanisms for agents that value privacy, ACM Transactions on Economics and Computation 4 (3) (2016) 13.
[26] H. Hu, G.-J. Ahn, Z. Zhao, D. Yang, Game theoretic analysis of multiparty access control in online social networks, in: Pro-ceedings of the 19th ACM symposium on Access control models and technologies, ACM, 2014, pp. 93–102.
implications, in: 28th Computer Security Foundations Sympo-sium (CSF), IEEE, 2015, pp. 90–104.
[28] M. A. Erdogdu, N. Fawaz, A. Montanari, Privacy-utility trade-off for time-series with application to smart-meter data, in: Workshops at the Twenty-Ninth AAAI Conference on Artifi-cial Intelligence, 2015.
[29] A. McGregor, I. Mironov, T. Pitassi, O. Reingold, K. Tal-war, S. Vadhan, The limits of two-party differential privacy, in: Foundations of Computer Science (FOCS), 2010 51st Annual IEEE Symposium on, IEEE, 2010, pp. 81–90.
[30] A. De, Lower bounds in differential privacy, Theory of Cryptog-raphy (2012) 321–338.
[31] G. Barthe, B. Kopf, Information-theoretic bounds for differen-tially private mechanisms, in: 24th Computer Security Founda-tions Symposium (CSF), IEEE, 2011, pp. 191–204.
[32] C. Dwork, A. Roth, et al., The algorithmic foundations of differ-ential privacy, Foundations and Trends in Theoretical Computer Science 9 (3-4) (2014) 211–407.
[33] C. Dwork, K. Kenthapadi, F. McSherry, I. Mironov, M. Naor, Our data, ourselves: Privacy via distributed noise generation., in: Eurocrypt, Vol. 4004, Springer, 2006, pp. 486–503. [34] M. S. Alvim, M. E. Andr´es, K. Chatzikokolakis, C. Palamidessi,
On the relation between differential privacy and quantitative information flow, in: International Colloquium on Automata, Languages, and Programming, Springer, 2011, pp. 60–76. [35] P. Cuff, L. Yu, Differential privacy as a mutual information
con-straint, in: Proceedings of the 2016 ACM SIGSAC Conference on Computer and Communications Security, ACM, 2016, pp. 43–54.
[36] H.-H. Chang, L.-S. Lin, N. Chen, W.-J. Lee, Particle-swarm-optimization-based nonintrusive demand monitoring and load identification in smart meters, IEEE Transactions on Industry Applications 49 (5) (2013) 2229–2236.
[37] R. Rao, S. Akella, G. Guley, Power line carrier (plc) signal anal-ysis of smart meters for outlier detection, in: International Con-ference on Smart Grid Communications (SmartGridComm), IEEE, 2011, pp. 291–296.
[38] R. M. do Nascimento, A. P. Oening, D. C. Marcilio, A. R. Aoki, E. de Paula Rocha, J. M. Schiochet, Outliers’ detection and fill-ing algorithms for smart meterfill-ing centers, in: Transmission and Distribution Conference and Exposition (T&D), IEEE, 2012, pp. 1–6.
[39] A. Ukil, S. Bandyopadhyay, A. Pal, Privacy for iot: Involuntary privacy enablement for smart energy systems, in: IEEE Interna-tional Conference on Communications (ICC), IEEE, 2015, pp. 536–541.
[40] Z. R. Struzik, A. Siebes, The haar wavelet transform in the time series similarity paradigm, in: European Conference on Principles of Data Mining and Knowledge Discovery, Springer, 1999, pp. 12–22.
[41] H. Peng, F. Long, C. Ding, Feature selection based on mu-tual information criteria of max-dependency, max-relevance, and min-redundancy, IEEE Transactions on pattern analysis and machine intelligence 27 (8) (2005) 1226–1238.
[42] C. Beckel, W. Kleiminger, R. Cicchetti, T. Staake, S. Santini, The eco data set and the performance of non-intrusive load monitoring algorithms, in: Proceedings of the 1st ACM Con-ference on Embedded Systems for Energy-Efficient Buildings, ACM, 2014, pp. 80–89.