City, University of London Institutional Repository
Citation
:
Belhaj, A., Phillips, J. P., Kyriacou, P. A. & Langford, R. M. (2016). Comparison
of non-invasive peripheral venous saturations with venous blood co-oximetry. Journal of
Clinical Monitoring and Computing, doi: 10.1007/s10877-016-9959-9
This is the published version of the paper.
This version of the publication may differ from the final published
version.
Permanent repository link:
http://openaccess.city.ac.uk/16030/
Link to published version
:
http://dx.doi.org/10.1007/s10877-016-9959-9
Copyright and reuse:
City Research Online aims to make research
outputs of City, University of London available to a wider audience.
Copyright and Moral Rights remain with the author(s) and/or copyright
holders. URLs from City Research Online may be freely distributed and
linked to.
O R I G I N A L R E S E A R C H
Comparison of non-invasive peripheral venous saturations
with venous blood co-oximetry
A. M. Belhaj1•J. P. Phillips2• P. A. Kyriacou2•R. M. Langford3
Received: 4 June 2016 / Accepted: 11 October 2016
ÓThe Author(s) 2016. This article is published with open access at Springerlink.com
Abstract The estimation of venous oxygen saturations using photoplethysmography (PPG) may be useful as a noninvasive continuous method of detecting changes in regional oxygen supply and demand (e.g. in the splanchnic circulation). The aim of this research was to compare PPG-derived peripheral venous oxygen saturations directly with venous saturation measured from co-oximetry blood sam-ples, to assess the feasibility of non-invasive local venous oxygen saturation. This paper comprises two similar stud-ies: one in healthy spontaneously-breathing volunteers and one in mechanically ventilated anaesthetised patients. In both studies, PPG-derived estimates of peripheral venous oxygen saturations (SxvO2) were compared with
co-oximetry samples (ScovO2) of venous blood from the
dorsum of the hand. The results were analysed and corre-lation between the PPG-derived results and co-oximetry was tested for. In the volunteer subjects,moderate correla-tion (r=0.81) was seen between SxvO2 values and
co-oximetry derived venous saturations (ScovO2), with a
mean (±SD) difference of ?5.65 ±14.3% observed between the two methods. In the anaesthetised patients SxvO2values were only 3.81% lower than SpO2and
ten-ded to underestimate venous saturation (mean differ-ence=–2.67±5.89%) while correlating weakly with
ScovO2 (r=0.10). The results suggest that significant
refinement of the technique is needed to sufficiently improve accuracy to produce clinically meaningful mea-surement of peripheral venous oxygen saturation. In anaesthetised patients the use of the technique may be severely limited by cutaneous arteriovenous shunting.
Keywords Venous oxygen saturationPulse oximetry
PhotoplethysmographyRespiratory-induced intensity variations Non-invasive monitoring
1 Introduction
Photoplethysmography (PPG), a fundamental technology behind the widely used pulse oximeter, is an optical tech-nique that detects periodic blood volume changes in the tissue bed [1]. Pulse oximetry algorithms calculate arterial oxygen saturations (SpO2) using the ratio of absorbance of
red and infrared light by haemoglobin, exploiting the pul-satile nature of arterial blood to discriminate between arteries and non-pulsatile absorbers in the tissue, such as skin, muscle, bone and pigments [2].
SpO2 is by far the most common application of PPG,
and while undoubtedly useful, it only gives information about the incoming supply of oxygen. Knowledge of the oxygen saturations in the venous, as well as the arterial blood, reveals more about the balance of oxygen supply and demand in the monitored tissues than the arterial sat-urations alone. Of the factors affecting the arteriovenous difference in oxygen content (DO2) across a vascular bed,
blood flow through the organ has the greatest influence. Oxygen consumption and haemoglobin concentration also influence DO2, as demonstrated by the modified Fick
equation [3], but in the short term, these tend not to change
& J. P. Phillips
Justin.Phillips.1@city.ac.uk
1 Southend University Hospital, Prittlewell Chase,
Westcliff-on-Sea, Essex SS0 0RY, UK
2 Research Centre for Biomedical Engineering, City,
University of London, Northampton Square, London EC1V 0HB, UK
3 Pain and Anaesthesia Research Centre, St Bartholomew’s
significantly [4]. This concept is also applicable to the body as a whole, and is the physiological basis of using mixed venous saturations (SvO2) as an indication of cardiac
out-put in the assessment of global oxygen delivery. Mea-surement of SvO2, however, requires the placement of a
pulmonary artery catheter, which is not without significant risks, and the use of which has seen a steady decline in recent years [5,6].
Although peripheral venous saturations cannot replace or infer SvO2, direct correlation of central and peripheral
venous saturations (SxvO2) has been found by Echiadis
et al. to be viable in certain cases where the supply or demand balance changes rapidly [4], which would suggest the potential use as continuous non-invasive monitor in critically ill patients. In their study, high frequency artifi-cial venous pulsations, generated by a cuff around the base of the finger were used to calculate SxvO2, rather than any
intrinsic physiological PPG waveform component. Most interpretations of PPG assume that the only time-varying component of the signal is the variation in volume of the arterial compartment of blood within the tissue [7]. It has been shown that the volume of the veins also varies in response to various physiological and physical effects
[8, 9]. Breathing causes periodic variations in blood
vol-ume in the peripheral vascular bed, which are evident as Respiratory-Induced Intensity Variations (RIIVs) (see Figs.1, 4) on recorded PPG signals during spontaneous breathing and mechanical ventilation [10]. Changes in intrathoracic pressure are transmitted from the great veins in the thorax to smaller peripheral veins, and the degree of respiratory modulation depends on central venous pressure (CVP) and intrathoracic pressure [11]. During mechanical ventilation the amplitude of recorded RIIVs are inversely proportional to CVP [12]. Intravenous infusion of fluids has been reported to reduce recorded RIIVs [13], while the removal of blood increases them [14].
Previous research suggests that suitable signal analysis of PPG signals in the respiratory frequency range can produce estimations of SxvO2 [15]. Although saturations
lower than those of arterial blood have been obtained from analysis of oesophageal [16] and peripheral [17] PPG signals, these estimations have not to date been validated by comparison with co-oximetry of venous blood, consid-ered widely to be the gold standard [18,19].
The aim of this research was to compare PPG-derived local venous oxygen saturations directly with venous sat-uration measured from co-oximetry blood samples. The paper describes two separate clinical studies. In the first study, PPG-derived SxvO2was recorded from awake
vol-unteers breathing through a flow resistor to simulate mechanical ventilation and compared to peripheral venous co-oximetry sample values (ScovO2) obtained form the
dorsal vein of the hand. In the second study, similar mea-surements were performed in mechanically ventilated anaesthetised patients.
2 Methods
2.1 Instrumentation
The measurement system used in both studies consists of a custom made finger pulse oximeter, airway pressure sensor and peripheral venous pressure sensor, attached to the study main monitoring unit.
2.1.1 PPG probe
The study pulse oximeter is a standard commercial finger probe shell (GE Datex-OhmedaÒ, Helsinki, Finland), with the spring clip removed. The shell was fitted with red (660 nm) and infrared (940 nm) light emitting diodes (LEDs) in the upper part of the probe. A photodetector collects the proportion of light not absorbed by tissue on the lower side of the probe. The output feeds into the study monitoring unit where it is amplified using a tran-simpedance amplifier. A demultiplexer then separates the red (R) and infrared (IR) signals, which are then further separated into alternating current (AC) components, which represent the pulsatile components of the PPG, and direct current (DC) components, which accounts for non-pulsatile tissues in the finger. This separation is achieved using an active filter with pass band ranging from 0.38 to 28.2 Hz. All four signals (ACR, DCR, ACIRand DCIR) are filtered to
remove artifact using an active low pass filter of cut-off frequency 16.7 Hz to remove coupled mains and other interference. All filters used in the circuit are based on a second-order Butterworth-type Sallen and Key topology. The signals are digitised using a16-bit data acquisition card
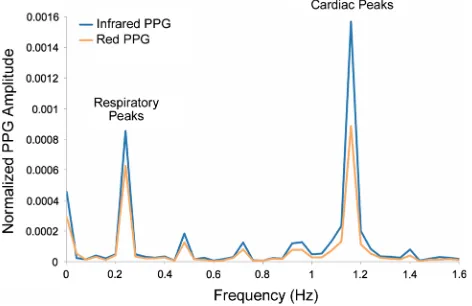
Fig. 1 Amplitude spectrum of normalized red and infrared PPG signals recorded from a ventilated anaesthetised patient. Prominent peaks at the respiratory and cardiac frequencies can be seen in both traces
[image:3.595.53.289.514.667.2](National Instruments Inc., Austin, TX, USA) located within the main monitoring unit and interfaced to a battery-powered notebook computer via a USB cable. All data acquisition functions were performed by a virtual instru-ment (LabVIEWÒ) on the notebook computer.
2.1.2 Airway pressure monitoring
For the volunteer studies, a mouthpiece consisting of a narrow tube (8 mm internal diameter) was used as a flow resistor to allow significant airway pressures to be gener-ated during forced breathing. A port on the mouthpiece was used to measure pressure at the mouth to give an estimation of airway pressure, connected to a signal conditioned pressure sensor (Honeywell Inc., Freeport IL, USA) via an airway gas sampling line. For the studies on mechanically ventilated patients, a short tube with a luer lock gas sam-pling port was placed between the ventilator tubing and the respiratory filter, and connected to the pressure sensor, as in the volunteer studies.
2.2 Experimental methods
2.2.1 Volunteer study
The study on awake volunteers was granted ethical approval by the Senate Research Ethics committee at City University, Northampton Square, London EC1V 0HB, United Kingdom and informed consent was obtained from all participants. ASA Grade 1 and 2 Consenting adults were recruited (9 M, 10 F, mean±SD age 28.5±7.83 years). Participants with respiratory disease including asthma, vascular disease and clotting disorders were excluded. Subjects were seated in a chair with the right hand resting on a table in front of them. The pulse oximeter probe was placed on the index finger of the right hand. The subjects performed 2 min of voluntary forced inspiration and expiration, in time with a periodic signal, through a narrow tube. These manoeuvres were designed to generate con-sistent alternating positive and negative airway pressures. The airway pressure, monitored from the mouthpiece, was displayed in real time on a computer screen so that the volunteers could aim for a prescribed rate (12 breaths per minute), rhythm (inspiratory to expiratory time ratio 1:1) and a target airway pressure (?15 to-15 cmH2O). Room
temperature was controlled at 22°C and the monitored hand was maintained at the level of the heart. Restrictive clothing which could impede venous return from the arm was removed. At the end of the monitoring period a venous blood sample was taken from the dorsum of the monitored hand and analysed immediately in a Radiometer ABL80 co-oximeter (Radiometer Inc., Copenhagen, Denmark).
2.2.2 Ventilated patient study
The study conducted on anaesthetised patients was granted full ethical approval by the East London and City Research Ethics Committee (study reference: 11/LO/0048). Patients requiring general anaesthesia and tracheal intubation were recruited to the study at the Royal London Hospital and written informed consent was obtained from all partici-pants. Measurements were made on 40 ASA Grade 1–3 patients (18 M, 22 F, mean±SD age 45.8±16.6 years) in the anaesthetic room. Patients with significant respira-tory disease, peripheral vascular disease and clotting dis-orders were excluded. Ambient temperature was in the range 19–23°C in all cases. After induction of anaesthesia and intubation, patients were ventilated with an airway pressure of 15 cmH2O initially, although the pressure was
adjusted in a few cases if dictated by clinical requirements. The study monitoring apparatus (finger probe, peripheral venous pressure transducer and gas sampling line) were then attached to the patient. PPG signals and airway pressures were then recorded for 10 min, at the end of which, a venous sample was taken from the dorsum of the hand and analysed using a co-oximeter (Radiometer ABL800) located near the anaesthetic room. The study apparatus was removed before the patient was transferred to the operating theatre.
2.3 Signal processing
Arterial and venous oxygen saturations were calculated from the recorded signals using the normalised AC amplitudes. These are obtained by dividing the AC component of the red and infrared PPG signals (ACR and
ACIR) by their respective DC signal (DCR and DCIR)
amplitudes, then converted to a spectral function using a discrete Fourier transform (DFT) producing the ampli-tude spectra AR(f) and AIR(f) of both signals (see Fig.1).
The amplitudes of the respiratory modulation AR(fRESP)
and AIR(fRESP) were found from the heights of the red
and infrared spectral peaks in the expected frequency range (0.1–0.4 Hz). The venous oxygen saturation SxvO2
was estimated from the ‘ratio-of-ratios’ (enclosed within the parentheses in the equation) using the following relation:
SxvO2¼11025 ARðfRESPÞ
AIRðfRESPÞ
ð1Þ
2.4 Statistical analysis
Outliers were excluded using a rejection threshold defined by Grubbs’ test [21] (Thompson tau test) with a 95% confidence level. For both studies, the root mean squared error (RMSE) for the venous saturations calculated from the PPG (SxvO2) signals versus co-oximetry derived venous saturation (ScovO2) using:
RMSE¼
ffiffiffiffiffiffiffiffiffiffiffiffiffiffiffiffiffiffiffiffiffiffiffiffiffiffiffiffiffiffiffiffiffiffiffiffiffiffiffiffiffiffiffiffiffiffiffiffiffiffiffi Pn
i¼1ðSxvO2ScovO2Þ 2
n s
ð2Þ
Paired t-tests were performed on all arterial and venous calculated saturation datasets to determine whether there was a statistically significant difference between SxvO2
and SpO2, and between SxvO2and ScovO2. The limits of
agreement between SxvO2and ScovO2were obtained from
the Modified Bland–Altman plot [22], whereby the differ-ence between SxvO2and ScovO2were plotted against the
established gold standard (ScovO2).
3 Results
3.1 Volunteer study
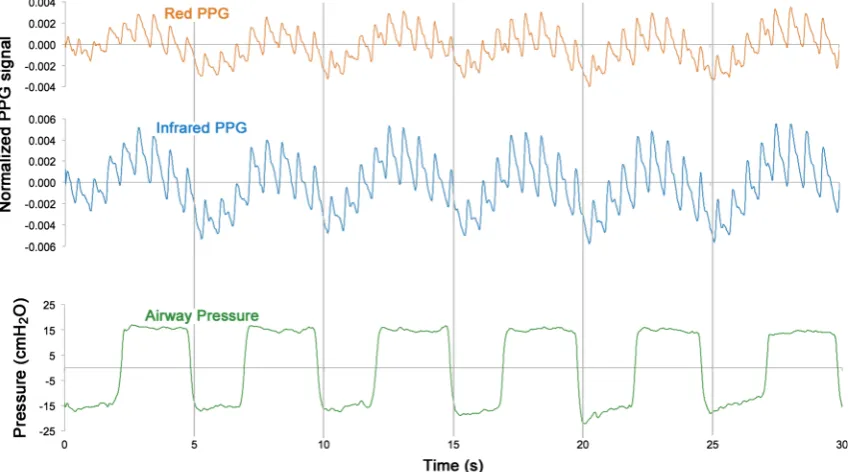
The respiratory modulations of the PPG signal were observed clearly in all subjects, with maximum attenuation of light occurring during the expiratory phase. Figure2 shows a 60 s sample from a typical subject of the
normalised red (ACR/DCR) and infrared (ACIR/DCIR) PPG
signals with airway pressure simultaneously recorded during the forced breathing manoeuvres.
Nineteen volunteers were recruited to this study. Two results were identified as outliers and removed from the dataset. Figure3shows the mean arterial saturation (SpO2)
and the mean venous saturations (ScovO2and SxvO2) for
all subjects. The mean difference between PPG derived peripheral venous saturations (SxvO2) and arterial
satura-tions as measured by the commercial pulse oximeter (SpO2) was-23.4% (P\0.05,n=17). The experimental
method overestimated the venous oxygen saturation; the mean (±SD) difference between between SxvO2 values
and co-oximetry derived venous saturations (ScovO2) was
?5.65±14.3%.
Figure4 shows a modified Bland–Altman plot of the difference between PPG-derived peripheral venous satu-ration (SxvO2) and co-oximetry values (ScovO2) against
the gold standard, ScovO2. The results show moderate
correlation (r=0.81, RMSE=15.1%, P=0.137) and wide limits of agreement between the two methods of measurement.
3.2 Ventilated patient study
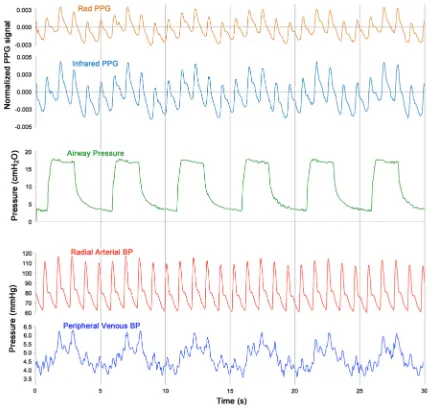
Forty subjects were recruited in this study. Figure5shows a 60 s sample from a typical subject of the normalised red (ACR/DCR) and infrared (ACIR/DCIR) PPG signals with
simultaneous airway pressure and peripheral venous
Fig. 2 30 s sample of red and infrared photoplethysmographic signals with simultaneously recorded airway pressures from one volunteer subject during timed forced breathing manoeuvre
[image:5.595.86.511.449.685.2]pressure waveforms. As with the volunteer study, signifi-cant modulation of the PPG signal was observed in time with ventilatory variations in airway pressure and periph-eral venous pressure. Two results were identified as outliers and removed from the dataset. Figure6 shows the mean arterial saturation (SpO2) and the mean venous saturations
(ScovO2and SxvO2) for all subjects. The mean difference
between the PPG-derived peripheral venous saturations (SxvO2) and the arterial saturation as measured by the
commercial pulse oximeter (SpO2) was-3.81% (P\0.05,
n=38). The experimental method underestimated the venous oxygen saturation; a mean (±SD) difference of
-2.67%, ±5.89% between SxvO2 and the ScovO2 was
observed. It should be noted that the blood sampled from the hands of the anaesthetised patients (ScovO2) showed
considerably higher mean oxygen saturation than was seen in the volunteer subjects (94.0% in patients compared with 69.9% in volunteers).
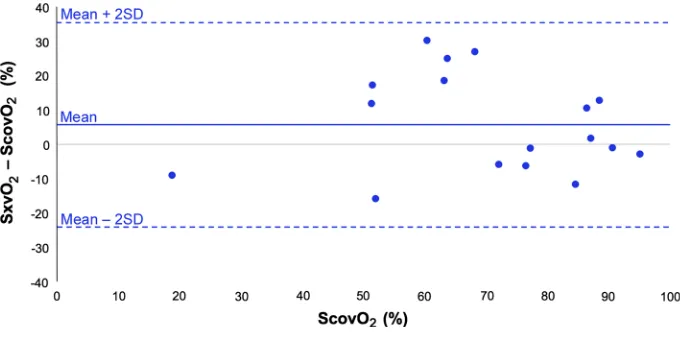
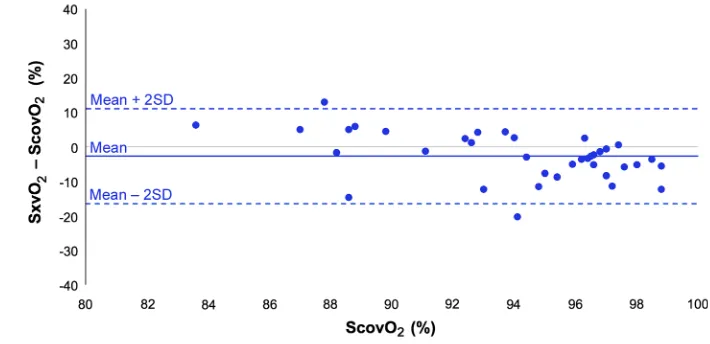
A modified Bland–Altman plot of the difference between PPG-derived peripheral venous saturation (SxvO2)
and co-oximetry samples (ScovO2) plotted against ScovO2
(Fig.7), showed considerable inter-subject variability and wide limits of agreement This variability combined with the narrow range of reference venous saturations investi-gated (83.6–98.8%) produced extremely poor correlation and a significant difference between the two methods (r=0.10, RMSE=6.19%,P\0.05).
4 Discussion
In the volunteer group, venous oxygen saturations that were significantly lower than those of arterial blood were calculated from PPG analysis in the respiratory frequency range (SxvO2), and moderate correlation was found
between these values and those obtained by co-oximetry (ScovO2). Note that a normally-breathing control group
was not included as the respiratory component of the PPG is difficult to resolve under such circumstances. The effect of the airway pressure itself was the subject of an earlier volunteer study using a similar experimental setup [23] which concluded that forced breathing caused a fall in reported arterial oxygen saturation of 1.9% compared to control measurements. SxvO2values in the anaesthetised
subjects were also found to be significantly lower than arterial saturations (SpO2), but in contrast to the volunteer
subjects, SxvO2 values were high and correlated poorly
with co-oximetry. This may be largely attributed to cuta-neous arteriovenous (AV) shunt induced by anaesthesia [24].
The circulation of the skin has a highly specialised vascular arrangement. At rest and in cool ambient tem-perature, a state of relative vasoconstriction prevails, con-trolled by the sympathetic innervation. Blood flow can be greatly increased through vasodilation, under the central control of the hypothalamus, in conditions where extensive heat transfer is required [25]. The arteries supplying the skin are located deep in the hypodermis and give rise to plexuses of anastomosing vessels. Numerous shunts
Fig. 3 Barchart showing mean (±SD) arterial oxygen saturation (from pulse oximeter) and venous oxygen saturations from co-oximetry (ScovO2)and PPG-derived (SxvO2) method recorded in
awake volunteers (n=17)
Fig. 4 Modified Bland–Altman plot showing mean difference in venous oxygen saturation between PPG-derived method (SxvO2) and reference method
(co-oximetry ScovO2) in awake
[image:6.595.52.289.57.210.2] [image:6.595.204.545.547.716.2]provide direct AV communications which play an impor-tant role in thermoregulation, and are densely innervated with sympathetic fibres [26]. In addition, the dermis in the finger tips, from which PPG is recorded, contains highly convoluted AV anastomoses known as glomus bodies, providing more direct AV mixing [27].
When thermal or pharmacological vasodilation occurs, the oxygen content of peripheral venous blood rises sig-nificantly. In previous work studying the arterialisation of venous blood in the heated hand, venous blood gas values were found to be consistently in the arterial range [28]. Intravenous anaesthetics, volatile agents and opioids, all of which were administered to the study subjects, cause impairment of the hypothalamic response to hypothermia and direct vasodilator action causing the skin to appear flushed and veins to become prominent. The extensive AV
Fig. 5 30 s sample of red and infrared photoplethysmographic signals with simultaneously recorded airway pressures, radial arterial blood pressures and peripheral venous blood pressures from one ventilated anaesthetised patient
Fig. 6 Barchart showing mean (±SD) arterial oxygen saturation (from pulse oximeter) and venous oxygen saturations (from co-oximetry and PPG-derived method) recorded in ventilated patients (n=38)
[image:7.595.82.513.55.463.2] [image:7.595.52.289.508.657.2]mixing is likely to have resulted in the high oxygen satu-rations observed in the dorsal vein blood samples (ScovO2)
in the anaesthetised subjects and may account for the poor correlation between SxvO2and ScovO2. The PPG-derived
SxvO2estimates were significantly lower than ScovO2in
this group, which suggests that arterialisation of dorsal vein blood is occurring.
A second limitation of the anaesthetised patients study was highlighted by observation of very high peripheral venous oxygen saturation values. The administration of high flow oxygen to patients prior to anaesthesia, which continued after anaesthetic induction to allow for the full action of muscle relaxants before tracheal intubation, probably results in the tissue beds being flooded with oxygen resulting in tissue hyperoxia and resulting venous hyperoxaemia. Although the fraction of inspired oxygen (FiO2) was reduced to 0.3 as soon as the airway was
secured to minimise the effect of preoxygenation, the short period of monitoring in the anaesthetic room before transfer into the operating theatre did not allow enough time for return of arterial oxygen tension to normal values. This limitation could perhaps be overcome in future studies by recording PPG during or after the surgical procedure, which would provide time for washout of excess oxygen, thus allowing for a meaningful difference in arterial and venous oxygen saturations.
In the volunteer group, room temperature was con-trolled, and although this does not eliminate individual differences in cutaneous vascular tone and AV shunting, it has been possible to obtain consistently low SxvO2 that
correlated well with the ScovO2values. There was,
how-ever, wide spread of data, which may be attributed to intersubject variability in technique of forced breathing. The calculation of SxvO2depends on the ratio of the signal
amplitude between the red and infrared peaks in the res-piratory frequency range. Inconsistent breathing technique causes the respiratory frequency to become indeterminate, causing errors in the calculated amplitudes of the
respiratory red and infrared signals at the respiratory fre-quency. This affects the ratio-of-ratios and thus the cal-culated saturations.
The finger is often chosen as a convenient monitoring site for studying PPG, and indeed for routine clinical monitoring, but it is clear from these studies and previous work that further research is needed to enhance our understanding of the behaviour of the venous and arterial compartments within the tissues of the finger and the effect of this behaviour on pulse oximetry signals. Furthermore the effect of other physiological factors such as cutaneous arteriovenous shunt and how these are affected by physical variables such as ambient temperature warrant further study.
In conclusion, these results suggest that measurement of peripheral venous oxygen saturation remains a challenge. Although there is growing interest in utilising this concept in the monitoring of regional circulations, refinement of the technique, including application of more suitable algorithms and calibration functions, are perhaps needed to sufficiently improve accuracy to produce clinically meaningful results from peripheral sites. Cutaneous arteriovenous shunt induced by anaesthesia may especially limit the use of this technique in anaesthetised patients. Application of suit-able PPG sensors [15] to the splanchnic circulation however, where AV anastomoses do not interfere with blood flow, could provide valuable clinical tools for assessment of oxygen uptake and metabolic status of vital organs.
Compliance with ethical standards
Conflict of interest The authors declare that they have no conflict of interest.
Open Access This article is distributed under the terms of the Creative Commons Attribution 4.0 International License (http://crea tivecommons.org/licenses/by/4.0/), which permits unrestricted use, distribution, and reproduction in any medium, provided you give appropriate credit to the original author(s) and the source, provide a Fig. 7 Modified Bland–Altman
plot showing mean difference in venous oxygen saturation between PPG-derived method (SxvO2) and reference method
(co-oximetry ScovO2) in
[image:8.595.190.545.57.229.2]link to the Creative Commons license, and indicate if changes were made.
References
1. Allen J. Photoplethysmography and its application in clinical physiological measurement. Physiol Meas. 2007;28:R1–39. 2. Moyle JTB. Pulse oximetry. 2nd ed. London: BMJ; 2002. 3. Stock MC, Ryan ME. Oxygen consumption calculated from the
Fick equation has limited utility. Crit Care Med. 1996;24:86–90. 4. Echiadis AS, Crabtree VP, Bence J, Hadjinikolaou L, Alexiou C, Spyt TJ, Hu S. Non-invasive measurement of peripheral venous oxygen saturation using a new venous oximetry method:
evalu-ation during bypass in heart surgery. Physiol Meas.
2007;28:897–911.
5. Wiener RS, Welch HG. Trends in the use of the pulmonary artery catheter in the United States, 1993–2004. J Am Med Assoc. 2007;298:423–9.
6. Harvey S, Harrison DA, Singer M, Ashcroft J, Jones CM, Elbourne D, Brampton W, Williams D, Young D, Rowan K. Assessment of the clinical effectiveness of pulmonary artery catheters in management of patients in intensive care (PAC-Man): a randomised controlled trial. Lancet. 2005;366:472–7. 7. Phillips JP, Belhaj A, Shafqat K, Langford RM, Shelley KH,
Kyriacou PA. Modulation of finger photoplethysmographic traces during forced respiration: venous blood in motion? In: Confer-ence proceedings of the IEEE engineering in medicine and biology society; 2012. p. 3644–7.
8. Nilsson L, Johansson A, Kalman S. Respiratory variations in the reflection mode photoplethysmographic signal. Relationships to
peripheral venous pressure. Med Biol Eng Comput.
2003;41:249–54.
9. Phillips JP, Belhaj A, Langford RM, Kyriacou PA. Effect of respiratory-induced intensity variations on finger SpO2
mea-surements in volunteers. In: Conference proceedings of the IEEE engineering in medicine and biology society; 2013. p. 3937–40. 10. Shelley KH. Photoplethysmography: beyond the calculation of arterial oxygen saturation and heart rate. Anesth Analg. 2007;105:S31–6.
11. Dorlas JC, Nijboer JA. Photo-electric plethysmography as a monitoring device in anaesthesia: application and interpretation. Br J Anaesth. 1985;57:524–30.
12. Partridge BL. Use of pulse oximetry as a noninvasive indicator of intravascular volume status. J Clin Monit. 1987;3:263–8. 13. Cannesson M, Attof Y, Rosamel P, Desebbe O, Joseph P, Metton
O, Bastien O, Lehot JJ. Respiratory variations in pulse oximetry
plethysmographic waveform amplitude to predict fluid
responsiveness in the operating room. Anesthesiology.
2007;106:1105–11.
14. Gesquiere MJ, Awad AA, Silverman DG, Stout RG, Jablonka DH, Silverman TJ, Shelley KH. Impact of withdrawal of 450 ml of blood on respiration-induced oscillations of the ear plethys-mographic waveform. J Clin Monit Comput. 2007;21:277–82. 15. Phillips JP, Kyriacou PA, Jones DP, Shelley KH, Langford RM.
Pulse oximetry and photoplethysmographic waveform analysis of
the esophagus and bowel. Curr Opin Anesthesiol.
2008;21:779–83.
16. Walton ZD, Kyriacou PA, Silverman DG, Shelley KH. Measur-ing venous oxygenation usMeasur-ing the photoplethysmograph wave-form. J Clin Monit Comput. 2010;24:295–303.
17. Thiele RH, Tucker-Schwartz JM, Lu Y, Gillies GT, Durieux ME. Transcutaneous regional venous oximetry: a feasibility study. Anesth Analg. 2011;112:1353–7.
18. Shapiro BA, Peruzzi WT, Kozelowski-Templin R. Clinical application of blood gases. 5th ed. St. Louis: Mosby-Year Book; 1994.
19. Webster JG. Design of pulse oximeters. Bristol: IoP Publishing; 1997.
20. Rusch TL, Sankar R, Scharf JE. Signal processing methods for pulse oximetry. Comput Biol Med. 1996;26:143–59.
21. Grubbs FE. Procedures for detecting outlying observations in samples. Technometrics. 1969;11:1–21.
22. Krouwer JS. Why Bland–Altman plots should use X, not
(Y?X)/2 when X is a reference method. Stat Methods.
2008;27:778–80.
23. Phillips JP, Belhaj AM, Langford RM, Kyriacou PA, Effect of respiratory-induced intensity variations on finger SpO2
mea-surements in volunteers. In: Conference proceedings of the IEEE engineering in medicine and biology society; 2013. p. 3937–40. 24. Kim JM, et al. Pulse oximetry and circulatory kinetics associated
with pulse volume amplitude measured by photoelectric
plethysmography. Anesth Analg. 1986;65:1333–9.
25. Rhoades R, Bell DR. Medical physiology: principles for clinical medicine. 4th ed. London: Wolters Kluwer/Lippincott Williams and Wilkins; 2013.
26. Boron WF, Boulpaep EL. Medical physiology: a cellular and molecular approach. 2nd ed. Philadelphia: Saunders/Elsevier; 2012.
27. Young B, Heath JW, Burkitt HG, Wheater PR. Wheater’s func-tional histology: a text and colour atlas. 4th ed. New York: Churchill Livingstone; 2000.
28. Zello GA, Smith JM, Pencharz PB, Ball RO. Development of a heating device for sampling arterialised venous blood from a hand vein. Ann Clin Biochem. 1990;27:366–72.
![The Intracellular pH of a Molluscan Smooth Muscle During a Contraction Catch Relaxation Cycle Estimated by the Distribution of [14C]DMO and by 31P NMR Spectroscopy](data:image/gif;base64,R0lGODlhAQABAIAAAP///wAAACH5BAEAAAAALAAAAAABAAEAAAICRAEAOw==)