Data revisions in the EBT
database
♦ » • • • o · · · · * · · ·
Gunter Schäfer
S t a t i s t i c s
in focus
INDUSTRY, TRADE
AND SERVICES
THEME 4 - 20/2000
Contents
Dissemination standards as
reported to the IMF 2
Observed practises 3
Differences in the number of revisions between indicators...4
Size of revisions by indicator ..4
Size of revisions subject to NACE Rev. 1 levels of
aggregation 5
Similarities between the eleven
extractions 6
Conclusions 6
Information about macro-economic and business cycle indicators is collected and processed by many statistical agencies. With financial markets, banks and businesses demanding more up-to-date information, there is an onus on statistics to be released as quickly as possible. This usually results in provisional data being published in the form of rapid, aggregated indicators. These data may then be subsequently revised (perhaps more than once) until they are considered "final"1.
Users of statistics are generally aware of the trade-off that exists between using rapid (provisional) data that is often based on a smaller sample population or lower response rate and more accurate and detailed data that may only be available following lengthy delays.
The reliability of provisional data is of great importance within the modern-day economy, as announcements on the money supply, unemployment, price inflation or industrial production have large effects on the expectations and investment decisions of financial markets and businesses as well as consumers It is unrealistic to assume that data compiled from actual observations can be provided with no delay. However, it is important that data is released as quickly as possible and that decision makers have confidence in their data sources, so they may base decisions on figures that are unlikely to be revised substantially in the future.
This paper takes data released in the 11 issues of the Monthly Panorama of European Business published in 1999 and analyses the size and frequency of the revisions over the course of a calendar year, comparing data points from 11 extractions taken from the EBT database.
This paper does not attempt to explain the reasons behind the revisions that are observed in this study. However, some of the main causes are increased response rates, benchmarking to less frequent surveys with larger sample sizes, corrections of errors during data collection/processing, or of errors in transmission of national data to Eurostat. For European totals the main causes are revisions following the reception of new or revised data within Eurostat, revisions of weighting systems or corrections of compilation errors.
Manuscript completed on: 04.10.2000 ISSN 1561-4840
Catalogue number: CA-NP-OO-020-EN-C ' The use of the word "final" is employed, although often data is never actually frozen with a
Dissemination standards as reported to the IMF
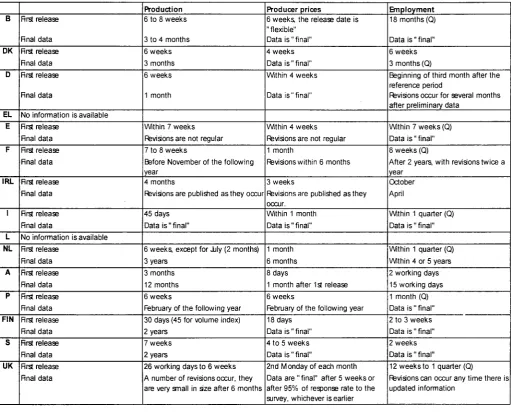
The information in table 1 isavailable from International Monetary Fund. It may be found in the Special Data Dissemination Standard (SDDS), which was established by the IMF to guide members that have, or might seek, access to international capital markets in the provision of their economic and financial data to the public. This SDDS information is not inherently linked to that provided within the framework of the STS Regulation. Rather, it is provided as
an indication of EU Member State practices.
From table 1 it can be seen that most revisions occur within a few months of the initial release of data. This time lag appears to be longer for the production index, with delays in the publication of "final" figures ranging from 0 (Italian data, which should not be subject to any revision) to two years for Finland and Sweden.
Eight Member States declare that they release "final" data for the producer price index within one month of the first publication date (six do not revise their producer price index at all).
Seven EU Member States declare that they release their "final" data for the employment index within 15 working days of the initial publication date (six do not revise their figures at all).
Β
DK
D
EL E
F
IRL
I
L
NL
A
Ρ
FIN
S
UK
first release
final data first release final data first release
Final data
No Information Is available First release
Final data first release final data
first release final data
first release final data
No information is available first release
final data firet release final data first release final data first release Final data First release final data First release Final data
Production 6 to 8 weeks
3 to 4 months 6 weeks 3 months 6 weeks
1 month
Within 7 weeks Ffevisions are not regular 7 to 8 weeks
Before November of the following year
4 months
Fèvisions are published as they occur
45 days Data is " final"
6 weeks, except for July (2 months) 3 years
3 months 12 months 6 weeks
February of the following year 30 days (45 for volume index) 2 years
7 weeks 2 years
26 working days to 6 weeks A number of revisions occur, they are very small in size after 6 months
Producer prices
6 weeks the release date is " flexible"
Data is "final" 4 weeks Data is " final" Within 4 weeks
Data is "final"
Within 4 weeks Ffevisions are not regular 1 month
Ffevisions within 6 months
3 weeks
Ffevisions are published as they occur.
Within 1 month Data is " final"
1 month 6 months 8 days
1 month after 1st release 6 weeks
February of the following year 18 days
Data is " final" 4 to 5 weeks Data is " final"
2nd Monday of each month Data are " final" after 5 weeks or after 95% of response rate to the survey, whichever is earlier
Employment
18 months (Q)
Data is " final" 6 weeks 3 months (Q)
Beginning of third month after the reference period
Ffevisions occur for several months after preliminary data
Within 7 weeks (Q) Data is " final" 6 weeks (Q)
After 2 years, with revisions twice a year
October April
Within 1 quarter (Q) Data is "final"
Within 1 quarter (Q) Within 4 or 5 years 2 working days 15 working days 1 month (Q) Data is "final" 2 to 3 weeks Data is "final" 2 weeks Data is " final"
12 weeks to 1 quarter (Q)
[image:2.595.46.558.281.693.2]Revisions can occur any time there is updated information
Table 1: Member States reported practise
Source: International Monetary Fund (SDDS)
Statistics in focus — Theme 4 — 20/2000 ■
Observed practises
Information collected from the 15 EU Member States within the context of the STS Regulation includes monthly indices for production, producer (output) prices and employment. These indices form the basis of this study. Table 2 shows empirical observations and describes the revisions observed in the 11 extractions made from the EBT database during 1999.
In practise, the figures tend to become stable shortly after their initial release date, most of them within 1 to 6 months. Nevertheless, it is important to note that a number of "shocks" occur in almost all Member States. By "shock" the reader should understand a complete revision of all the figures for the last 4 or 5 years. This can be observed with different degrees of
intensity depending upon which of the three indices is analysed and which of the 15 Member States is considered. The data revisions recorded in 1999 show that the changes in data for the different Member States follow similar patterns, whilst the main differences are seen between the three different indices.
EU-15
Β
DK
D
EL
E
F
IRL I
L
NL
A
Ρ
RN
s
UK
Production
Ftevision of several data points in all the extractions
Last 3 or 4 values revised nearly every month (except 4-5-6/99). A complete revision in 7/99. Last 1-2 values updated almost every month. Complete revision in 5/99, mini " shocks" every 3 months (3-6-9-12/99).
3-4-7-9-11-12/99: revisions of the last few values. 5 and 11/99: revisions of a large part of the series
Only the last data point was revised on a frequent basis. In 4/99 there was a revision of all the 1998 figures.
Ftevision of the last 1-3 figures almost every month. Complete revision in 5/99.
Ftevision of the last figure almost every month. Larger revisions every 3 months
Never revised.
Only one complete update of the series in 4/99. Last 2 to 5 values revised in 2 and 12/99. A complete revision in 10/99.
Ftevision of the last few figures almost every month. Larger revisions in 6 and 12/99. Only one large revision in 10/99.
Monthly revisions of the last 1-3 data points. One complete revision in 5/99.
Very small adjustments for up to 2 years of data occurred several times
Monthly revisions of the last 1-3 data pointa One complete revision in 4/99.
Frequent revisions of the last few values 2 larger revisions in 7 and 9/99.
Producer prices
Two complete update of the series in 2 and 4/99 Never revised.
Only one complete update of the series in 5/99. Only one complete update of the series in 4/99. Only one complete update of the series in 9/99. Never revised.
Never revised. Never revised. Never revised.
Only one complete update of the series in 10/99. Occasional revisions of the last 1-2 figures A larger revision in 6/99.
No data available.
A minor revision of the last data point occurred twice in the year.
Never revised. Never revised.
Last data point revised almost every month.
Employment
Small revisions in 5 and 9/99. Complete revisions in 2-3-4/99.
3 "shocks" in 3-4 and 9/99.
Data is produced quarterly. Every 3 months there is a revision of the last 2 quarters
Never revised.
Every 2 months there is a revision of the last 3-6 data points
Twice in the year (4-9/99) there was a revision of the last 3 values
Occasionally the last 1-2 data points revised. Two "shocks" during the year (4 and 10/99). Last 9 data points revised in 6/99.
2 adjustments of the whole series in 4/99 and 5/99. All modifications made in 4 were removed in 5, possibly there was an error.
Only one complete update of the series in 10/99. Quarterly revisions of the last 1-3 values 2 revisions of a large number of values in 3 and 10/99.
Monthly adjustments of the last data point. One large revision occurred in 3/99.
Quarterly adjustments of the last 6 months of data.
Quarterly adjustments of the last 1-4 months of data.
3 revisions of last 2-3 values and one complete revis'on in 2/99.
Table 2: Observed revisions by indicator in the 15 Member States and the EU aggregate
Differences in the number of revisions between indicators
The production index was revised on a regular basis in all the Member States, except Luxembourg, where the values changed in only 3 of the 11 extractions, Austria where the values changed once and Ireland where there were no revisions. In all other Member States, virtually every extraction showed changes in the figures for the production index. Most revisions affected only the data for the last 3 or 4 available months, whilst for the majority of Member States there were 1 to 3 complete revisions during the year. As a result, the production index for the EU total was revised in 10 out of the 11 extractions.
The producer price index did not have any revisions in 7 of the
Member States considered (B, E, F, IRL, I, FIN and S). Unlike the production index, "shocks" were observed in the data from just 5 of the countries (DK, D, EL, L and NL). In the Netherlands there were 4 more revisions, which affected only the data for the last month or two available. In Portugal revisions were seen in 2 more of the extractions, whilst in the United Kingdom revisions occurred in 7 more of the extractions. In all of these cases the only values updated were for the indices of the latest month reported in the previous extraction. The producer price index for the EU was revised 4 times during the year. Two of those revisions affected the whole series (the first one, observed in February being the most important,
with average variations of -7.5%), whilst the other two were minor revisions of the latest available data.
Most of the revisions observed for the employment index affected the data for just the last few months available (a period of 1 to 9 months). Only in a few cases did the revisions apply to the whole series (or to the majority of it), for example, Belgium (all), France (3/99 and 9/99), Austria (all), Portugal (3/99) and the United Kingdom (2/99). In the majority of cases the employment index was provided on a quarterly basis, thus explaining why in certain cases the adjustments occurred on a 3-monthly basis. The employment index for the EU was revised 5 times during the year.
Size of revisions by indicator
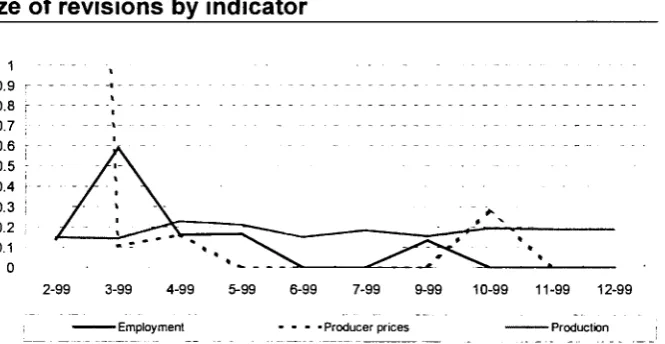
When observing the revisions to the different indices it would be of interest to know if the changes have a different amplitude for different indices. It is not easy to give a definite answer to this question, because the situation observed varies greatly between Member States. In order to help summarise the situation some averages were calculated to show the behaviour of the three indices in the EU for total industry. Figure 1 shows the average absolute variation recorded for the 10 consecutive extractions2
compared to the first extraction.
In general it is possible to observe that the production index is revised more often than the other two indices, and that revisions are in most cases larger in size. Nevertheless, in March 1999 there were some fairly large adjustments to the producer price index (7.64 points) and the employment index (0.59 points).
I 0.9 ■■
[image:4.595.233.566.348.520.2]0.8 ; 0.7 . 0.6 ; 0.5 : 0.4 t 0.3 | n? 0.1 0
1 ---_ .
-- - ■ - -
-2-99 "t
|
\
-■
Æ '~ \ 1 \
3-99 4-99 * *
5-99 - ■
-^*^. '
6-99 7-99 9-99
- - - - Producer prices
1 *
- - - »
10-99 11-99 12-99
Figure 1: Average absolute variations (calculated as percentage points) observed in 10 data extractions for EU-15, total industry during 1999, compared to the
January extraction. Index compiled with 1995 = 100
* The values shown on the y-axis are the average absolute variations of a given indicator between two consecutive extractions. The average is calculated on the data points which are common to the two extractions. The axis has been cut at 1, causing the variation of the producer price index value for the 3/99 data set (7.64) to go off the scale.
Source: EBT
2 For the purposes of this study the January
extraction is considered as the initial release is no extraction in of the data and there
August.
Statistics in focus — Theme 4 — 20/2000 ■
m
Size of revisions subject to NACE Rev. 1 levels of aggregation
NACE Rev. 1
Total industry Intermediate goods Capital goods Durable consumer goods Non-durable consumer goods
Mining of coal and lignite; extraction of peat (NACE Rev. 1 10) Extraction of crude petroleum and natural gas (NACE Rev. 111) Mining of uranium and thorium ores (NACE Rev. 112) Manufacture of food products and beverages (NACE Rev. 115) Manufacture of tobacco products (NACE Rev. 1 16)
Manufacture of textiles (NACE Rev. 1 17)
Manufacture of wearing apparel; dressing and dyeing of fur (NACE Rev. 1 18)
Tanning and dressing of leather manufacture of luggage, handbags etc and footwear (NACE Rev. 1 19) Manufacture of wood and products of wood and cork, etc (NACE Räv. 1 20)
Manufacture of pulp, paper and paper products (NACE Rev. 1 21) Publishing, printing and reproduction of recorded media (NACE Rev. 1 22) Manufacture of coke, refined petroleum products and nuclear fuel (NACE Rev. 1 23) Manufacture of chemicals and chemical products (NACE Rev. 1 24)
Manufacture of rubber and plastic products (NACE Rev. 1 25) Manufacture of other non-metallic mineral products (NACE Rev. 1 26) Manufacture of basic metals (NACE Rev. 1 27)
Manufacture of fabricated metal products except machinery and equipment (NACE Rev. 1 28) Manufacture of machinery and equipment n.e.c (NACE Räv. 1 29)
Manufacture of office machinery and computers (NACE Rev. 1 30) Manufacture of electrical machinery and apparatus n.e.c. (NACE Rav. 1 31)
Manufacture of radio, television and communication equipment and apparatus (NACE Räv. 1 32) Manufacture of medical, precision and optical instruments watches and clocks (NACE Rav. 1 33) Manufacture of motor vehicles, trailers and semi-trailers (NACE Rev 1 34)
Manufacture of other transport equipment (NACE Rev. 1 35) Manufacture of furniture, manufacturing n.ec. (NACE Rev. 1 36) Bectricity, gas steam and hot water supply (NACE Rev. 1 40) Average for the 2-digit headings (Divisions) of NACE Räv. 1 listed above
[image:5.595.30.552.56.438.2]Production Average revision 0.2 0.1 0.3 0.3 0.2 0.3 0.0 NA 0.2 0.5 0.2 0.4 0.8 0.4 0.2 0.3 0.3 0.5 0.3 0.3 0.8 0.3 0.3 1.5 0.5 0.7 0.4 0.4 0.8 0.3 0.2 0.4 Average revision / standard deviation 1.3 1.2 1.1 0.6 1.4 0.6 NA NA 1.3 0.8 0.7 0.7 0.7 1.4 0.6 1.3 1.1 1.1 1.2 1.1 0.6 1.0 0.8 1.3 0.5 0.8 1.0 0.5 0.7 0.9 1.2 0.6 Producer Average revision 0 9 0.9 1.6 0.0 0.9 14.6 NA NA 2.8 2.2 2.9 0.5 0.5 3.6 1.0 0.1 0.0 0.5 0.7 1.2 2.0 2.9 1.4 0.6 2.4 6.3 0.2 1.0 0.1 2.1 0.2 2.1 prices Average revision / standard deviation 0.3 0.3 0.3 0.5 0.3 0.4 NA NA 0.3 0.3 0.3 0.4 0.3 0.3 0.3 0.4 0.7 0.4 0.3 0.3 0.3 0.3 0.3 0.6 0.3 0.3 0.4 0.3 0.7 0.3 0.4 0.3 Employment Average Average revision / standard revision deviation 0.0 0.1 0.1 0.2 0.1 0.1 0.9 0.0 0.2 0.4 0.1 0.1 0.0 0.1 0.1 0.1 0.7 0.0 0.2 0.1 0.4 0.1 0.1 0.5 0.2 0.3 0.2 0.1 0.3 0.1 0.2 0.2 0.8 0.7 0.7 0.7 1.0 0.5 0.4 NA 0.8 0.8 0.9 0.8 NA 0.8 0.6 0.6 0.7 0.7 0.8 0.7 0.5 0.5 0.6 0.8 0.7 0.8 0.6 0.6 0.6 0.8 0.6 0.3
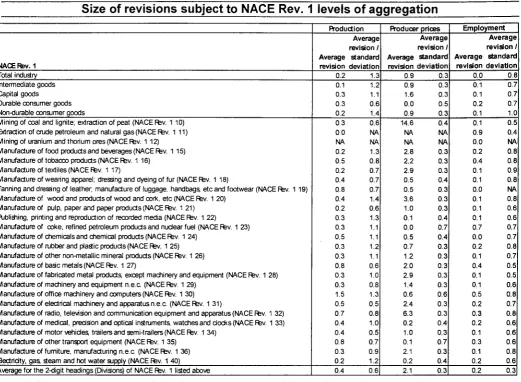
Table 3: Average revisions (calculated as percentage points) of data for the period 9/98, observed in 10 extractions compared to the January extraction, index compiled with 1995=100*
* It should be noted that the three indices presented have a different pattern of development. The production index tends to fluctuate (from one month to the next) with far more amplitude than either the producer price index or the employment index (both of which are relatively stable). For this reason for each series the average revision is also expressed as a share of the standard deviation of all revisions.
Source: EBT
The following analysis looks at whether the revisions to indices referring to broader activity aggregates have a different nature to the revisions observed for more detailed breakdowns. Table 3 shows the average revisions calculated on the 11 extractions from the EBT database using the first (January) as the reference value. The sample data refer to the EU-15 aggregate for 9/98.
Revisions are calculated as the absolute difference between the values of a given index for a given month in two consecutive extractions. Given that positive and
negative revisions will cancel out, the mean revision does not provide a complete picture of the magnitude of the changes to the data, hence the choice of analysing absolute variations.
The values reported in the table are the average of all the revisions observed for the same data point throughout 1999. This values gives a rough indication of the variability observed across the different releases of the data. Lower values indicate lower absolute changes in the figures. It is important to note that higher values do not necessarily indicate large difference between
the values observed at the beginning and at the end of the year, but rather that one or more large revision has occurred during the calendar year.
the indices for very detailed activities are less stable than the estimates for more aggregated data. The average revisions observed for the three indices for total industry were systematically lower than the average revisions at the detailed level of breakdown of activities.
For the production index, an average variation of 0.15 for total industry was recorded, with the main industrial groupings between 0.14 for intermediate goods and 0.33 for consumer durables. At the 2-digit level of NACE Rev. 1 there was an average of 0.44, with values up to 1.54 for NACE Rev. 1 Division 30.
Changes in the producer price index were more significant, especially for more detailed activity breakdowns, where an average variation higher than 1 was observed in 13 of the 26 activities, with a maximum of 14.6 for NACE Rev. 1 Division 10. This value was the result of a major correction applied to the EU-15 estimates during February 1999, and another important (but lower) revision applied in June of the same year. The average variation for total industry, on the other hand, was only 0.85.
The employment index showed much smaller absolute variations over the period under examination, with an average of 0.04 for total industry and a mean value of 0.22 for the 26 NACE Rev. 1 Divisions.
that a major revision has occurred, which could affect the reliability of any analysis that has been based on the previous release of the data.
In order to analyse the similarities between the series extracted an OLS regression3 was performed on
the 11 extractions of the production index in the EU for total industry. All data points common to all the extractions were used, in other words, series from August 1995 to October 1998 (39 months).
When applied to the production index for EU-15 for total industry this type of OLS analysis shows that no major shocks occurred in the series. This is the same as saying that the corrections to the data published at different stages during 1999 did not significantly alter the reliability of the figures published at the beginning of the same year. The results are less satisfactory when a similar analysis is carried out at a more disaggregated level of detail. In this case the results of the regressions seem to indicate that some shocks have occurred, rendering the previously published data less reliable. Whilst some Member States revise their data on a regular basis (following a review calendar similar to that shown in table 1), there are many other causes of revisions. As such the majority of revisions are not regular or systematic.
Conclusions
This paper has conducted an exploratory investigation of the nature and extent of revisions to European short-term statistics contained in the EBT database. The main results of the investigation can be summarised as follows:
1) The production index is revised more often than the employment index or the producer price index.
2) The EU-15 estimates are revised on a frequent basis because the revisions of the Member States are spread over the whole calendar year.
3) There are revisions in the data sets that users should be aware of, either due to "shocks" or to the standard practise of updating figures that is employed within the Member States.
4) The revisions observed are less significant at higher levels of aggregation within the classification of economic activities.
Similarities between the eleven extractions
Frequent revisions can occur without altering significantly the reliability of the series presented. By saying that two series are similar we mean that the differences in the figures caused by revisions are not statistically significant. In this respect the revision can be seen as a fine adjustment, rather than a major re-release of new values. On the other hand, when we say that two series are not similar, it means
1 The regression was of the form: (PROD)
Rev¡ = α + β (PROD) RevM where i runs
from 1 to 10, and Rev0 is the first extraction
of the data in January 1999. If the early releases of figures are unbiased predictors of the subsequent revisions, then it must be that a=0and β=1.
Statistics in focus — Theme 4 — 20/2000 ■
m
> ESSENTIAL INFORMATION - METHODOLOGICAL NOTES
Each month, during calendar year 1999, the latest available monthly indices were extracted from the Monthly Panorama of European Business data files (source: EBT). In most cases 50 monthly figures were generally available per indicator.
The sample data examined included three monthly indices for a set of industrial activities, notably a production index (working day adjusted), a producer price index (gross) and an employment index (gross).
The index of production aims to measure changes in the volume of
the gross value added created by industry, the indices for each activity being aggregated by means of a system of weighting according to gross value added at factor cost in base year 1995. The indices are adjusted to take account of the varying number of working days in the month.
The index of producer prices aims to show the changes in the ex-works selling prices of all products sold on domestic markets, excluding VAT and similar deductible taxes. The EU indices refer to overall weighted price changes. There are not yet indices for Austria. No seasonal
adjustment is carried out on these indices.
The employment index shows the development of the number of persons employed. The latter is defined as the total number of persons who work in the observation unit (inclusive of working proprietors, partners working regularly in the unit and unpaid family workers), as well as persons who work outside the unit who belong to it and are paid by it (e.g. sales representatives, delivery personnel, repair and maintenance teams).
Further information:
Reference publications
Title Monthly Panorama of European Business - Annual subscription
Catalogue No KS-AM-OO-OOO-EN-C Price EUR 162
Databases
New Cronos Theme 4
Domain EBT (European Business Trends)
To obtain information or to order publications, databases and special sets of data, please contact the Data Shop network:
B E L G I Q U E / B E L G I È D A N M A R K D E U T S C H L A N D E S P A N A F R A N C E I T A L I A - R o m a Eurostat Data Shop
Bruxolles/Brussel Planistat Belgique 124 Rue du Commerce Handelsstraat 124 B-1000 BRUXELLES / BRUSSEL Tel. (32-2) 234 67 50 Fax (32-2) 234 67 51 E-Mail: datashop@planistatbe
DANMARKS STATISTIK Bibliotek og Information Eurostat Data Shop Sejrøgade 11 DK-2100 KØBENHAVN 0 Tel. (45-39)17 3030 Fax (45-39) 17 30 03 E-Mail: bib@dstdk
STATISTISCHES BUNDESAMT Eurostat Data Shop Berlin Otto-Braun-Strade 70-72 (Eingang: Kari-Marx-Allee) D-10178 BERLIN Tel. (491-18 88 6 44 94 27/28 Fax (491-18 88-6 44 94 30 E-Mail:
INE Eurostat Data Shop Paseo de la Castellana, 183 Oficina 009
Entrada por Estèbanez Calderón E-28046 MADRID Tel. (34-91) 583 91 67 Fax (34-91) 579 71 20 E-Mail: [email protected]
INSEE Info Service Eurostat Data Shop 195, rue de Bercy Tour Gamma A F-75582 PARIS CEDEX 12 Tel. (33-1) 53 17 88 44 Fax (33-1) 53 17 88 22 E-Mail: [email protected]
ISTAT
Centro di Informazione Statistica Sede di Roma, Eurostat Data Shop Via Cesare Balbo. 11a 1-00184 ROMA Tel. (39-06) 46 73 31 02/06 Fax (39-06) 46 73 31 01/07 E-Mail: [email protected]
I T A L I A - Milano L U X E M B O U R G N E D E R L A N D N O R G E P O R T U G A L S C H W E I Z / S U I S S B S V I Z Z E R A ISTAT
Ufficio Regionale per la Lombardia Eurostat Dita Shop
via Feno 3 1-20123 MILANO Tel. (39-02) 8061 32460 Fax (39-02) 8061 32304 E-mail: [email protected]
Eurostat Data Shop Luxembourg BP453
L-2014 LUXEMBOURG 4. rue A Weicker L-2721 LUXEMBOURG Tel.(352)43 35 22 51 Fax (352) 43 35 22 221 E-Mail: [email protected]
STATISTICS NETHERLANDS Eurostat Data Shop-Voorburg pò box 4000
2270 JM VOORBURG Nederland Tel. (31-70) 337 49 00 Fax (31-70) 337 59 84 E-Mail: [email protected]
Statistics Norway Library and Information Centre Eurostat Data Shop Kongens gate 6 P. b. 8131, dep. N-0033OSLO Tel. (47-22) 86 46 43 Fax (47-22) 86 45 04 E-Mail: [email protected]
Eurostat Data Shop Lisboa INE/Serviço de Difusão Av. Antonio José de Almeida. 2 P-1000-043 LISBOA Tel. (351-21)842 6100 Fax (351-21) 842 63 64 E-Mail: [email protected]
Statistisches Amt des Kantons Zürich, Eurostat Data Shop Bleicherweg 5 CH-8090 Zürich Tel. (41-1)225 1212 Fax (41-1) 225 12 99 E-Mail: [email protected] Internetadresse: http://www.zh.ch/statjstik
S U O M I / F I N L A N D S V E R I G E U N I T E D K I N G D O M U N I T E D K I N G D O M U N I T E D S T A T E S O F A M E R I C A Eurostat Data Shop Helsinki
Tilasto kirjasto Postiosoite: PL 2B
Käyntiosoite: Tybpajakatu 13 B, 2 krs Fl N-00022 Tilastokeskus Tel. (358-9)17 34 22 21 Fax (358-9) 17 34 22 79
S-posu datashcp ti!astokesku5@t]lastofceskus Ii Internetadresse
http Jhrtn blastokeskus fi/tk/Ut/datashcp hurt
STATISTICS SWEDEN Information service Eurostat Data Shop Karlavägen 100-Box 24 300 S-104 51 STOCKHOLM Tel. (46-8) 50 69 48 01 Fax ( 4 M ) 50 69 48 99 E-Mail: [email protected] URL: htrp://www.scb.se/info/datashop/ eudatashop.asp
Eurostat Data Shop Enquiries & advice and publications
Office for National Statistics Customers & Electronic Services Unit 1 Drummond Gate-B1/05 UK-LONDON SW1V 2QQ Tel. (44-2071533 56 76 Fax (44-1633) 812 762 E-Mail [email protected]
Eurostat Data Shop Electronic Data Extractions, Enquiries & advice · R.CADE Unit 1L Mountjoy Research Centre University of Durham UK-DURHAM DH13SW Tel: (44-191) 374 7350 Fax: (44-191) 384 4971 E-Mail: [email protected] URL: httpJ/www-rcade.dur ac uk
HAVER ANALYTICS Eurostat Data Shop 60 East 42nd Streel Suite 3310
USA-NEW YORK, NY 10165 Tel. (1-212) 986 93 00 Fax (1-212) 986 69 81 E-Mail: [email protected]
Media Support Eurostat (for professional journalists only).
Bech Building Office A3/48 ■ L-2920 Luxembourg · Tel. (352) 4301 33408 · Fax (352) 430! 32649 · e-mail: [email protected]
For information on methodology
Gunter Schäfer, Eurostat/D3, L-2920 Luxembourg, Tel. (352) 4301 33566, Fax (352) 4301 34359, E-mail: [email protected] ORIGINAL: English
Please visit our web site at www.europa.eu.int/comm/eurostat/ for further information!
A list of worldwide sales outlets is available at the Office for Official Publications of the European Communities.
2 rue Mercier - L-2985 Luxembourg Tel. (352) 2929 42118 Fax (352) 2929 42709 Internet Address http://eur-op.eu.intrfr/general/s.ad.htm e-mail: [email protected]
BELGIQUEÆELGIE - DANMARK - DEUTSCHLAND - GREECE/ELLADA - ESPANA - FRANCE - IRELAND - ITALIA - LUXEMBOURG - NEDERLAND - OSTERREICH PORTUGAL - SUOMI/FINLAND - SVERIGE - UNITED KINGDOM - ¡SLAND - NORGE - SCHWEIZ/SUISSE/SVIZZERA - BALGARIJA - CESKÀ REPUBLIKA - CYPRUS EESTI - HRVATSKA - MAGYARORSZÀG - MALTA - POLSKA - ROMANIA - RUSSIA - SLOVAKIA - SLOVENIA - TÜRKIYE - AUSTRALIA - CANADA - EGYPT - INDIA ISRAËL - JAPAN - MALAYSIA - PHILIPPINES - SOUTH KOREA - THAILAND - UNITED STATES OF AMERICA
Order form
I would like to subscribe to Statistics in focus (from 1.1.2000 to 31.12.2000): (for the Data Shop and sales office addresses see above)
Π Formula 1 : All 9 themes (approximately 140 issues) Π Paper: EUR 360
Π PDF: EUR 264 □ Paper + PDF: EUR 432
Language required: □ DE Π EN □ FR
□ Formula 2: One or more of the following seven themes: □ Theme 1 'General statistics'
Π Paper: EUR 42 □ PDF: EUR 30 □ Combined: EUR 54 □ Theme 2 'Economy and finance'
□ Theme 3 'Population and social conditions' □ Theme 4 'Industry, trade and services □ Theme 5 'Agriculture and fisheries'
Π Theme 6 'External trade'
□ Theme 8 'Environment and energy
O Paper: EUR 84 □ PDF: EUR 60 Π Combined: EUR 114 Language required: □ DE D EN D FR
Ώ
ü
-Κ-·
Please send me a free copy of 'Eurostat Mini-Guide' (catalogue containing a selection of Eurostat products and services) Language required: □ DE □ EN Π FR
I would like a free subscription to 'Statistical References', the information letter on Eurostat products and services
Language required: Π DE □ EN □ FR
D Ms
D Mr □ Mrs
(Please use block capitals)
Surname: Company: Function
Forename: Department:
Address: Post code: Country: Tel: E-mail:
Town:
Fax:
Payment on receipt of invoice, preferably by:
□ Bank transfer D Visa □ Eurocard
Card No: Expires on:
Please confirm your intra-Community VAT number:
If no number is entered, VAT will be automatically applied. Subsequent reimbursement will not be possible.