www.esri.ie
Working Paper No. 234
March 2008
Managing Capital Flows:
Experiences from Central and Eastern Europe
Jürgen von Hagen
aand Iulia Siedschlag
bSubsequently published as: Von Hagen, J., Siedschlag, I., “Managing Capital Flows: Experiences from Central and Eastern Europe”, in Masahiro Kawai and Mario B. Lamberte (eds.) Managing Capital Flows in Asia: Search for a Framework, Cheltenham and Northampton, MA: Edward Elgar, 2010, pp.192-213.
Abstract: The countries of Central and Eastern Europe went from being largely closed to being largely open to international capital flows. This paper discusses their experience with capital account liberalization and coping with large capital inflows. We start with a discussion of basic economic characteristics and the real convergence achieved so far, and then discuss the pace and sequencing of capital account liberalization and the degree of international financial integration over the past decade. We then analyze trends and patterns of capital inflows in these countries in recent years. These stylized facts are useful for understanding the macroeconomic implications and policy challenges of coping with large capital inflows, which we discuss next. Finally we conclude with policy implications for emerging Asian economies.
Key Words: International financial integration, Macroeconomic policy,
Central and Eastern Europe, Emerging Asian economies
JEL Classification: E44, F36, F41
Corresponding Author: iulia.siedschlag@esri.ie
ESRI working papers represent un-refereed work-in-progress by members who are solely responsible for the content and any views expressed therein. Any comments on these papers will be welcome and should be sent to the author(s) by email. Papers may be downloaded for personal use only.
*This paper was prepared as part of the project “Managing Capital Flows: Search for A Model”
of the Asian Development Bank Institute. We thank Mario Lamberte and the participants in the workshops held at the Asian Development Bank Institute in Tokyo for their helpful comments on earlier drafts. Gavin Murphy provided excellent research assistance.
a
University of Bonn, Indiana University and CEPR
b
1 INTRODUCTION
The twelve states1
that entered the European Union (EU) in 2004 achieved considerable macroeconomic stabilization during the accession process. The Central and Eastern European (CEE) countries among them went through the transition from central planning to market economies, beginning with severe recessions, high inflation, and financial instability. In due course, the inflation rates came down and nominal interest rates declined. Public debt has been stabilized, though high and persistent deficits and the need for further fiscal adjustments are still critical issues in several cases.
In the years to come, the new EU member states will face two principal challenges in formulating macroeconomic policies. The first is to manage the continued and likely rapid process of further real economic convergence, which will come with high real GDP and productivity growth rates and large capital inflows. The second is to achieve the degree of nominal convergence required to enter into (the Third Stage of) European Monetary Union (EMU). These two challenges are not unrelated, as rapid growth and large capital inflows can make it more difficult to achieve nominal convergence, although, as we have argued in a recent paper (von Hagen and Traistaru-Siedschlag, 2006), there are good reasons to believe that real convergence would be easier to manage for some of the countries at least, if they were allowed to adopt the euro immediately. Both challenges relate mainly to fiscal policy: Managing capital inflows, because fiscal policy can absorb part of their demand effects; and nominal convergence, because the sustainability of public finances is part of the requirement for entering EMU.
Lifting capital controls and restrictions on foreign currency trade was one of the conditions these states had to meet to qualify for EU membership. Thus, the CEE countries went from being largely closed to being largely open to international capital flows. This paper discusses their experience with capital account liberalization and with coping with large capital inflows. We begin in Section 2 with a discussion of basic economic characteristics and the real convergence achieved so far. In Section 3, we discuss the pace and sequencing of capital account liberalization and the degree of
1Bulgaria, Cyprus, the Czech Republic, Estonia, Hungary, Latvia, Lithuania, Malta, Poland, Romania,
2. BASIC ECONOMIC CHARACTERISTICS AND REAL
CONVERGENCE
The ten CEE countries are small open economies.2
As a group they amount to about 21 percent of the EU-27 population and 11 percent of the EU-27 total GDP in Purchasing Power Standards (PPS). Figure 1 shows that the smallest among them (Estonia, Latvia, Lithuania, Slovakia, Slovenia, and Bulgaria) are comparable in economic size to Luxembourg; while the Czech Republic, Hungary, and Romania are similar in size to Ireland, and Poland is similar to the Netherlands. By European standards, Luxembourg, Ireland, and the Netherlands are also small open economies.
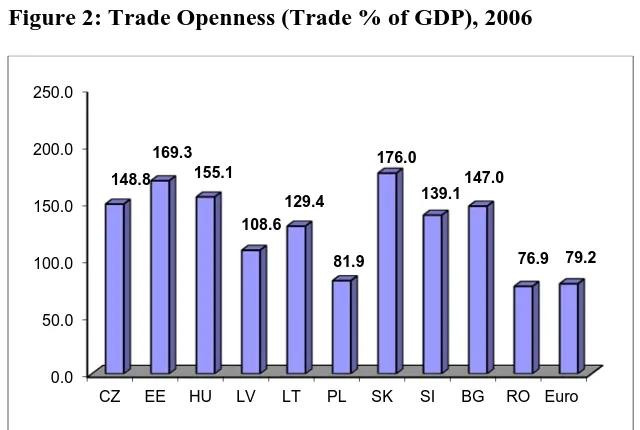
Trade openness, measured as total exports and imports of goods and services as a percentage of GDP is close to the trade openness of the Euro area in Romania and Poland and much higher in the rest of the CEE countries; see Figure 2.
Figure 1: GDP in PPS (% EU-27), 2006
Source: Based on the AMECO Database, European Commission
2 The CEE countries are Bulgaria, Czech Republic, Estonia, Hungary, Latvia, Lithuania, Poland,
Romania, Slovak Republic, and Slovenia. We do not include Cyprus and Malta in this paper because their underlying economic characteristics are different from the transition economies.
0 0.5 1 1.5 2 2.5 3 3.5 4 4.5
CZ EE HU LV LT PL SK SI BG RO LU IE NL 1.6
0.2 1.3
0.3 0.4 4.1
0.7 0.4
0.6 1.6
0.3 1.3
Figure 2: Trade Openness (Trade % of GDP), 2006
Source: Authors’ calculations based on the AMECO Database, European Commission.
In 2006, the gross fixed capital formation as percent of GDP ranged from 21.9 percent in Hungary to over 25.0 percent in the Czech Republic, Slovakia, Slovenia, Bulgaria and over 30.0 percent in Estonia and Latvia (Figure 3).
Figure 3: Gross Fixed Capital Formation (% of GDP), 2006
Source: Authors’ calculations based on the AMECO Database, European Commission.
These investment rates are high compared to the Euro-area average of 21.1 percent. Given the low levels of per capita income in these countries, investment rates are expected to remain high in the foreseeable future.
0.0 50.0 100.0 150.0 200.0 250.0
CZ EE HU LV LT PL SK SI BG RO Euro 148.8
169.3 155.1
108.6 129.4
81.9 176.0
139.1 147.0
76.9 79.2
25.1 33.8
21.9 34.4
23.1 20.0
26.4 25.8 26.2 24.6 21.1
0.0 5.0 10.0 15.0 20.0 25.0 30.0 35.0 40.0 45.0 50.0
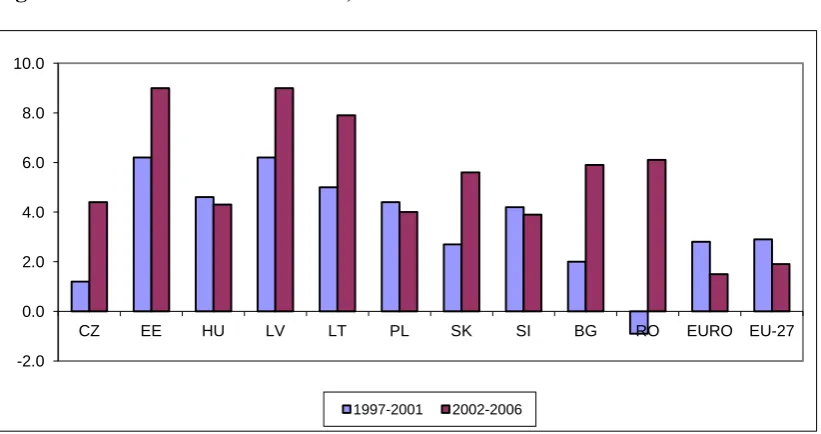
[image:5.595.85.478.444.646.2]Over the past decade, the CEE countries experienced a strong process of real convergence to the EU in terms of real GDP per capita and productivity levels. As shown in Figure 4, they grew at much higher rates than the Euro area. The group’s average real GDP growth rate was 3.6 percent during 1997-2001, and 5.4 percent during 2002-2006, while the Euro area grew at 2.8 percent and 1.5 percent, respectively. The three Baltic countries (Estonia, Latvia, Lithuania) experienced the highest growth rates over the past decade. Average annual growth rates were 6.2 percent in Estonia and Latvia and 5.0 percent in Lithuania during 1997-2001, and climbed to 9.0 percent in Estonia and Latvia and 8.0 percent in Lithuania during 2002-2006. Significantly, over the past five years, real growth remained vigorous in the CEE countries even though growth in the Euro area slowed down.
Figure 4: Real GDP Growth Rates, 1997-2006
Source: European Commission, Economic Forecast, Spring 2007.
Figure 5 shows a significant negative correlation between the level of GDP per capita in 1997 and the average annual growth rates over 1997-2006, as countries with low initial per capita income levels grew faster than richer countries. The three Baltic countries, as well as Bulgaria and Romania, which have the lowest levels of per capita income, are expected to continue to post the highest growth rates among the EU countries.
-2.0 0.0 2.0 4.0 6.0 8.0 10.0
CZ EE HU LV LT PL SK SI BG RO EURO EU-27
Figure 5: Convergence of Real GDP per Capita, 1997-2006
Source: Authors’ calculations based on the AMECO Database, European Commission.
Over the past decade, labor productivity growth, measured as the increase in real GDP per person employed, has been much higher in EU-10 in comparison with the Euro area. The highest growth rates were again in the three Baltic countries (Figure 6). There is a clear tendency for productivity levels to converge as countries with low initial levels of productivity enjoyed higher growth rates in comparison to countries with higher levels and the Euro area (Figure 7).
Figure 6: Labor Productivity Growth, 1997-2006
Source: European Commission, Economic Forecast, Spring 2007.
EU27 EU15
Euro BG CZ EE CY LV LT HU MT PL RO SI SK
y = -3.1096x + 5.39 R² = 0.683
0.00 0.50 1.00 1.50 2.00 2.50 3.00 3.50 4.00
0.60 0.70 0.80 0.90 1.00 1.10 1.20 1.30 1.40
av er ag e an n u al g ro w th 1997 -2006
log real GDP per capita 1997
0 1 2 3 4 5 6 7 8 9
CZ EE HU LV LT PL SK SI RO BG EURO EU-27
[image:7.595.84.475.528.725.2]Figure 7: Convergence of Labor Productivity Levels, 1997-2006
Source: Authors’ calculations based on the AMECO Database, European Commission.
3. CAPITAL ACCOUNT LIBERALIZATION AND INTERNATIONAL
FINANCIAL INTEGRATION
In this section we present an overview of the pace and sequencing of capital account liberalization in the ten CEE countries before their accession to the European Union and analyse the degree of their international financial integration3 to date.
At the beginning of the transition to market economies, all ten CEE countries had closed capital accounts. Capital account liberalization was part of their integration into the world economy. However, the pace was country-specific reflecting different initial conditions and macroeconomic development. 4 As a first step, current account convertibility was achieved between 1994 and 1996 as part of IMF membership obligations.5 For the Czech Republic, Hungary, Poland, and the Slovak Republic, the application for OECD membership in 1993-1994 was an additional catalyst for capital
3Throughout this paper the terms “international financial integration”, “capital account liberalization”
and “financial openness” are used interchangeably. 4
Arvay (2005) discusses in details the capital account liberalization in eight of the new EU member states (Czech Republic, Estonia, Hungary, Latvia, Lithuania, Poland, Slovak Republic, and Slovenia).
5 Article VIII.
EU27 Euro BG CZ EE CY LV LT HU MT PL RO SI SK
y = -3.074x + 6.2959 R² = 0.6688
0.00 0.50 1.00 1.50 2.00 2.50 3.00 3.50 4.00
1.00 1.10 1.20 1.30 1.40 1.50 1.60 1.70
aver ag e an n u al g ro w th 1997 -2006
account liberalization. But most importantly, the prospect of EU membership and the accession negotiations provided an institutional anchor for capital account liberalization in all CEE countries. Since the free movement of capital among member states and between member states and third countries is part of the EC Treaty,6
EU accession required full capital account liberalization. A schedule of steps for capital account liberalization was negotiated between each CEE country and the European Commission. Deviations from this schedule were allowed only in circumstances that had the potential to undermine the conduct of monetary and exchange rate policies. Transitional arrangements allowing some restrictions to be maintained beyond the entry into the EU were implemented for all CEE countries mostly with respect to politically sensitive areas such as the acquisition of agricultural and forestry land and real estate.
Regarding the pace of capital account liberalization, we can distinguish two groups of countries. First, the Baltic countries and the Czech Republic had abolished most restrictions on capital transactions by 1995. In contrast, Hungary, Poland, the Slovak Republic, and Slovenia opened their capital accounts more gradually, achieving full liberalization in 2001-2004. We include Bulgaria and Romania in this latter group, as they joined the EU only in 2007.
Table A1 in the Appendix summarises the experience of the CEE countries with capital account liberalization and managing large capital inflows. Three common features can be identified: (i) Restrictions on FDI were removed before portfolio flows were liberalised; (ii) Capital inflows were liberalised before capital outflows; and (iii) Long-term capital flows were liberalised before short-Long-term flows.
The traditional approach for assessing capital account openness is to look at legal restrictions on cross-border capital flows (de jure measures). There are more than 60 measures that can be grouped into direct (administrative) and indirect (market-based) restrictions. The IMF’s Annual Report on Exchange Arrangements and Exchange
Restrictions (AREAER) provides pertinent information. It has been used to construct
quantitative measures of capital account openness ranging from binary measures (0/1 dummy variables) (Grilli and Milesi-Ferretti, 1995) to more sophisticated indices of financial openness (Chinn and Ito, 2006; Miniane, 2004; Mody and Murshid, 2005;
Quinn, 2003). Table A2 in the Appendix reports the capital controls in place at the end of 2006 in the ten CEE countries. The number of controls on capital transactions ranges from two in Romania to 11 in Poland. All ten countries maintain controls for real estate transactions, and with the exception of Hungary, all have specific provisions with respect to commercial banks and institutional investors.7
However, these de jure measures have several shortcomings that may prevent them from accurately capturing the extent of capital account openness (Kose et al., 2006). First, the AREAER information is related to foreign exchange restrictions, which do not necessarily limit capital flows. Second, they do not reflect the enforcement of capital controls nor their effectiveness. Finally, other financial regulations, such as prudential caps on the foreign-exchange exposure of domestic banks, restrict capital flows in practice, but they are not counted as capital controls.
An alternative approach to measuring capital account openness is to use de facto
measures that reflect international financial integration (see for example Prasad, et al, 2003; Kose et al, 2006; Lane and Milesi - Ferretti, 2006). Such measures are based on actual capital flows and more accurately reflect the capital account openness in practice. To illustrate the extent of capital account liberalization in the CEE countries, we analyse the evolution of the sum of gross external position, i.e., the sum of foreign assets and liabilities, as a ratio to GDP8 as an indicator of international financial integration. We draw on the database constructed by Lane and Milesi-Ferretti (2006). Their data set has the advantage of being able to account for valuation effects and correcting for cross-country differences in data definitions and variable construction. It covers 145 countries over the period 1970-2004.
Figure 8 shows the evolution of the cross-country average9
of this indicator over the period from 1995 to 2004 in the ten CEE countries, the Euro area10
and the group of
7Some of these provisions are prudential measures and their aim is not necessarily to control capital
flows.
8Stock-based measures are less affected by short-term economic fluctuations (see IMF, 2007; Kose, et.
al, 2006).
Emerging Asian economies.11
[image:11.595.87.457.257.487.2]Over the entire period, international financial integration was lower in the ten CEE countries than in the Euro area and the group of Emerging Asia countries. While it was higher for the group of gradual liberalizers early on, the countries that have liberalized their capital accounts fast experienced a stronger financial integration since 2000.
Figure 8: International Financial Integration of the CEE countries, Euro Area,
and Emerging Asia, 1995-2004
Source: Authors’ calculations based on the dataset from Lane and Milesi-Ferretti (2006).
Table 1 shows the gross and net foreign asset positions in 1995 and 2004 in the ten CEE countries. We also present the averages for the Euro area and Emerging Asia.
10 The Euro area includes Austria, Belgium, Finland, France, Germany, Greece, Italy, the Netherlands,
Portugal, and Spain. Ireland and Luxembourg are not included as they are extreme outliers due to their positions as major offshore centers.
11 People’s Republic of China, India, Indonesia, Korea, Malaysia, Philippines, Singapore, Thailand, and
Viet Nam.
0.0 50.0 100.0 150.0 200.0 250.0 300.0 350.0 400.0 450.0 500.0
1995 1996 1997 1998 1999 2000 2001 2002 2003 2004
CEE-Fast Group CEE-Gradual Group
Table 1: External Position of the CEE Countries, Euro Area and Emerging Asia
External, 1995 External Assets, 2004
Gross Net Gross Net
Czech Republic 100.1 3.6 162.6 -34.6
Estonia 69.9 -6.8 251.5 -99.7
Latvia 75.7 -3.3 190.1 -55.0
Lithuania 48.6 -9.4 105.0 -38.9
Bulgaria 125.2 -40.6 173.3 -47.8
Hungary 123.7 -57.7 181.0 -96.9
Poland 65.7 -21.7 116.6 -53.3
Romania 41.5 0.7 95.8 -34.8
Slovak Republic 93.4 12.6 156.5 -37.5
Slovenia 66.9 2.3 150.8 -18.0
CEEcs 81.1 -12.0 158.3 -51.7
CEE-Fast group 73.6 -4.0 177.3 -57.1
CEE-Gradual group 86.0 -17.4 145.7 -48.0
Euro area 173.5 -11.2 432.9 -20.1
Emerging Asia 124.9 -29.1 220.5 -3.8
Source: Calculations based on the database constructed by Lane and Milesi-Ferretti (2006). The gross external position is the sum of foreign assets and liabilities as percent of GDP. The net external position is the difference between foreign assets and liabilities as percent of GDP.
Over the period from 1995 to 2004, the gross external position of the CEE countries increased from an average of 81.1 percent of GDP in 1995 to 158.3 per cent of GDP in 2004. This increase is larger than the corresponding figure for Emerging Asia, where the gross external position rose from an average of 124.9 percent of GDP to 220.5 percent of GDP. However, it is lower than the corresponding increase in foreign assets in the Euro area countries.
What explains these cross-country differences in international financial integration? Empirical studies12
suggest a number of factors underlying cross-country financial openness, including financial development, institutional quality, trade openness and capital controls. Figure A1 (Appendix) shows partial correlations between the gross stock of foreign assets and liabilities as percent of GDP and several underlying factors suggested by the empirical literature. The data cover the ten CEE countries over the period from 1995 to 2004. Although the information in these simple correlations is limited, the results are suggestive. They indicate that financial integration is positively associated with domestic financial development (measured as private credit as percent of GDP and stock market capitalisation as percent of GDP), institutional quality and trade openness and negatively associated with capital controls. These results should only be taken as indicative as they reflect unconditional partial correlations. A more formal analysis is required to identify causal relationships between these underlying factors and financial openness.
Over the period from 1995 to 2004, the ten CEE countries experienced large net capital inflows and, as a consequence, dramatic changes in their net external positions. As shown in Figure 9, net capital flows into the CEE countries as a percentage of GDP were significantly larger than in Euro area and the Emerging Asia. Since 2000, the group of fast liberalizers has experienced larger net capital inflows than the gradual liberalizers. This is in contrast to the improving net external positions of Emerging Asia and the Euro area.
Figure 9: Net External Positions
Source: Authors’ calculations based on the dataset from Lane and Milesi-Ferretti (2006).
Figure A2 in the Appendix shows the evolution of the composition of gross stocks of foreign assets and liabilities in the CEE countries over the 1995-2004 period. A common feature is the high share of portfolio debt in foreign assets and liabilities. This reflects the dominant role of the banking sector in financial intermediation and the large size of government securities markets in the CEE countries13.
Table 2 shows the composition of the stocks of external liabilities in the CEE countries in 1995 and 2004. The low share of portfolio equity in capital inflows in 1995 reflects the low level of capital market development and poor corporate governance in these countries. Only the Czech and Slovak Republic stand out for larger shares of equity in total foreign liabilities. This may be explained by the relative strength of the enterprise sector in these countries and their historical economic and trade links to Germany and Austria. Another factor may have been that the privatization of the industrial sector in
13For a discussion of the composition of capital flows to CEE countries, see also (Arvai, 2005) and Lane
and Milesi-Ferretti (2007). -60
-50 -40 -30 -20 -10 0
1995 1996 1997 1998 1999 2000 2001 2002 2003 2004
CEE- Fast group CEE- Gradual group
these two countries was implemented by giving citizens shares in domestic companies. Note that the Czech Republic is the largest portfolio investor in the Slovak Republic.14
With the exception of Latvia, the share of FDI in total liabilities has increased, while that of external debt has decreased in all countries. Compared to the gradual liberalizers, the group of fast liberalizers has a large share of FDI and a small share of debt in total foreign liabilities.
[image:15.595.85.485.371.625.2]Excessive reliance on debt for financing current account deficits is commonly regarded as a sign of vulnerability to financial shocks, while FDI-based financing is perceived as promoting risk-sharing (see Kose et al, 2006; Lane and Milesi-Ferretti, 2006). From this point of view, the changes in the composition of gross stocks of foreign liabilities in the CEE countries over the past decade seem positive.
Table 2: Composition of Stocks of External Liabilities in the CEE Countries
1995 2004
Equity %
FDI %
Debt %
Equity %
FDI %
Debt %
Czech Republic 9.7 27.0 63.2 8.9 53.5 36.3
Estonia 0.0 46.8 53.2 9.7 50.1 40.1
Latvia 0.4 31.9 67.8 0.9 27.3 71.6
Lithuania 0.7 19.7 79.6 1.1 40.0 58.9
Bulgaria 0.4 4.1 95.5 0.1 36.6 63.3
Hungary 0.5 29.3 70.2 8.6 44.7 44.8
Poland 1.1 13.2 85.7 6.4 41.6 52.0
Romania 0.0 5.8 94.2 3.0 39.8 57.2
Slovak Republic 7.1 16.6 76.3 9.4 38.5 52.1
Slovenia 1.0 27.6 71.4 2.9 27.3 69.7
CEE-Fast group 2.7 31.4 66.0 5.1 42.7 51.7
CEE-Gradual group 1.7 16.1 82.2 5.1 38.1 56.5
Source: Based on the dataset from Lane and Milesi-Ferretti (2006).
Table 3 reports the composition of the foreign assets of CEE countries in 1995 and 2004. Foreign exchange reserves and portfolio debt dominate the composition of
external assets in these countries. Following the liberalisation of capital outflows and increase in cross-border assets trade, the shares of FDI and portfolio equity have surged, in particular in Estonia, Hungary, Slovenia and the Czech Republic. To the extent that the private sector in the CEE counties becomes more internationalised, it is likely that the FDI and portfolio equity outflows will further increase.
Table 3: Composition of Stocks of Foreign Assets in the CEE Countries
1995 2004
Equity+FDI Debt Reserves Equity+FDI Debt Reserves
% % % % % %
Czech Republic 3.6 49.1 47.4 9.3 47.0 41.3
Estonia 6.8 44.3 48.9 21.5 57.6 20.6
Latvia 14.3 57.2 28.6 3.2 75.5 20.7
Lithuania 0.4 37.2 62.4 6.3 45.8 47.9
Bulgaria 2.0 75.7 22.3 -0.2 41.3 58.8
Hungary 1.0 17.7 81.2 15.9 40.1 38.1
Poland 1.8 48.7 49.5 4.8 49.1 46.1
Romania 1.7 77.2 21.1 1.4 31.4 67.3
Slovak Republic 9.5 57.7 32.8 8.9 32.1 59.0
Slovenia 7.5 66.0 26.6 17.1 42.5 40.4
CEE-Fast group 6.3 47.0 46.8 10.1 56.5 32.6
CEE-Gradual group 4.0 57.2 38.9 8.0 39.4 51.6
4. CAPITAL FLOWS: PATTERNS AND DETERMINANTS
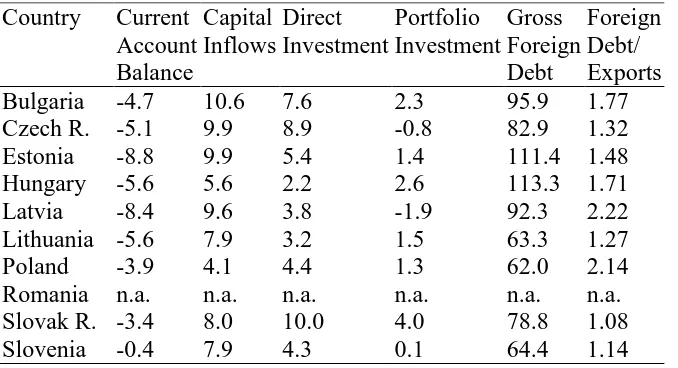
As shown in the previous section, net capital flows to the CEE countries have been on a rising trend since the early 1990s. Unlike that in other regions (Asia and Latin America) the surge in capital flows in these countries has been associated with large current account deficits. Tables 4A and 4B report the average deficits in relation to GDP in the years 2000-2003 and 2004-2006. Estonia and Latvia stand out with deficits exceeding eight percent of GDP, Lithuania and Hungary follow with deficits of 5.6 percent of GDP and the Czech Republic with 5.1 percent. While the Czech Republic’s current account deficit has not been supported by high real GDP growth rates in recent years, it has been accompanied by a high investment rate. Only Slovenia, the first country in this group to join the Euro area, has kept its current account close to balance on average in recent years. Most new member states experienced sizeable real appreciations15
[image:17.595.84.423.447.631.2]of their currencies in recent years (see Figure 10). Thus, their large current account deficits are not an indication of weak currencies; instead, they reflect the large capital inflows these countries have attracted in recent years.
Table 4A: External Performance 2000-2003
Country Current Account Balance
Capital Inflows
Direct Investment
Portfolio Investment
Gross Foreign Debt
Foreign Debt/ Exports Bulgaria -4.7 10.6 7.6 2.3 95.9 1.77 Czech R. -5.1 9.9 8.9 -0.8 82.9 1.32 Estonia -8.8 9.9 5.4 1.4 111.4 1.48 Hungary -5.6 5.6 2.2 2.6 113.3 1.71
Latvia -8.4 9.6 3.8 -1.9 92.3 2.22
Lithuania -5.6 7.9 3.2 1.5 63.3 1.27
Poland -3.9 4.1 4.4 1.3 62.0 2.14
Romania n.a. n.a. n.a. n.a. n.a. n.a. Slovak R. -3.4 8.0 10.0 4.0 78.8 1.08 Slovenia -0.4 7.9 4.3 0.1 64.4 1.14
Notes: All entries are averages of annual rates in percent of GDP. Capital inflows include errors and omissions. Investment figures are net. Czech Republic and Poland: 2000-2002, Slovak Republic: 2000. Source: IMF, International Financial Statistics.
15Von Hagen and Traistaru-Siedschlag (2006) discuss in detail the extent and causes of real currency
Following their entry into the EU in 2004, the experience of these countries has been diverse. Those countries that followed hard exchange rate pegs, namely Bulgaria, Estonia, Latvia, and Lithuania, saw a widening of their current account deficits, while those adopting floats, namely the Czech Republic and Poland in particular, kept their current account deficits at smaller rates of GDP. Capital inflows rose in the former and fell in the latter. Slovenia, which adopted an intermediate peg, had the smallest capital inflows during that period.
Table 4B: External Performance 2004-2006
Country Current Account Balance
Capital Inflows
Direct Investment
Portfolio Investment
Gross Foreign Debt
Foreign Debt/ Exports Bulgaria -11.5 19.5 14.3 1.2 103.9 1.71
Czech R. -3.3 4.5 6.0 1.9 94.5 1.30
Estonia -12.4 14.0 13.1 -0.5 175.8 2.27
Hungary -7.2 9.1 9.9 6.7 155.0 2.22
Latvia -15.9 20.1 5.8 1.4 129.5 2.86
Lithuania -8.5 9.7 4.5 2.3 81.5 1.43
Poland -3.0 3.8 4.7 3.2 79.2 2.06
Romania n.a. n.a. n.a. n.a. n.a. n.a.
Slovak R. n.a n.a n.a n.a n.a. n.a.
Slovenia -2.5 1.4 1.9 0.9 79.1 1.24
Notes: All entries are averages of annual rates in percent of GDP. Capital inflows include errors and omissions. Investment figures are net.
The sustainability of persistent, large current account deficits depends in part on the type of capital inflows used to finance these deficits, as portfolio investment is commonly thought to be more fickle than direct investment.16 A high share of direct investment, therefore, results in less exposure to sudden reversals of capital flows that might occur due to changing expectations and investor confidence in the international capital market.17 Table 4A shows that there are some striking differences in the type of financing among the new member states. In Bulgaria, the Czech Republic, Poland, the Slovak Republic, and Slovenia, net foreign direct investment substantially exceeded the current account deficits. The other states, in contrast, took recourse to portfolio and other investment to a much larger extent. It is interesting to note that Estonia and Lithuania, two countries in this group that operate currency boards, have relatively low shares of foreign direct investment in financing their current account deficits. This
16As pointed out by Buiter and Grafe (2002), even foreign direct investment can be quickly reversed if
there are well developed markets for equity and corporate securities.
17 Note, however, that even foreign direct investment inflows could be reversed quickly, if foreign
investors could sell their assets in liquid domestic securities or equities markets. (Buiter and Grafe, 2003).
60 70 80 90 100 110 120 130 140 150
1994 1995 1996 1997 1998 1999 2000 2001 2002 2003 2004 2005 2006
[image:19.595.94.442.137.400.2]Year
Figure 10: Real Effective Exchange Rates
suggests that the credibility of a hard peg is not the principal factor in determining the financing conditions.
Following their entry into the EU in 2004, Estonia and Hungary joined the group of countries with FDI exceeding the current account deficit. Tables 4A and 4B show that, with the exception of Latvia and Lithuania, the share of direct investment in total capital inflows rose following accession to the EU. This suggests that the firm commitment institutional framework of European integration and the assured access of their export industries to West European markets provided a boost of credibility to the countries’ market-oriented policies, persuading international investors to make more long-term oriented investments.
Tables 4A and 4B also show the average gross foreign debt positions of the same countries over the same time periods, measured in terms of GDP. External debt ratios have increased substantially since the countries’ entry into the EU. Relating foreign debt to the annual volume of exports shows that Estonia, Hungary, Latvia, and Poland now have a relatively large foreign debt burden.
The prospect of further large capital inflows will be an important factor shaping the macroeconomic policies of the new member states in the years to come. As noted by Lipschitz et al. (2002) and Lipschitz (2004), the CEE countries in particular are rich in well-trained labor and poor in capital compared to their main trading partners, implying that their marginal product of capital is relatively high. Table 5 reports some “back-of-the-envelope” estimates of the marginal product of capital relative to Germany in the new member states. Following Lipschitz et al. (2002), they are based on the assumption of Cobb-Douglas production functions with a capital elasticity of 1/3 and equal total factor productivities in all countries.18 In 1996, the largest relative marginal products of
capital estimated in this way were in the Baltic countries, followed by Poland. In Hungary and the Czech Republic, the marginal products of capital were about 4-5 times
18Let y
i = Ai (ki)α be output per employed worker in country i, with ki the capital labor ratio, Ai total factor productivity, and α = 1/3 the capital elasticity. The marginal product of capital is MPCi= αAi(ki)
-(1-α). The capital labor ratios are computed using output in PPP dollars from the World Economic Outlook
larger than in Germany, and in Slovenia and Cyprus about three times. Since the mid-1990s, these ratios have declined dramatically, reflecting the rapid productivity growth.
Table 5: Marginal Product of Capital (Multiple of German MPC)
BU CZ EE HU LV LT PL RO SK SI 1996 n.a. 4.17 10.35 4.87 16.36 9.95 8.07 n.a. 6.08 2.87 2002 10.9 4.08 6.03 3.88 9.80 6.74 5.48 16.0 4.33 2.15
Source: Authors’ estimates.
EU membership and the adoption of the acquis communautaire represent a dramatic improvement in the institutional framework of these economies, which, in macroeconomic terms, can be interpreted as a rise in total factor productivity adding to the gap in the marginal products of capital in favour of the new member states.19 Furthermore, EU membership implies a higher degree of legal certainty for investors, and thus induces a reduction in country-risk premiums. Based on these considerations, Lipschitz estimates the cumulated potential future capital inflows to be between 65 percent (Slovenia) and 596 percent of GDP (Lithuania.)20 Obviously, these estimates must be taken cautiously given the uncertainty of the model and potential limits of capital supply.21 Furthermore, the inflows will be distributed over time. The main point, however, is that the capital inflows are likely to remain large in the foreseeable future. Other factors contribute to this tendency (Begg et al., 2003). One is the relatively low level of financial development of the former socialist economies, which limits the extent to which capital investments are financed from domestic sources. Another is the likely increase in the demand for money as inflationary expectations continue to fall. Given the limited size of domestic securities markets, much of that increase will likely be accommodated by an inflow of foreign reserves at the central bank. Finally, Ahearne et al (2007) show that capital flows within the Euro area have responded much more
19 IMF (2003) presents empirical evidence that institutional quality affects economic growth. Studying
growth patterns in transition economies, Grogan and Moers (2001) find that institutional improvements lead to higher growth and stronger foreign direct investment. Alfaro et al (2003) find that, in a sample of 50 countries, institutional weakness is an important hindrance against capital inflows to poor countries. 20 Lipschitz does not give estimates for Cyprus and Malta.
21 Jonas (2004) notes that global capital flows to emerging market economies surged in 2003, but predicts
strongly to differences in per-capita incomes or output-labor ratios than capital flows among European countries outside of the Euro area. This suggests that capital flows to the CEE countries will surge again upon their adoption of the euro.
5. MANAGEMENT OF LARGE CAPITAL INFLOWS:
POLICY CHALLENGES
Large capital inflows are desirable in principle for relatively low-income countries, because they induce an efficient international allocation of capital and expand the receiving countries’ consumption and investment frontiers, allowing simultaneously for more investment and higher consumption levels, and speeding up the growth and real convergence process. However, they also pose potential risks from two sides: overheating and volatility.
The first risk is that of the (in)famous convergence play, a combination of real appreciation and declining long-term interest rates due to falling inflationary expectations and country-risk premiums, which makes the economies even more attractive for short-term capital inflows and portfolio investment. If the demand financed by capital inflows falls entirely on tradables, it can simply be absorbed by large trade deficits. As witnessed by the experiences of Italy, Spain, and Portugal in the late 1980s and early 1990s, convergence play in practice fuels domestic demand for non-tradables, too, where domestic supply is limited, leading to severe economic overheating with inflationary pressures. With a fixed exchange rate, the increase in the price level leads to a real appreciation of the domestic currency. With a floating rate, the central bank can do more to suppress inflationary pressures and allow the nominal exchange rate to appreciate.
rate and rising cash flows that raise the value of assets that can be collateralized against bank loans. Large capital inflows are, therefore, often connected to asset and real estate price bubbles fuelling credit booms. To the extent that they are absorbed by an expansion of international reserves at the central bank, the ensuing monetary expansion contributes to this development.
[image:23.595.82.460.310.492.2]We can assess this risk by looking at recent growth rates of narrow money and credit in the new member states (Table 6).
Table 6: Annual Average Real Money and Credit Growth, 1999-2006
Real Money Growth Less Real Output Growth
Real Domestic Credit Growth Less Real Output Growth 1999-2003 2004-2006 1999-2003 2004-2006
Bulgaria 8.9 17.5 n.a. n.a.
Czech Republic 6.4 3.4 -1.1 -0.1
Estonia 14.0 11.1 18.5 19.2
Hungary 10.2 5.3 7.2 6.7
Latvia 13.2 15.9 28.0 30.9
Lithuania 11.3 20.1 12.2 32.3
Poland 6.7 6.4 6.3 -5.0
Romania -0.1 n.a. n.a. n.a.
Slovak Republic 7.3 3.6 -1.2 4.8
Slovenia 12.5 9.1 13.5 15.9
Notes: Average annual growth rates of narrow money and domestic credit. Source: Based on IMF, International Financial Statistics.
Falling interest rates and declining inflationary expectations may have caused a decline in the equilibrium velocity of money. If the income elasticity of the demand for money exceeds 1, strong real GDP growth adds another explanation. Thus, real money growth rates of 6-8 percent above real output growth may not be excessive. However, the strong monetary expansions in the second group raise a red flag. Turning to credit growth, the ongoing process of financial market development leads to the expectation that credit is growing fast in the new member states. Nevertheless, the table shows four countries with clear signs of strong credit booms, Estonia, Latvia, Lithuania, and Slovenia. Taking money and credit growth rates together, they seem to be the critical cases in the group. This is interesting because, in the past, these four countries also put the largest weight on stabilizing their exchange rates among the countries in this group (von Hagen and Zhou, 2004; Thimann et al. 2004).
Table 8: Volatility of Capital Inflows
BU Czech Republic
Estonia Hungary Latvia Lith. Poland Slovak Republic
Slovenia 8.2 4.6 3.6 5.0 5.6 3.0 2.8 2.6 4.4 0.6 0.7 0.3 -1.5 -5.4 -2.0 -1.4 -1.5 0.9 -12.1
(1996) -11.2 (1997) -6.5 (1997)
-19.9 (1996)
-5.8 (2002)
-6.1 (1999)
-3.8 (2001)
-2.3 (1997)
-9.9 (2003)
Notes: Standard deviations for Poland and Czech Republic: 1994-2002, for Slovak Republic: 1994-2000. All entries are in percent of GDP.
Source: Authors’ calculations based on International Financial Statistics.
2002 to cover losses from sterilization (MNB, Annual Report 2002). The BIS estimates that the annual costs of sterilizing intervention in individual years between 2000 and 2003 amounted to up to 0.15 percent of GDP for the Czech Republic, 0.2 percent for Poland, and 0.74 percent for Hungary (Mohanty and Turner, 2005). Hauner (2005) points out that the quasi-fiscal costs of holding large amounts of international reserves should include the opportunity foregone to pay down foreign debt or to finance public investment. He estimates the costs of sterilizing capital inflows at 0.5-0.6 percent of GDP annually for the CEE countries. Thus, the costs of managing capital inflows can be substantial.
Source: IMF, IFS Statistics January 2007.
Figure 11 shows the development of central bank net foreign assets relative to reserve money. For Slovenia, we use currency in circulation multiplied by a factor of 10 to obtain a similar order of magnitude. On the left-hand axis, we show the ratio for the
-50 0 50 100 150 200 250 300 350
-300 -250 -200 -150 -100 -50 0 50 100 150 200 250
1994 1995 1996 1997 1998 1999 2000 2001 2002 2003 2004 2005
P
ercen
t
o
f Reserve
M
o
n
[image:25.595.94.470.324.630.2]ey
Figure 11: Central Bank Net Foreign Assets
countries that pegged their exchange rates, while for the floating-rate countries (Czech Republic, Poland, Romania, and Slovak Republic), we use the right-hand axis. For the first group, the ratio of net foreign reserves to reserve money was stable or slightly increasing over the 11 years under consideration, indicating that central bank money growth was primarily driven by foreign-exchange policies. Remarkably, for the floating-rate countries, we observe a rising trend in the ratio, indicating that they purchased foreign assets on large scales, presumably to keep their currencies from appreciating faster. Thus, the large capital inflows fuelled monetary expansions even in countries that did not officially peg their exchange rates.
The second risk connected with large capital inflows is their volatility. To date, in fact, capital inflows to the new member states have been quite volatile. Table 8 reports the standard deviation of annual capital inflows relative to GDP between 1994 and 2003. This ratio varied between 2.6 percent of GDP for Poland and 5.0 percent of GDP for Hungary. Volatility is high compared to the average inflows reported in Table 4. The table also shows that several countries in this group experienced large reversals of capital inflows, Sudden stops in the term used by Calvo and Reinhart (1999). Between 1999 and 2000, capital inflows slowed down in seven of the ten countries, the exceptions being the Czech Republic, Estonia, and Slovenia. Between 1994 and 2003, eight of the ten countries experienced at least one year in which capital inflows declined by more than five percent of GDP, while four experienced a decline of (almost) 10 percent or more. This confirms the observation by Calvo and Reinhart (1999) that large capital inflows are often followed by sudden stops and reversals. With the exception of Poland and the Slovak Republic, the reversals reported in Table 8 easily qualify as large
compared to the evidence reported by Calvo and Reinhart. Obviously, they have affected countries with very different exchange rate regimes, supporting Calvo’s (2003) argument that exchange rate policies are of secondary importance for the incidence of sudden stops. Note also that the largest reversals occurred around the year 2000, confirming the observation in Calvo and Reinhart (1999) and Calvo et al. (2004) that sudden stops are bunched in time and across countries.
the current account deficit or the money supply or both, leading to a contraction in aggregate demand. The ensuing real depreciation of the currency entails a drop in the relative price of non-tradables. Producers of non-tradables now face higher ex-post real interest rates and lower asset values anticipated, including those assets they can use as collateral for borrowing from banks. Banks react to the resulting deterioration in the quality of their loans by cutting back lending. The resulting credit crunch makes the recession more pronounced and longer lasting. In principle, this financial effect can be avoided by a large nominal depreciation of the currency. This, however, increases the burden of foreign currency debt on the government and the private sector.
Coping with large capital inflows is a difficult task for macroeconomic policy. Since the underlying reason is real, there is not much that monetary policy can do. The obvious response is to tighten monetary policy to prevent aggregate demand from overheating. With a fixed exchange rate, capital inflows then lead to a rapid increase in international reserves. The central bank may try to sterilize their impact on the money supply, but in practice this is costly and ultimately of only limited success. Inflationary pressures then result in a real appreciation, a loss in international competitiveness, and a widening current account deficit. Under a flexible exchange rate, the central bank may be more successful in keeping inflation low, but at the cost of a nominal appreciation of the currency, with the same effect on competitiveness and the current account.
At the same time, episodes of large capital inflows into small open economies generate a preference for low exchange rate variability, even if the official exchange rate regime allows for a high degree of flexibility. This has been dubbed the fear of floating in recent literature. The reason is that, since emerging-market countries typically cannot borrow internationally in their own currency, large capital inflows lead to a mounting stock of foreign debt denominated in foreign currency. Exchange rate variations then expose the government and private sector to fluctuations in their balance sheets. Hausmann et al. (2001) show that fear of floating is strongly associated with a country’s borrowing in foreign currency and the degree of exchange rate volatility it allows.22 If this is true for the new EU member states, they will show a tendency to tightly manage
22A recent paper by Detken and Gaspar (2004) shows that fear of floating could also stem from the
their exchange rates as the capital inflows continue to persist. Today already, five of the CEE countries have adopted intermediate or hard pegs and Slovenia has joined the Euro area; see Table 9. They may even decide to enter the ERM-2 for that reason, hoping that it will offer more credibility to their commitment to exchange rate targets.23
[image:28.595.80.505.392.552.2]Yet, the comfort offered by an exchange rate peg in this situation can be quite betraying. As the risk of exchange rate variability seems to be low, private borrowers and the government are more inclined to borrow in foreign currencies than they would be otherwise, which increases the exposure to sudden stops and exchange rate crises. As long as the capital inflows continue to be large, the exchange rate peg brings a monetary and credit expansion that aggravates the tendency for overheating. Once the capital flows dry up, the peg may come under speculative attacks, which, unless they can be successfully defended, are costly and more disruptive than the adjustment under a floating rate.
Table 9: Exchange Rate Regimes of CEE Countries
Country Regime Country Regime
Bulgaria Currency board Lithuania Currency board
Czech Republic Float Poland Float
Estonia Currency board Romania Float
Hungary Intermediate peg Slovak Republic Float
Latvia Intermediate Peg Slovenia Euro
Source: World Bank (2006), von Hagen and Zhou (2004).
The ERM-2 may offer some relief and credibility in such a situation due to the financial support for interventions it provides, but the history of the early 1990s suggests that its usefulness is limited at best. The experience teaches that European exchange rates tend to become objects of politics, especially in situations where there is market tension. The
countries exposed to convergence play failed to adjust their exchange rates in a timely way in the late 1980s and early 1990s, and this contributed to the size of the later devaluations and currency crises. When Germany asked for a revaluation of the DM to absorb the post-unification capital inflows, other governments and central banks were unwilling to grant it. It is not clear a priori that the new member states would not see similar resistance against repeated devaluations of the euro against their currencies, which might be required to counteract inflationary tendencies if capital inflows continue during their ERM-2 membership. Thus, the multilateral nature of the ERM-2 does not obviously add to its economic rationality. It is equally uncertain that the multilateral political negotiations required for devaluations can be completed fast enough in the case of a sudden stop. The multilateral political framework may, in contrast, create ambiguities and rumours in the markets, which can undermine the credibility of the pegs.
Since a sudden stop of capital inflows is equivalent to a cut in international credit to the home economy, the appropriate response by the central bank is to expand credit to the private sector. This can be done through open market operations or loans to the banking system under a flexible exchange rate and entail a nominal depreciation of the currency. The latter also reduces the need for the relative price of non-tradables to fall, but increases the domestic value of the foreign debt burden on the government and the private sector to the extent that foreign debt is denominated in foreign currency. Maintaining an exchange rate peg, in contrast, allows one to avoid the valuation effect, but the loss of international reserves at the central bank leads to a monetary contraction that makes the credit crunch more severe. Thus, sudden stops create a monetary policy dilemma. As recent literature has noted, euro-ization offers a partial way out of this dilemma.24 First, it eliminates the valuation effect on the affected country’s debt denominated in euros. Second, the supply of bank credit is no longer limited by the domestic central bank’s supply of bank reserves but by the ESCB’s supply of bank reserves. This makes any the credit contraction less severe, as monetary policy will not add to it. As a result, countries facing large (and volatile) capital inflows should have a
preference for either floating exchange rates or euro-ization, but avoid soft pegs, especially if, as in the case of the ERM-2, they are unprotected by capital controls. Fiscal policy is the more appropriate policy instrument for dealing with capital flows. In the face of large inflows, tightening the fiscal stance helps reduce the risk of economic overheating. Here, again, the quality of the fiscal adjustment matters. If tightening is achieved by raising tax rates, the result is buoyant tax revenues and, therefore, a strong temptation to expand fiscal spending. At the same time, initiatives to cut spending in the face of a strong economy will not be very popular. Furthermore, Calvo (2003) points out that, by raising distortionary taxes, the government may reduce the economy’s growth potential and thus precipitate a sudden stop. Again, it is important to achieve tightening by cutting government expenditures rather than by raising taxes. This makes the role of good budgeting institutions especially important. Effective spending controls and medium-term fiscal targets that are well anchored in the planning and implementation procedures are important for achieving a sufficient degree of fiscal discipline and using fiscal policy to manage capital inflows.25
As most of the new member states need to tighten their fiscal policies to meet the requirements of EMU, managing capital inflows and meeting these requirements are complementary goals for them. However, the countries with the tightest fiscal stance in recent years are also those that have experienced the strongest credit expansions. For them, as for the others in the future, further tightening to fend off the macroeconomic effects of large capital inflows may be asking too much of fiscal policy (Jonas, 2004). There is also a task here for prudential supervision and banking regulation involved in managing large capital inflows. Recent empirical studies show that large credit booms and strong real appreciations are among the best indicators of the risk of currency and banking crises.26 Banking regulation can help to prevent capital inflows from spilling over into domestic credit booms (Begg et al., 2003.) Strict rules against overlending and overexposure to individual borrowers are one important element. As lending booms are often triggered by real estate price bubbles, limits on the use of real estate as collateral
25
Kopits (2000) also notes the usefulness of credible medium-term fiscal plans (rules in his terminology) to avert currency crises in emerging-market economies.
26 For banking crises, see Borio et al. (2004) and Ho and von Hagen (2007). For currency crises, see
can serve as another element for protecting the banking system against adverse developments. Furthermore, currency mismatch in the aggregate balance sheet of the banking sector has been an important part of the link between banking problems and currency crises in recent years. Systemic risk arising from large exposure to international interest rate shocks or sudden capital outflows may not be visible in individual bank balance sheets even when it is in the aggregate balance sheet. Monitoring the entire banking sector’s financial position is, therefore, an important part of banking supervision in the new member states.
6 LESSONS AND POLICY IMPLICATIONS FOR ASIA’S EMERGING
ECONOMIES
Over the past decade, the ten CEE countries have achieved a high degree of market integration and macroeconomic stabilization as part of their accession process. Capital account opening formed part of the increasing integration of these countries into the world economy. EU accession and OECD membership were two important institutional anchors for their international financial integration. Although the pace of the capital account liberalization varied across the ten countries, three common features can be identified in the sequencing of this process: (i) restrictions on FDI were removed before financial flows were liberalised; (ii) capital inflows were liberalised before capital outflows; and (iii) long-term capital flows were liberalised before short-term flows. Over the 1995-2004 period the level of international financial integration in the ten CEE countries was low in comparison to the Euro area average and the group of emerging Asian countries. While in the beginning of the period, international financial integration was higher in the group of gradual liberalizers, since 1998 the countries that have rapidly liberalized their capital account have experienced a faster increase in their international financial integration than the group of gradual liberalisers. Over the same period, the increase of international financial integration in the CEE was high in comparison to the group of nine emerging Asian economies but low in comparison to the increase in the Euro area. The group of fast capital account liberalizers experienced faster growth of their financial openness than the group of gradual liberalizers.
A common feature of changes in the composition of the gross stocks of assets and liabilities has been an increase in the share of FDI and a decrease in the portfolio debt. To the extent that FDI-based financing is perceived as promoting risk sharing, this change can be seen as positive.
In the ten CEE countries, financial openness appears to be positively associated with domestic financial development (measured as private credit as percent of GDP and stock market capitalisation as percent of GDP), institutional quality and trade openness, and to be negatively associated with capital controls.
While large capital inflows are in principle desirable for relatively low-income countries, they also pose the potential risk of sudden stops leading to large economic and financial imbalances. Coping with large capital inflows is a difficult task for macroeconomic policy. Since the underlying reason is real, there is not much monetary policy can do. The obvious response is to tighten monetary policy to prevent aggregate demand from overheating. With a fixed exchange rate, inflationary pressures result in a real appreciation, a loss in international competitiveness, and a widening current account deficit. With a flexible exchange rate, the central bank may be more successful in keeping inflation low, but at the cost of a nominal appreciation of the currency, with the same effect on competitiveness and the current account. We argue that fiscal policy is the more appropriate policy instrument for dealing with large capital inflows. Tightening the fiscal stance helps to reduce the risk of economic overheating. We argue that more effective spending controls and improved budgeting procedures rather than higher taxes will best promote macroeconomic stability.
References
Ahearne, Alan, Birgit Schmitz and Jürgen von Hagen. 2007. Current Account Imbalances in the Euro Area. Mimeo, University of Bonn and BREUGEL, Brussels.
Alfaro, Laura, Segnem Kalemli-Ozcan, and Vadym Volosovych. 2003. Why Doesn’t Capital Flow from Rich Countries to Poor Countries? An Empirical Investigation. Working Paper, University of Houston.
Arvai, Zsofia. 2005. Capital Account Liberalization, Capital Flow patterns, and Policy Responses in the EU’s New Member States. IMF Working Paper 05/213.
Begg, David, Barry Eichengreen, Laszlo Halpern, Jürgen von Hagen, Charles Wyplosz. 2003. Sustainable Regimes of Capital Movements in Accession Countries. CEPR Policy Paper 10, London: CEPR
Borio, Claudio, and Philip Lowe. 2004. Securing Sustainable Price Stability: Should Credit Come Back From The Wilderness? Mimeo, BIS, Basel.
Buiter, Willem H., and Clemens Grafe. 2002. Anchor, Float, or Abandon Ship: Exchange Rate Regimes for Accession Countries. Working Paper, European Bank for Reconstruction and Development.
Calvo, Guillermo. 2002. Globalization Hazard and Delayed Reform in Emerging Markets. Economía 2, 1-29.
Calvo, Guillermo. 2003. Explaining Sudden Stops, Growth Collapse, and BOP Crises. The Case of Distortionary Output Taxes. IMF Staff Papers50.
Calvo, Guillermo, and Carmen Reinhart. 1999. When Capital Inflows Come to a Sudden Stop: Consequences and Policy Options. Working Paper, University of Maryland.
Calvo, Guillermo, Alejandro Izquierdo, and Luis-Fernando Mejía. 2004. On the Empirics of Sudden Stops: The Relevance of Balance Sheet Effects. NBER Working Paper 10520.
Chinn, Menzie, and Hiro Ito. 2006. What Matters for Financial Development? Capital Controls, Institutions and Interactions. Journal of Development Economics, 81(1), pp. 163-192.
Detken, Carsten, and Vitor Gaspar. 2004. Fearless Floating: Maintaining Price Stability in a Small Open Economy. Mimeo, European Central Bank.
European Bank for Reconstruction and Development. 2006. Transition Report 2006.
Freytag, A.. 2002. Accession to EMU and Exchange Rate Policies in Central Europe - Decision under Institutional Constraints. Bank of Estonia Working Papers No 2002-1.
Grogan, Louise, and Luc Moers. 2001. Growth Empirics with Institutional Measures for Transition Countries. Economic Systems 25, 323-44.
Hauner, David. 2005. A Fiscal Price Tag for International Reserves. IMF Working Paper 05/81, Washington DC.
Hausmann, Ricardo, Ernesto Stein and Ugo Panizza. 2001. Why Countries Float the Way They Float. Journal of Economic Development 66, 387-414.
Ho, Tai-kuang, and Jürgen von Hagen. 2007. “Money Market Pressure and the Determinants of Banking Crises. Journal of Money, Credit, and Banking. International Monetary Fund. 2003. World Economic Outlook. Washington DC:
international Monetary Fund.
International Monetary Fund. 2007a. Reaping the Benefits of Financial Globalization. IMF Discussion Paper, No. 06/07, Research Department, Washington:
International Monetary Fund, June 2007.
International Monetary Fund. 2007b. Managing Large Capital Inflows. World Economic
Outlook, October 2007, pp. 1-29.
International Monetary Fund. 2007c. The Quality of Domestic Financial Markets and Capital Inflows. Global Financial Stability Report ,Octoberpp.77-109, Washington DC: International Monetary Fund.
Jonas, Jiri. 2004. Comments on Jürgen von Hagen, Fiscal Positions and Sustainability – Policy Challenges for EU Accession Countries. IMF-CNB Conference on Euro Adoption, Prague, February 2004.
Kaminsky, Graciela, and Carmen Reinhardt. 1999. The Twin Crises: The Causes of Banking and Balance-of-Payments Problems. American Economic Review 89, 473-500.
Kose, M. Ayhan, Eswar Prasad, Kenneth Rogoff and Shang-Jin Wei. 2006. Financial Globalisation: A Reappraisal, IMF Working Paper 06/189.
Kopits, George. 2000. How Can Fiscal Policy Help Avert Currency Crises? IMF Working Paper 00/185.
Lane, Philip.R.and Gian Maria Milesi-Ferretti. 2006. The External Wealth of Nations Mark II: Revised and Extended Estimates of Foreign Assets and Liabilities, 1970-2004, IMF Working Paper 06/69.
Lane, Philip.R., and Gian Maria Milesi-Ferretti. 2007. Capital Flows to Central and Eastern Europe. Emerging Markets Review, Vol. 8, Issue 2, 106-123.
Lipschitz, Leslie. 2004. Real Convergence, Capital Flows, and Monetary Policy: Notes on the European Transition Countries. Mimeo: IMF.
Lipschitz, Leslie, Timothy Lane, and Alex Mourmouras. 2002. Capital Flows to Transition Economies: Master or Servant? IMF Working Paper 2/11, IMF. Miniane, Jacques. 2004.A New Set of Measures on Capital Account Restrictions. IMF
Mody, Ashoka, and Antu Paninin Murshid. 2005.Growing Up with Capital Flows.
Journal of International Economics, Vol. 65. No. 1, pp. 249-66.
Mohanty, M. S., and Philipp Turner. 2005. Intervention: What are the Domestic Consequences? BIS Papers 24. Basle: BIS.
OECD. 2004. Economic Survey of the Slovak Republic. Paris: OECD.
Quinn, Dennis. 2003. Capital account Liberalization and Financial Globalization, 1890-1999: A Synoptic View. International Journal of Finance and Economics, vol. 8, no. 3, pp. 189-204.
von Hagen, Jürgen and Jizhon Zhou. 2004. Exchange Rate Policies on the Last Stretch.
In Monetary Strategies for Accession Countries, edited by Györgyi Szapari and
Jürgen von Hagen. Edward Elgar.
Von Hagen, Jürgen and Iulia Traistaru-Siedschlag. 2006. Macroeconomic Adjustment in the New EU Member States. SUERF Studies No. 2006/4. Vienna; The European Money and Finance Forum.
Table A1: Managing Capital Flows: The Experience of Central and East European Countries
Country
Exchange rate regime (de facto)
Pace and sequencing of capital account liberalisation Episodes of large net private capital inflows Predominant types of capital
inflows
Policy responses
Bulgaria Currency Board since 1997, independent floating before 1997
Gradual.
Current account convertibility (IMF, Art VIII): September 24 1994.
1992-1993, ongoing since 1997
FDI, Portfolio debt
Czech Rep. Fixed exchange rate until 1997; since 1998 managed floating with no
predetermined path for the exchange rate
Fast.
Current account convertibility (IMF, Art VIII): October 1, 1995. With the exception of some outflows, almost all controls removed by 1995. FDI liberalized first.
Inflows liberalised before outflows. Outflows by non-residents fully
liberalised in 2001. Five-year program to eliminate controls in outflows in the context of accession to OECD 1995-2001. 1994-95, 2000-02 FDI, Portfolio debt, Portfolio equity
Expansionary fiscal policy. Interest rate policy, inflation targeting.
Fiscal consolidation remains the biggest challenge to Euro adoption
Estonia Currency Board since 1992 ERM-2 since 28 June 2004
Fast.
Current account convertibility (IMF, Art VIII): August 15, 1994. Almost all controls removed by 1994. Pension funds investments last to be
1996-98, ongoing since 2005 FDI, Portfolio debt, Portfolio equity
liberalised
Latvia Fixed peg to SDR until the end of 2004 and to the euro since 1 January 2005 ERM-2 since 2 May 2005
Fast.
Current account convertibility (IMF, Art VIII): June 10, 1994. Real estate and pensions funds' investment last to be liberalized.
1994-95, ongoing since 2005
FDI, Portfolio debt Fiscal policy used to offset effect of capital inflows
Lithuania Currency Board since 1994 ERM-2 since 2 8 June 2004
Fast.
Current account convertibility (IMF, Art VIII): May 3, 1994. Real estate and pensions funds' investment last to be liberalized.
1997-98, ongoing since 2005
FDI, Portfolio debt Fiscal policy used to offset effect of capital inflows
Hungary Pegged exchange rate with horizontal bands since 1995
Gradual.
Current account convertibility (IMF, Art VIII): January 1, 1996. FDI liberalised first. Long-term flows liberated before short term flows. OECD
1991-2000, 2005 FDI, Portfolio bond (sovereign), Bank lending (short term)
Macroeconomic stabilisation following 1995 crisis.
Loose fiscal policy meant burden of disinflation placed on tight monetary policy.
Fiscal consolidation remains the biggest challenge to Euro adoption
Poland Independently floating from 2000; crawling floating previously to this.
Gradual.
Current account convertibility (IMF, Art VIII): June 1, 1995.
Long-term flows liberalised before short-term flows; inflows before outflows; FDI and portfolio before financial credits. Liberalisation sped up during OECD accession negotiations.
1995-2000 FDI, Portfolio bond, Portfolio equity, Bank lending
Loose fiscal policy meant burden of managing disinflation placed on tight monetary policy.
Fiscal consolidation remains the biggest challenge to Euro adoption
Romania Managed floating with no predetermined path for the exchange rate since 1991
Gradual.
Current account convertibility (IMF, Art VIII): March 25, 1998.
1990-93, 1996-98, ongoing since 2004
Slovak Rep Fixed exchange rate until 1998; pegged exchange rate within horizontal bands ERM-2 since 28 November 2005
Gradual.
Current account convertibility (IMF, Art VIII): October 1, 1995. Long-term flows liberalised before short-term flows; inflows before outflows; FDI and portfolio before financial credits. Most restrictions eliminated to meet EU requirements. OECD accession was an important anchor.
1996-98, 2002, 2005
FDI, Portfolio debt, Portfolio equity
Loose fiscal policy lead to large current account deficits.
Fiscal consolidation remains the biggest challenge to Euro adoption
Slovenia Heavily managed float Independently floating previously
Joined the Euro are in 2007
Gradual.
Current account convertibility (IMF, Art VIII): September 1, 1995. After having introduced capital controls in 1995-99, credit operations liberalised first. Long-term flows liberalised before short-term flows. Portfolio flows last to be liberalised.
1997, 2001-02
FDI, Portfolio debt Fiscal policy used to offset effect of capital inflows
Sources:
Table A2: Regulatory Framework for Capital Transactions, 31 December 2006
BG CZ EE HU LV LT PL RO SK SI
Capital transactions
Controls on:
Capital market securities 1 1 1 1
Money market instruments 1 1 1
Collective investment securities 1 1 1 1 1
Derivatives and other instruments 1 1
Commercial credits
Financial credits 1 1 1
Guarantees, sureties, financial backup facilities 1
Direct investment 1 1 1 1 1 1 1
Liquidation of direct investment na
Real estate transactions 1 1 1 1 1 1 1 1 1 1
Personal capital movements 1 1 1 1
Provisions specific to:
Commercial banks and other credit institutions 1 1 1 1 1 1 1 1 1
Institutional investors 1 1 1 1 1 1 1 na 1 1
Total restrictions 3 9 4 7 5 5 11 2 6 5
1: the specified practice is a feature of the exchange system na: data not available at time of publication
blank: the specific practice is not regulated