THE FINANCIAL ASSETS OF
HOUSEHOLDS IN IRELAND
Copie, s of this paper may be, obtained fi’om The Economic and Social R~wm’ch Institute (Limited Company No. 18269). Registered Office: 4 Burlington Road, Dublin 4.
Price IR~I 2.00
TH~ FINANCIAL ASSETS OF
HOUSEHOLDS IN IRELAND
Patrick Honohan and Brian Nolan
1
© THE ECONOM IC AND SOCIAl. RESEARCH INSTITUTE DUBLIN, 1993
Acknowledgments
The authors are grateful to AIB, Bank of Ireland, Ulster Bank and Woodchester-Credit Lyonnais for their financial support for this work through their fnnding of the Banking Research Centre in the ESRI.
Without implicating them, we would like to acknowledge our indebtedness to the following for nsefill discussions and comments: Terry Baker, Lorcan Blake, Tim Callan, Aidan Cassells, John Creagh, Eoin Fahy, John Fitz Gerald, Feargal (5 Brolchfiin, John O’Mahony, Diarmuid Sugrue, the Department of Finance and an anonymous referee; to Philip Hammill for excellent research assistance, and to Mary McEIhone for editorial assistance.
A cknowledgwtent.~
General S~tmmary
Chapter
l Introduction
2 Wealth and Financial Assets
3 The Sample
4 The Pattern of Household Portfolios
5 Modelling the Portfolio Choice of Hottseholds
6 Economic Significance of tile Estimates
7 t-lousing in the Household Portfolio
8 Other Assets: Debt, Current Accounts and Assurance
9 Conclttding Remarks
Annex 1: The Qttestionnaire
Annex 2: Definitions of Variables
Regression Tables
Regression Figures
Refertmce~
Page
iv
1
4
10
17
33
40
46
57
75
77
81
83
90
94
Tables 3.1 3.2 4.1 4.2 4.3 4.4 4.5 4.6 4.7 7.1 7.2 7.3 7.4 8.1 8.2 8.3 8.4 8.5 8.6
LLS’T OF TA BIA£S
Financial Assets Reported in ESRI Sample Compared with Independent Estimates
Underrepordng of Financial Assets in Sample Surveys
Household Financial Assets
Types of Asset
Specific Assets
Disposition of Financial Wealth by Income Decile
Financial Asset Holdings: Sample Deciles
Sophisticated Assets: Pattern of Asset Choice
Financial Asset Holders: Pattern of Asset Choice
Composition of Wealth Holdings by Income Decile
International Owner-occupancy Rates
Owner-occupiers by House Value
Percentage Owner-occupiers, Mean House Value and Outstanding Mortgage by Current Income Decile
Cttrrent Accounts
Current Accounts by Household Type
Term Loans and Hire Purchase Agreements
Life Assurance-linked Savings
Disposition of Gross Financial Weahh by Income Decile
Financial Liabilities by Income Decile
Regression 7hbles
A Allocation betnveen Financial and Other Wealth
B Allocation between Basic and Sophisticated Assets
C Allocation of Sophisticated Assets
D Allocation between Financial and Other Wealda (Wide Series)
E Allocation between Basic and Sophisticated Assets; tMssurance and Current Accounts
F Influences on Debt
G The Share of Housing
I’(lg~ 83 84 85 86 87 88 89 FigTtre 4.1 4.2 4.3 4.4 4.5 4.6 4.7 4.8 4.5 4.5
LIST OF FIGURES
Financial Assets by Income Decile: Mean and Median Holdings
Financial Assets b)’ Income Decile: Percentage Reporting
Sophisticated Assets by Income Decile: Mean and Median Holdings
Sophisticated Assets b), Income Decile: Percentage Reporting
Financial Assets by Age-group: Mean Holdings
Financial Assets by Age-group: Percentage Reporting
Financial Assets by Labour Force Status
Sophisticated Assets by Labour Force Status
Financial Assets by Socioeconomic Group
Financial Assets hy Termre of l-tome
Regression Fig~tres
R1
R2
R3
R4
R5
R6
R7
Share of Financial Assets in Total (OLS Model)
Share of Financial Assets in Total (Tobit Model)
Share of Sophisticated Assets in Total
Share of Basic Assets in Total
Share of Equities in Sophisticated
Computed Relative Risk Aversion (OLS Model)
Computed Relative Risk Aversion (Tobit Model)
Page
9O
9O
91
91
92
92
93
Charts
1
2
Decision Tree for Portfolio Allocation
Decision Tree for Wider Concept of Financial Assets
35
72
GENERA L SUM2VIAR I,"
Tiffs paper describes how different types of household allocate their financial assets. We look at hot~sehold characteristics such as wealth, income, age, sex, and socio-economic group and at financial assets from bank deposits and Government savings schemes to equities and life assurance. Though wealth in the form of housing is examined, the focus is primarily on financial assets.
The study is based on a large-scale sample survey carried out during 1987 by dae ESRI which collected data on a range of economic and social variables fi’om more than 3,000 houselaolds in Ireland. Despite tile known reluctance of respondents to reveal financial assets, analysis of the data shows that this sample does provide useful information. Thus, although
the aggregate financial wealth implied by the respondents ila this sample falls well short of independent estimates of houselaold financial wealth, the sample is not materially worse in this regard than samples analysed abroad.
Furthermore, the pattern of financial asset holdings actually reported generally accords with a priori expectations. For this reason, we believe that the patterns displayed by the sample are probably indicative of the population as a whole, except for the very top of the wealth distribution.
Financial assets represent a relatively small fi’action of total householcl wealth. Housing and farmland bulk mucla larger. Of financial assets, fully
two-thirds are in the form of deposiLs at financial institutions, and three quarters in deposits or in Government small savings schemes.
Tables showing the mean and median holdings of different categories of household are provided. These illustrate the degree to which households with higher income, and with older beads, tend to hold more financial assets. The labour force status of the ltousehold is also significantly correlated with financial asset holdings: the retired have median holdings more than 10 times that of the unemployed. Among broad socio-economic groups, median holdings of the professional and managerial and the farmers are a multiple of that of the low-skill group.
Coml)aratively few houselaolds hold more sophisticated assets such as equities or bonds - indeed onl), 1 in 10 reporting hottseholds held an), of these. Furthermore even these houselaolds did not diversify into different categories of sophisticated assets. Not surprisingly, hotJseholds with sophisticated assets tended to be in the higher income categories, with
THE FINANCIAL ASSETS OF HOUSEHOI.D5 IN [REI~uND
median income 50 per cent higher than the rest. Also their total financial asset holdings were ranch higher in relation to their income.
In addition to analysing die way in which average boldings of different types of financial assets vary across households of different t)q~es, time study attempts to distinguish between dae explanatory role of different factors using multiple regression techniques. These suggest that both time level of weahh holdings and of income are important and independent influences on portfolio composition. Broadly speaking, wealthier households hold less of their assets in financial form. Ftwthermore, among financial assets, riley hold a lower proportion of bank deposits and small savings; and a higher proportion of equities and bonds. The influence of income (as distinct from weahh) varies witb age; except for hottseholds wida young heads, higher income is associated with greater emphasis on bank deposits and small savings.
Housing invesunent, though undoubtedly influenced by other factors, also has a financial ,aspect. In particular, we fincl dlat households facing a higher marginal income t,-Lx rate borrow more to pay for more vahmble houses. This is nndoubtedly related to time favourable tax treatment of home mortgages.
There is also an analysis of overdrafts, term loans and recurrent premium life ~ssurance contracts. The latter do not appear to be treated as close substitutes for otber financial assets.
Chal)ter 1
IArI’ROD UCTYON
Tbis paper presents new information about tile composition of tile asset portfolios of households in Ireland. Our focus is on financial assets, but we do have some material on housing wealth. The paper does not refer to pension wealth.
Tile management of household financial portfolios has become considerably more sophisticated in recent years as financial institutions have competed much more actively for resources. Generally higher rettlrns, and other characteristics including tax advantages, and a fuller [nent~ of risk-and-return combinations, have characterised tile range of savings products offered to laouseholds. While participating financial institutions tllemselves are able to form some picture of the profile of their own customers, there has not been any systematic overall study of tile portfolio choices of laouseholds in h’elaJld.
2 THE FINANCIAL ASSI’YI’S OF HOUSEHOLDS IN IRELAND
This paper reports tile findings of a study on the patterns of portfolio choice of Irish households. To (late little has been known about how household financial portfolios vary with household characteristics such ,"ks wealth, income, age, sex, and socioeconomic groul). This study provides an opporttmity to explore these matters in some detail. Though we do treat housing wealth briefly, our focus is almost exclusively on financial assets and we do not use data on pension wealth.
The study is based on a large-scale sample survey carried out during 1987 by the ESRI. The survey collected a mass of information concerning income, expenditure, labour force status, occupation and industry, education, assets, use of State services and a variety of measures of attitudes, lifestyle and physical and psychological health, for some 3,294 households. Much of the data collected in this study on matters other than financial holdings has already been analysed and reported,2 and tile sample has provided a fi’amework for anal}~ing the impact of policy actions in a variety of fields.’s
Although the total financial wealth reported by these households turns out to fall well short of independent estimates, tile sample is not materially worse in this regard than samples analysed abroad. Furthermore, the pattern of financial asset holdings actually rel)orted generally accords with a priori expectations. For this reason, we believe that the patterns displayed by the sample are probably indicative of the population as a whole, except for tile very top of the income distribution.
In addition to presenting a number of cross-tabulatlons, showing how average holdings of different types of financial assets vary across households of different types, we attempt to model portfolio selection using multiple regression techniques. It should be pointed out right away that we do not include any information on I)ension wealth in this study.
To give a flavour of the results, these suggest, for example, that both wealth holdings and income are important influences on portfolio composition. Broadly speaking wealthier laouseholds 11o1(I less of their assets in financial form.4 Furthermore, among financial assets, they hold a lower proportion of bank deposits and small savings; and a higher proportion of equities and bonds. The influence of income (as distinct fi’om wealth) vmies with age; except for households with young heads, higher income is mssociated with greater efiaphasis on bank deposits and small savings.
’2The first majo," report was Callan. el al. (1989), which contains, in Chapter 4. the basic detailed account of the methodolog3’ used ira collecting the sample.
Two recent exam pies arc Callan ( 1991 ) and Nolan ( 1991 a).
Exam-i’nation of portfolio composition can throw light on the degree to which households are risk averse, and how this risk aversion varies with wealth. The data available to us are not rich enough to allow definite conclusions here, but we illustrate how these questions can be addressed, and obtain the tentative conclusion that risk aversion (measurccl by the coefficient of relative risk aversion) probably declines with weahh, a finding that has implications for the impact of t,xx policy on risk-taking.
The presentation of our findings is influenced by the fact that, for a variety of reasons, some financial assets held b), households must be treated separately from the others. For one thing, recurring premium life assurance policies represent a financial asset, but one which households appear to treat differently from the rest. Another special area is houselaold current accounts and borrowing: ottr data here seem likely to combine accounts that are essentially business relatecl with those truly related to household activities. As already mentioned, pension weahh is an important component of weahh, but it is not one on which our data set can throw mucla light.
Chapter 2
I4q£AL7"I-I AND FhVANCIAL ASSETS
7),pe~s" of Wealth and Thei’r I-lold~;t~"
This paper is chiefly concerned with financial assets. In considering the findings it is important to bear in mind that these represent only a small part of dae tTpical household’s aggregate wealth. In addition to financial assets, the household wealth can take the form of ownership of a business (for example a farm enaterprise or a shop), a house, land and other tangible property or intangible property (patents and the like). To dlese may be added the hottsehold’s stock of hunaan capital, i.e., the present equivalent vahte of the stream of labotu" income which the naembers of the household can expect to earn in the flttun’e. Household borrowings need to be netted from wealth holdings in order to arrive at a net wealth on- net worth concept.
Incorporated businesses also have wealth holdings, though households generally hold an indirect claim on most of business wealth throttgh ownership of equities and other financial assets. Government wealth holdings are also important, and it has been observed that these too have an impact on houselaold spending power through the services they provide, or hy redttciog the tax burden that might odterwise be levied. By concentrating on houselaold financial assets here we avoid some of the complex issues of who the ttltimate beneficiaries of business and government wealth holdings are. Note however that (althottgh not covered in this paper) hottseholds also have quantitativel), important pension rights,5 effectively representing a Wpe of quasi-financial claim on a pension
WEALTH AND FINANCIAL ASSET"S 5
fund which, in turn, holds financial and other assets to meet these claims
ill due COUl’Se.6
Financial Assets in h’eland
The main h’ish financial assets~ held by h-ish households are (1) currency and deposits with tile banks, building societies and silnilar institutions,8 (2) Government small savings schemes, (3) other Government securities, (4) shareholdings ill enterprises, (5) claims on life assurance companies on foot of savings-related scllemes,t~ This is tile broad
classification which we follow throughout the paper. There are also fixed interest claims on enterprises (including semi-state bodies), but, though these have grown in recent years, they were small ill 1987, the year to which this study refers. In addition, Irish households have claims on tile
vest of the ~1orld.10
c~rhc queslion of evaluating Ihe role of pellsion funds in saving :rod asset ;iccUmlllallon has generaled a large internalional lilcl’;llure, a ftdl review of which is heyond the scope of this paper. A useful stn’,,ey of the issues, providing fin’ther references is Bodie (1990). who points out that occupatic+nal pension schemes serve as incentive devices in the labour
nlal-kc[ 3s well ,’IS rellecling aspecls of corporate tax pl~nlling. The pl’cdonlin~nc~ of defined benefit (as ol)posed to defined contribution) ~hemes suggesl that Ille u~dil.ional perspective, which argues that file cbief role of pensions is to provide insurance againsl longevity and investmenl risk, is correct. For high income households which have file discretion to make addition;~l pension fund contributions, these m;~y be importanl investments at the margin. \~qlether pensions (or social securily) ;u’e substitutes for liquid fornl$ of saving is hotly disputed, though in the case of individual reLircment accotmLS in the US the subslilulabilily appears low (Venti and Wise. 1990).
7For account~ of the h’ish financial s vstem and its evolution see Bourke and Kinsena (1988). McGo~nm (1990).
8Such as the Post Office and Trustee Savings Bank.s (POSB an(I TSB), the Govenament-owned specinlised hanks ACC and [CC. and the Credit Unions.
9Bcc;luse of good hefore tax retUl’llS, as well as favol/rable lax treatment, life aSStll~lnce companies wcle able to attract considcl’able savings. In addilioll to lhe IraditJonal
elldowment ;~ssurance, offering a pa)’lnenl al a certain flltUre date. or belbre if the insured person dies, and bought through periodic premium payments, life asStll’allcc related savings have been a~.qilable through a single "premium payment" offering either a return linked to the performance of a inanaged investlnent [kind (’ullit-linked bonds") Ol- a fixed income or capital appreciation (’guaranteed bonds").
6 THE FINANCIAL ASSETS OF HOUSEHOLDS IN IREI2%ND
Not all of the assets outstanding under dae above headings are directly held by households. For example, enterprises are important holders of bank deposits; assurance companies and pension flmds are important holders of Government securities and company equities. In most cases, only rough estimates are available concerning the proportion of these assets held by households.
Several studies have appeared to explain the evolution of aggregate outstanding amounts of various financial assets in h’eland. Browne and Honohan (1988) in particular explained trends in bank and building society deposits, and bank lending, on the basis of interest rate differentials. But the data used did not allow any sectoral breakdown. Browne (1988) and Thorn (1990), among others, have studied the evolution of mortgage lending.
The Intersectoral Fiord of Funds
By acquiring financial assets, households with a surphts of income over desired expenditure transfer purchasing power to households with a deficit, to dxe Government, or to enterprises. The financial assets acqtfired may direcdy represent the liability of the ultimate user of the funds (as in dm case of shareholdings in a company) or that of a financial intermediary which in turn will lend to the ultimate user of funds (bank deposits). The Government is both a final user of funds and an important financial intermediary in that it onlends a significant~l portion of its borrowings.
This intersectoral flow of fimds in h’eland has been described and quantified in a number of studies over the years (Dowling, 1973; Honohan, 1982b; O’Connell, 1986; Honohan, 1992, 1993); data for most of the OECD countries appears in United Nations (1991), and for a selection of developing countries in Honohan and Atiyas (1993). No systematic study of the aggregate claims outstanding between sectors has been published for h’eland (for the UK see Revell, 1967; for other countries see the World Bank, 1989).
Scope of the Present Stu@
This paper is concerned with examining how hottseholds allocate wealth as between financial and non-financial assets, and how their financial weahh is apportioned between different categories of financial assets. A given hottsehold will make these choices on the basis of a variety
~’,~I;I’H AND FINANCIAL ASSI’STS
of considerations, not all of which will be evident fi’om the sample survey data. As a result, only a small proportion of the variations between the portfolios of different households can be explained by measured characteristics.
The economic theory of household saving behaviour emphasises the desire to smooth consumption over the life-cycle and over transitory shocks in income, as well as the desire to make bequests, as important determinants of saving. The form in which household assets are held will depend on characteristics of expected after-tax return, risk, liquidity and transactions costs. Different assets present a trade-off between these characteristics to which hottseholds will respond depending on their particnlar circumstances. Thus households which are more risk-averse will tend to choose less risky assets; households which are liable to flttctuations in their income will choose assets with high liquidity; wealthy households will be prepared to incur fixed transactions costs involved in holding a greater variety of assets, or more sophisticated assets.12
Although the wealth variables that we use clo include housing, farmland and the value of businesses, we focus mainly on financial assets. It is likely to be easier to explain or model household choices between different financial assets than the allocation of their wealth between financial and financial assets. For one thing, measurement of non-financial wealth is considerably less reliable than non-financial wealth, especially for human wealth (i.e., the present value of future earnings potential). Furdaermore, households may experience some constraints in reaching the desired balance between financial and non-financial wealth. To begin with, much of non-financial wealth may not be readily sold, or mortgaged: this is likely to apply to much of human wealth, as well as the value of small businesses owned. Likewise, households may experience borrowing constraints so that it may not be possible for d~em to achieve the portfolio structure they would like to have. Finally, investing in many types of non-financial wealth, including owner-occupied homes and human capital, is done in order to obtain non-financial benefits.13
These considerations also explain why we look not only to the households net wealth as a scale variable in explaining the portfolio, but also to financial wealth and income.
I’-’lnertia and t~nsactions cos~ will inhibit households fi’om reaching a theoretically ideal portfolio, bm Ihc systematic tendencies we have described should appear on avct.~ge.
THE FINANCIAL ASSETS OF HOUSEHOLDS IN IREIJ~NI)
We focus in particular on the choice between two classes of financial assets, which we term "basic" and "sophisticated" assets respectively. The basic, or traditional, assets comprise deposits and small savings; the sophisticated assets are the others - Government securities (gilts), equities and "bonds".]4 The labels basic and sophisticated could be questioned, but tbey are probably more precise than alternative ways of summarising the differences such as riskiness or liquidity (thottgh in Chapter 6 we will use a
"riskiness" interpretation).
In summary then, the wealth of the household (as defined), together with its current income and the tax rate it faces, should help to explain its financial portfolio on the basis of variations in the honsehold’s willingness and capacity to absorb risk, and on the after tax returns presented to it by different savings media. As a household passes through its life-cycle it may be expected to go successively through periods of accumulation and then decumulation of financial assets, with the greatest stock of assets just before retirement of the household head. In addition, households may differ in their willingness to save (rate of time-preference) and risk-aversion, depending on measurable socioeconomic factors.15
Comparison with h~ternational EmpiT~cal Literature
The international empirical literature on the composition of household portfolios can usefitlly be divided into three categories based on whether the studies nsedata on a single cross-section (as here), or on a time series (including a time series of eros~sections or panel data). Most of the recent literature focuses on the latter, and is concerned with estimating the sensitixdty of the aggregate portfolio to changes in yields, covariances or other varying aspects of the external environment.16 Obviously, that part of the literature is not closely related to the present study.
There is a series of important descriptive papers on the US Survey of Consumer Finances, beginning with Projector and Weiss (1966), and including Avery et al. (1984a, b, 1988), Avery and Elliehausen (1986) and Kennickell and Shack-Marquez (1992). These data have been used as the basis for several of the econometric studies.
14These "bonds" (i.e., guaranteed income or growth bonds, or trail-linked honds are those reported in Question 8 from the list presented in Chapter 3 below.
l’~ln other words households" intertempol~.l utility fimctions may x~r). systematically with observed characteristics.
V~nvSAl~rl-I AND FINANCIAL/..SSETS 9
Among the small collection of econonletric papers dealing with a single17 cross-section, Uhler and Cragg (1971) focused on the fact that many households were incompletely diversified, i.e., that they held only a subset of all possible categories of financial ,asset. Their approach to this problem was to estimate equations predicting the degree of diversification, as well as equations predicting the various asset demands, conditional on degree of diversification.
Friend and Blume (1975) noted that portfolio conaposition could throw light on risk aversion, in that a more risk averse household would tend to hold a riskier portfolio. They grouped ,assets into three risk classes and, using data on average return and risk in the market, estinmted both
the average degree of risk aversion and how it varied with wealth for their sample of US households in 1962.
T~Lxation did enter into Friend and Blume’s anal),sis, but it is cenual to Feldstein’s (1976) paper, which was also based on the 1962 survey. He estimated the responsiveness of portfolio shares to a household’s t~xable
income and t:hus to its marginal tax rate. Even though he only had one cross-section, the fact that marginal tax rates vary among houselaolds allowed Feldstein to infer (under fairly su’ong assumptions) the elasticity of demand for different assets with changes in their relative net )’ield. He found relativel), high t,’ux and afortiori rate of return effects.
Two other papers should be mentioned. Shorrocks (1982) presented estimates of the sensitivity of portfolio composition to age and wealth, using data drawn fi’om estate dttty files (i.e. fi’om the composition of portfolios measured at death). King and Leape (1984) can be seen as an attempt to combine the concern of Feldstein with taxation with the attention given by Uhler and Cragg to incomplete portfolios; it provides probably the most comprehensive fi’amework for econometric analysis of this wpe of data.
Chapter 3
THE SAMPLE
The Samp&d Households
The sample comprises 3,294 households who were interviewed during 1987. These were drawn from a larger sample of whom 1,246 households refilsed declined to be interviewed and 598 households could not be located or interviewed for 8on]e odler reasoll. This non-response rate, somewhat
higher daan normal for ESRI surveys, is not out of line with US experience with income and wealth surveys. Tile sample has been reweighted to correct for non-response bias. Some 205 households have to be omitted fi-om the data in the present paper because they refnsed to answer questions on asset holdings18 That leaves us with 3,089 observations.
That the ESRI salnple is a representative one has been verified by comparing tile responses with independent information about the population along a number of dimensions - composition by age and sex, number of honsehold members at work in different occupational and industrial sectors, range of taxable income, use of State health services among others. It was dlis good experience with tile sample ill other fields which encouraged us to extend the analysis into the structure of financial asset portfolios, despite the knowledge that responses to questions concerning wealth are known to pose particular problems in tills kind of survey.
The Questionnaire
Tile questions on savings and assets included ill the survey came at the end of a lengdW questionnaire. There were twelve questions, some of them broken into sub-sections as set out in Annex 1. Apart fi’om Questions Nos. 1 and 10, these t~sked about the current ~due of various assets. The twelve questions related to:
1. Income fi’om deposits with financial institutions and fi’om Govern-men t savi rigs schemes.
18These missing 205 households were widely distributed in terms of incollle, but about 30 pel-cent were from the two highest income deciles (Nolan, 1991b).
THE SAMPLE ] ]
2. Deposit balances with financial institutions. Respondents were asked separately about (a) building societies, (b) POSB and TSB,
(c) deposits other than "cheque book accounts" wida banks, ACC, ICC and credit unions, etc.
3. Savings Certificates19 and Index-linked Savings Bonds..-’° 4. National Instalment Savings.21
5. Prize bonds.
6. (a) Government and other official stocks; (b) "Shares and securities".
7. Odmr investmenks held on I)ehalfofchilch’en.
8. "Once-off or lump-sum investlnents in deposit or investment I)onds, guaranteed income I)onds, growth bonds, or other unit-linked funds".
9. Land or property other than principal residence. 10. A question on gifts and inheritances received. I1. Current (cheque-book) accounts.
12. Other property or savings not ah’eady mentioned.
In addition, other sections of the questionnaire elicited other relevant irlforlnation concerning residential property, life assurance, and borrowings.
19Saviilg$ tel’lificatt:s are a Oovt:l-nnlenl-gtlal]inlf:ed savings me(lillln bearing I~l.~’flIC[~
interest. Interest is accrued half-,vearl), and the I~ttc of interest increases slightly the longer the certificatt: is held. [ntel’eSl 17, tes al’e Iqxed at the time of investment; these nltes al’e not adjusted for new inveslincnt.s as fi’equcnt[y as is the ease with bank :lnd building society deposils; a change in the tn, tes is referred to :is a new "issue" of ~lvings cei-tific:lt~s. T)’pieally the inlerest ),ields on savings certificates have tended to be sel so that thcy are roughl), equi~t[enl fi)r a slandard iilcome tax i~tt~: payer to the ncl i~te on buildii~g socie~ deposit; this is also trtte (becausl3 of tile i-~lention tax t~tl deposit interest) for most zero-r~lte laxpayers, o1" for p~rsons who do not declai’c inll2rest incofilc to the I:tx aulhorili~s. For those paying a higher t=ttt: of income tax the savings certilqcate offers a higher net yield. The maximum h.lding of a given issue of savings cerlificates in 1987 was £25.000 (1993: £40,000) per person. Cci’tificalcs nlav bc cashed :it any time, but with a dcla), of seven working da)’s.
~Savings bonds differ onl), slighlly from savings certificates: they may be bought only in multiples of £50: interest accrtles monthly (bill no interest is pa)’able if the bond is encashed within the first year); and thcl-e is :ill inflation-proofing guat-antee. The ceiling on holdings in 1987 w~ls £25,000 ( 1993: £40,000).
12 THE FINANCIAl, ASSETS OF I’IOUSEHOLI)S IN IREI~"~NI)
Chapters %6 anal)~e the answers given to Questions 2-8 above and thus foctts exclusively on financial assets. Within this class there are at least three noteworthy omissions: currency, current (cheqtte-book) accounts and recurring premium life-assurance related assets.
Currency is not inclucled; no question was asked in the survey about currency holdings.
Current accounts are excluded from the analysis of Chapters 3-6. Interpreting tbe answers given about cheque-book accounts is complicated by several factors. For one tbing, many self-employed appear to use one account for both business and personal purposes: dais makes it difficult to infer what are to be regarded as housebold holdings and what part of the current assets of the business. For another, the sharp fluctuations in current account balances and tbe uncertainty surrounding uncleared cheques make aggregation especially trick),.
Though item 8 above covers single premiun~ assurance related savings, it does not refer to tbe value of life assurance assets based on recurring premittms. The survey did include questions which should allow inferences about the value of assets based on savings-related lift assurance policies, and tbis is discussed in Chapter 8. Financial liabilities are also left to Chapter 8.
It is important to note that tbe total wealth variable which we use (in analFzing tile portfolio choices) includes (as well as financial assets) wealth in the form of land and property (inchtding farmland) and the value of business owned by the self-employed. Except in Chapter 7 (where we are specifically interested in the mortgage debt) tbe total wealth variable is net of mortgages owed by owner-occupiers and debt owed by farmers.22
Elmnents of Wealth Omitted
It is worth stressing that important types of :asset holdings that are not covered by this study.
First, business wealth, and other assets held in tbe form of property (otber than the principal residence) are not included, because of our focus on financial ,assets. Data obtained for the 1987 sample on the value of farm land and other business wealth have been anal)~ed elsewhere (Nolan
199119). We do inchtde a discussion of residential property, the most important form in wbicb non-bunmn wealtb is held, in Cbapter 7.
THE SAMPLE 13
Second, we do not covet" pension entitlements payable on retirement though these constitute an important asset for many employees. Tile 1987 sample obtained information suggesting that about half those who were working as employees when sampled bad such entitlements associated with
tbeir job. Methods of valuing such et~titlements to obtain a more comprehensive picture of the distribution of total wealth have been developed elsewbere, and it would be interesting to explore their application in an h’ish context. At the same time, the typical pension entitlement is quite illiquid and cannot easily be converted into other
forms of savings. This applies with even more force to the social security "wealth" represented by people’s entitlements to pensions and other IJenefits fl’om tbe social welfare system.
Date of Sample
A final caveat regarding the year in which the sample was taken. It is hard to say just how representative 1987 was. To take just one example, it was a time of stock market buoyancy and there was a considerable marketing effort on behalf of collective investment media. Investment patterns can change fl’om year to year, affecting portfolio shares as well as flows.
Com~.,m~ng Reported Holdings with hzdtg)endent 7btals
Grossing-up reported holdings to arrive at figures corresponding to the total population we find that, as expected, there is a sizable discrepancy between tbe reported total holdings of a number of financial assets and independent indicators of the relevant aggregates. Table 3.1 reproduces a comparison with independent estimates from Nolan (1991b).2"~ The figure of 41 pet" cent included in this table for household deposits may be on the
high side,24 though the actual percentage is unlikely to be much below 30
2:~No comparable il~depcndent estilnate of aggregate Iiouseht~h:l equity holdings (includilag foreign equities) is a~ilable; our grossed-up salnple of equip/holdings COlnCS to about 40 per cent of the eslimate of household holdings of h’ish Colnpany securities
presented in Honohan (1992).
24The grossed-up sample total is £2.06 billion which is compared with an external total of £5 billion prol)osed in Nolan (1991b). The external total was arrived al by taking 40 per cent of resident deposit accounts in licensed banks (0.4 times £6.5 I)illion = £2.6 billion;
14 THE FINANCIAL ASSE~I’S OF HOUSEHOLDS IN IRELAND
[image:24.518.70.427.168.285.2]pet" cent. The proportion for Government securities and small-savings schemes is even lower: the grossed-up sample figure, is £0.36 billion, or 25 per cent of an externally estimated25 total of£1.4 billion.
Table 3. I : Financial Assets Reported in ESRI Sample Compared with Indepe.nde.nt Estimates
Glvssed-up Indepmzdent Sample
Millions of pmtnd.~ Sample Tota/s+ a.~ % 7brat
Deposit accounts* 2,060 5,000 4 I
Government obligations 357 1,427 25
of which:
Sa~fings Certs etc.** 200 901 22
National Instalment Savings 38 108 35
Prize Bonds 25 78 32
Government Securities 04 340 28
+Based on balance sbeet aggregates *At banks, building societies, POSB and TSB **Sa~4ngs certificales and index-linked savings bonds
That our sample seems to capture such a low proportion of total holdings is somewhat disappointing, but to be expected in the light of experience abroad with survey data. In fact the discrepancies are not materially larger than have been experienced by the main survey work in the US and the UK. Table 3.2 displays the comparisons that can be made with time two main US surve),s, carried out for the Federal Reserve Board in ] 963 and 1983. Only when augmented by a special non-random sample of high-income households did the 1983 FRB surve), identify a much higher proportion of time household assets.
Although sample surveys are prone to underreporting, the main alternative source of cross-sectional information which has been used in other countries - i.e., information about estates collected by the tax authorities (cf. Shorrocks, 1982) - is equal’ly problematical. While non-response is much less of a problem for time larger estates, and non-response bias may be less, estate duty tends to miss households with small wealth holdings, and of course it provides little complementary information odaer dman age and sex of the dead person.
THE S±MM PLE 15
[image:25.506.72.432.195.328.2]The source of the tmderestimate can
be
hroken clown as follows. First, ahove average asset holdings by Ca) those who refused to respond to the survey ms a whole and (b) those who refused to an.~ver the ,asset questions (non-respondents). Second, false zeros (non-reporters) for Ca) all asset items or (b) some asset items. Third, underreporting of non-zero asset holdings.Table 3.2: Underr~orting of Financial AsseL~ in Sample Suro~s
Inte~7~ationtzl C~mpaff.~on
Sdected t~sets
(Grossed-~tp sample a.~ % of ind.q~ldent estimate of total) ESRI
F[U3 FIGt3 I"RB Oxford
(1963) (1983) Augmented
I Savings Deposi~ 41 50 44 44 24-52
2 Savings Certs etc 22 57 38 40 50
3 Other Government Debt 28 2’1 29 39
4 Equities 47 46 78
All Financial tLssets 51 57 73
Notes: The two FRB studies are the surveys of the financial characteristics of consumers carried oul by the Federal Reser~,c and other agencies of the US Government in 1963 and 1983. The latter survey was augmented by a special supplementary oversampling of high-income households.
The Oxford Savings Stnwey (Hill, Klein and Su’aw, 1955) was conducted in 1953.
Asset definitions are comparahle only in a broad sense:
Oxford: lower figure is building society a/cs; higher is bank and post office 2 US suo.,eys refer to US Savings bonds.
3 US Surveys refer to Other Fedel=d Obligations 4 US Surveys: "Corpora, te Stock"
5 The high percentages for total financial assets in the FRB sut’ve)’s resuh from over-statement of some assets offsetting underover-statement in others.
US studies (Ferber, 1965; Ferber et al. 1969a and b) suggest a definite pattern of underreporting of wealth in US surveys. Based on a sample of laouseholds for whom asset infol’nlatiola was known fi’ont bank records, they report that failure to report ownership of an asset is by far the most
16 THE FINANCIAL ASSETS OF HOUSEHOLDS IN IREI~\’D
important source of error was the fact that non-respondents were much more likely to have substantial savings account balances than respondents: those with savings balances greater than $5,000 (in 1963) were twice as likely to refuse to respond as those with less than $1,000.
While we do not know if this pattern of underrepordng extends to the ESRI sample, it is worth bearing these findings in mind when interpreting the evidence in our sample. In particular, it may be best to pay more attention to households who report some holdings than to those who report none. Predicting the total financial holdings of non-reporters from an equation relating household characteristics to holdings of reporters (thereby assuming that all respondents have some holdings) results in a 50 per cent increase in grossed-up total holdings in our sample.~6 To the extent that the missing ,assets relate to non-reporters and non-respondents, results relating portfolio choice to household characteristics need not be biased if they are based on information from reporters only.27
26Furthermore, this does not make any allowance tbr the possibility that the 205 non-respondents to the asset section of the questionnaire, and the 1,246 non-non-respondents to the overall survey, could have had above-average wealth holdings.
Chapter 4
THE PATFERaV OF HOUSEHOld) PORTTOLIOS
Main Charactetqstics (Table 4. 1)
A general perspective of the characteristics of the sample is presented ill Table 4.1.
Financial assets form only about 8 per cent of total wealth (as defined here): most of remainder is either housing (55 per cent) or farmland (25 per cent). More details about the non-financial elements is contained in Nolan (1991b). Of the financial asseLs, fiflly p, qo-thirds are in tile form of deposits at financial institutions (not including current accounts or notes and coin), and three-quarters in the forms we have described as "basic".
Over two-thirds (68.7 per cent) report some financial assets. It should be recalled once more that, for present purposes, financial assets do not inclutle current accounts at banks or notes and coin. A considerably smaller percentage (56.5 per cent) report bank deposits (other than current accounts), and 45.5 per cent report small savings (e.g., Savings certificates, POSB or prize bonds). Note that this implies that two-thirds of holders of either deposits or small savings have only one or the other and not both.28
Of particular interest m-e tile tbree categories of more sophisticated assets: gilts, equities and "bonds". A rather small proportion of households report holdings of these sophisticated assets. Only 7.0 per cent of the sample reported any of them, with the greater proportion of these ha~fing equities (4.8 per cent). As shown in Table 4.6, very few households indeed hold all three categories of sophisticated asset, gilts, equities and bonds. Of those holding sophisticated ,assets, only 1 in 5 have holdings in more than one of the three categories; those who have more than one have equities and either gilts or bonds.29
2SCf. TaMe 4.7. The number of households holding different combinations of assets is set out in Table 4.6 (for the three sophisticated assets) and Table 4.7 (for basic and sophisticated ztssets).
29No household reported having both gilts and bonds but no equities.
18 THE FINANCIAL ASSETS OF HOUSEHOLDS IN IRELAND
Table 4.1: Hou.~eholdFinancialAsset.~
Basic AsseL~ Sophisticated Assets A U
Small
DqOosits Savings Any/All Gilts Equitit.~ Bonds Any~All
1 % of households 56.5 45.5 68.3 1.4 4.8 2.3 7.0 68,7
2 mean holding 4.13 0.72 3.89 7.15 10.60 15,72 13.78 5.28
3 median holding 1.25 0.03 0.98 2.00 1.35 10.00 3.00 1.25
4 median income 13.80 14.13 13.36 18.34 20.96 17.80 19.44 13.36
5 median assets 1.66 1.18 1.25 20.15 8.10 22.76 12.26 1.25
6 share of top 10% 21.8 27,9 22.5 32.1 43.7 14.5 30,3 24.4
7 share of top 2% 8.4 7.2 8.2 1,4 17.2 2.1 9.1 8.5
8 % of financial 67.0 8.5 75.4 2.9 lh5 10.2 24.6 100.0
9 % of total 5.5 0.7 6.1 0.2 0.9 0.8 2.0 8.1
Percentage of households holding this asset 2 Mean holding for holders (£000)
3 Median holding for holders (£000)
4 Median household income of holders (£000 pet annum) 5 Median financial assets of holders (£000)
6 Per cent of reported holdings held by top 10% of income distribution 7 Pet cent of reported holdings held hy top 2% of income distribution 8 Per cent of total financial assets held in this form
THE PATI’ERN OF HOUSEHOLD PORTFOLIOS 19 Table 4.2: Htmsehold AsseL~: Typea of Assets
Basit A~sets
Sophisticated Asslts All Assets % % %
holding mean ~tdian holding mean midian holding nu’an n~dian
INCOME DECILE
Bottom 49.5 2,576 410 2.4 (2,114) (570) 50.5 2,627 410 2 48.2 3,843 875 3.6 (6,608) (3,750) 48.2 4,342 915 3 51.9 2,132 625 2.i (9,750) (7,500) 51.9 2,525 635 4 56.7 2,813 625 2.7 (2,598) (350) 56.7 2,9,°,8628 5 57.4 3,170 655 4.4 15,835 2,700 58.0 4,323 675 6 71.6 2,733 875 5.0 14,862 6,000 71.0 3,771 875 7 75.0 2,926 875 4.6 6,905 1,750 75.3 3,342 875 8 80.8 3,674 1,255 8.4 I 1,565 4,000 81.4 4,846 1,282 9 80.9 5,051 1,275 12.8 14,783 4,000 81.2 7,366 1,762 Top 87.1 0,501 2,000 17.1 18,303 3,000 87.6 10,092 2,300 AGE
0-25 47.4 1,939 1,398 0.0 47.4 1,939 1,398
25-34 61.1 2,302 625 6.4 3,872 1200 61.5 2,687 630 3544 66.5 2,936 675 7.2 14,821 1,000 66.0 4,524 960 45-54 73.4 3,005 052 7.0 7,550 2,500 74.1 3,697 832 55fo4 71.5 5,020 1,255 6.8 18,748 4334 71.8 6,782 1,265 65-74 71.1 5,490 1,315 8.5 20,768 1O,000 71.1 7,980 1,568 75+ 61.2 4,850 2,000 5.8 12,828 5,000 61.2 6,067 2,005 SOCIO-ECONOMIC GROUP
Farmers 68.9 3,714 1,250 7.8 4,796 1,350 69.5 4,218 1,255 Prof/Managerial 86.1 6,520 2,000 17.2 22,796 7,250 86.5 11,024 2,100 lmermediale* 68.0 3,064 8,t0 4.8 9,409 2,500 68.2 3,717 875 Low skill** 52.6 2,823 625 2.3 9,834 1,000 52.7 3,240 625 t/~B FORCE STATUS
Retired 70.8 6,122 1,858 9.3 27,340 16,000 70.8 9,731 2,000 Self-emplo),ed 74.4 4,725 1,270 9.7 11,658 1,688 75.0 6,199 1,430 Home duties 53.1 3,719 1,035 3.6 13,830 3,400 53.1 4,660 1,055 Employee 77.7 3,049 888 7.7 7,910 2,000 78.2 3,808 I,II2 II1 49.0 2,665 475 2.0 (20,225) (20,000) 49.0 3,508 475 Unemployed 41.7 1,080 150 0.7 (6,442) (6,442) 41.7 1.185 150 TENURE
Own outright 71.4 5,144 1,270 8.7 15,904 4,750 71.8 7,034 1,375 O~¢n w/mortgage 76.1 2,786 825 7.7 10,783 2,000 76.3 3,864 900 Reined 64.4 3,295 1,362 4.1 (8,083) (8,500) 65.1 3,771 1,540 Local Authority 38.7 1,010 255 0.2 (I,200) (1,200) 39.0 1,011 260 *hllermediale non-manual and skilled nlilntla[
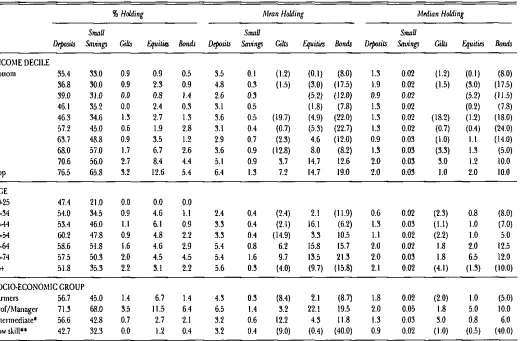
Table 4.3: Household Assets: Specific Assets
% Holding Mean HoMing Median Holding
Small Sl~ll Snu~U
Deposits Savings Gi~ F.quit~ Bonds Deposits Savings Gilts Equities Bo~ Deposits Savings Gilts t".quitir.~ Bonds
INCOME DECILE
Bouom 35.4 33.0 0.9 0.9 0.5 3.5 0.l (I.2) (0.1) (8.0) 1.3 0.02- (1.2) (0.1) (8.0) 2 36.8 30.0 0.9 2.3 0.9 4.8 0.3 (I.5) (3.0) 07.5) 1.9 0.02 0.5) (3.0) (17.5) 3 39.0 31.0 0.0 0.8 1.4 2.6 0.3 (5.2) (12.0) 0.9 0.02 (5.2) (11.5) 4 46.1 35.2 0.0 2.4 0.3 3.1 0.5 (1.8) (7.8) 1.3 0.02 (0.2) (7.8) 5 46.3 34.0 1.3 2.7 1.3 3.6 0.5 (19.7) (4.9) (22.0) 1.3 0.02 (18.2) (1.2) (18.0) 6 57.2 45.0 0.6 1.9 2.8 3.1 0.4 (0.7) (5.3) (22.7) 1.3 0.02 (0.7) (0.4) (24.0) 7 63.7 48.8 0,9 3.5 1.2 2,9 0.7 (2.3) 4.6 (12.0) 0.9 0.03 (I,0) I,I (14.0) 8 68.0 57.0 1.7 6.7 2.6 3.6 0.9 (12.8) 8.0 (8.2} 1.3 0.03 (3.3) 1.3 (5.0) 9 70.6 56.0 2.7 8.4 4.4 5.1 0.9 3.7 14.7 12.6 2.0 0.03 3.0 1.2 10.0
Top 76.5 65.8 3.2 12.6 5.4 6.4 1.3 7.2 14.7 19.0 2.0 0.03 1.0 2.0 10.0 :Z O AGE
0-25 47.4 21.0 0.0 0.0 0.0
25-34 54.0 34.5 0.9 4.6 I.I 2.4 0.4 (2.4) 2.1 (11.9) 0.6 0.02 (2.3) 0.8
35-44 53.4 46.0 I.I 6.1 0.9 3.3 0.4 (2,1) 16.1 (6.2) 1.3 0.03 (1.1) 1.0 (7.0) 45-54 60.2 47.8 0.9 4.8 2.2 3.3 0.4 (14.9) 3.3 10.5 1.1 0.02 (2.2) 1.0 5’0 5564 58.6 51.8 1.6 4.6 2.9 5.4 0.8 6.2 15.8 15.7 2.0 0.02 1.8 2.0 12.5 65-74 57.5 50.3 2.0 4.5 4.5 5.4 1.6 9.7 13.5 21,3 2.0 0.03 1.8 6.5 12.0 75+ 51.8 35.3 2.2 3.1 2.2 5.6 0.3 (4.0) (9.7) (16.8) 2.1 0.02 (4.1) (I.3) (10.0)
,,.,.
(8.0)
SOCIO-ECONOMIC GROUP
Table 4.3: Hou.whold Assets: Specific Assets - continued
% Holding
SmaU De:posits Saving~ Gilts
Mean Holding Median Holding
Small Small
Equitiez Bonds Deposits Savings Gilts Equities Bonds Deposits Savings Gilts I~uities Bonds
L~B FORCE STATUS
Retired 58.4 47.9 2.2 4.4 6.0 5.0 Self-employed 60.7 51.3 2.4 8.3 1.6 5.4 Home dudes 43.7 32.1 1.4 1.4 I. 1 4.3 Employee 06.4 52.8 0.0 5.,t 2.2 3.1
111 37.8 28.7 0.0 0.5 1.5 3.3
Unemplo)~d 30.2 25.4 0.0 0.3 0.4 1.1
1.8 8.5 22.8 23.0 2.0 0.04 3.6 0.8 15.5 0.5 5.8 10.3 8.9 2.0 0.03 1.6 1.0 5.0 0.3 (19.4) (0.4) (19.7) 1.3 0.02 (3.4) (0.2) (10.0) ~
i.$ 0.03 2.2
1.6 i.0
0.0 2.9 7.5 8.1
0.3 (0.9) (26.7) 0.9 0.02 (0.9) (20.0) 0.4 (0.2) (12.6) 0.4 0.02 (0.2) (12.6)
© TENURE
Own outright 17.8 50.1 1.9 5.6 3.4 5.5 0.9 Own w/mortgage 64.7 51.2 1.3 5.5 1.8 2.9 0.5 Private Rented 57.5 32.9 0.0 3.4 1.4 3.5 0.2 Local Auth $0.5 18.4 0.0 0.2 0.0 1.2 0. I
9.0 10.6 18.0 2.0 0.03 2.0 1.3 I 1.0 2.9 11.2 9.7 1.1 0.03 2.0 IA 7.0
(5.7) (10.0) 2.0 0.02 (7.0) (10.0)
(~.2)
0.6 0.02
(1.2)
0
*Intermediate n6n-manual and skilled manual **Semi-skilled or unskilled manual
t~
Table 4.4: Disposition of Wealth by Income Decile
Mean percentage of wealth held in Mean percentage of financial assets hem in
SmaU All Basic Deposits Savings Assets
Soph. All Fin Small All Basic Soph.
Assets Assets Deposits Savings Assets Assets ..q
Decile:
Bottom 2.9 O.1 3.0
2 7.3 0.2 7.5
3 4.5 0.4 4.9
4 5.0 0.8 5.8
5 4.7 0.7 5.4
6 5.1 0.6 5.7
7 4.7 0.9 5.6
8 5.8 0.8 6.6
9 7.2 1.2 8.4
Top 5.8 0.9 6.7
0.1 3.1 93.5 3.2 96.8 3.2
0.6 8.1 90.1 2.5 92.6 7.4
0.9 5.8 77.6 6.9 84.5 15.5
0.2 6.0 83.3 13.3 96.7 3.3
1.9 7.3 64.4 9.6 74.0 26.0
2.0 7.7 66.2 7.8 74.0 26.0
0.8 6.4 73.4 14.1 87.5 12.5
1.7 8.3 69.9 9.6 79.5 20.5
4.6 13.0 55.4 9.2 ~.6 35.4
3.4 10.1 57.4 8.9 66.3 33.7
Example: Households in the seventh decile their financial assets.
THE I’A’ITEI~N OF HOUSEHOLD PORTFOLIOS
Table 4.5: Financial Asset HoldDq(s: Samp~ Decile~
23
(In thousands *f pou rids) Financial Sophisticated
All Asset Asset
Household.v
flolders Holders
No. of hoL:seholds 3,089 2,121 217
Decile:
Bottom 0.00 0.02 1.2
2 0.00 0.10 2.2
3 0.00 0.32 4.2
4 0.03 0.63 7.0
5 0.25 1.25 12.2
6 0.65 2.00 17.5
7 1 .,t0 3.36 23.0
8 3.75 5.83 34.6
9 7.54 13.09 64.0
Top 301.90 301.90 301.9
Example: 60 per cent of all households reporl financial assets of less than £650.
Of the 2,121 households reporting any financial asset holdings, 70 per cent report less than £3,360.
Of the 217 households holding any of the "sophisticated" assels, 80 per cent report less than £34,600
Table 4.6: SophLvticated Asset.v Pattern of Asset Choice
Asset.v No. of Asset.v No. of
Held Household.~ Held Household.~
GEB 3 CEB 3
GE 19 GE* 22
G B 0 G*B 3
EB 19 *EB 22
G 20 G** 42
E 106 *E* 147
B 50 **B 72
Any 217 Any 217
Not G 175 G and/or E 167
Not E 70 G and~or B I I I
Not B 145 E and/or B 197
Only one 176 Any two 38
Note: G=Gilm; E=Equities; B=Bonds
[image:33.501.69.431.388.579.2]24 THE FINANCIAL ASSETS OF HOUSEHOLDS IN IRELAND
Table 4.7: FinancialAsset Holde~ k’atter~a of Asset Choice
Assets No. of Assets No. of
HeM Hmt.~ehol¢L~ Hebl HousehoMs
DSR 144 DSR 164
DS 876 DS* 1,040
D R 25 D*R 189
SR 18 *SR 182
D 680 D** 1.745
S 348 *S* 1.406
R 10 **R 217
Any 2,121 Any 2,121
Not D 376 D and/or S 2,111
Not S 715 D and/or R 1,773
Not R 1,904 S and/or R 1,441
Only One 1,038 Any two 919
Note: D--Deposius; S=Small Savings; R=Sophisticated
Example: 189 households reported hokiings of deposiLs and some sophisticated asseUs, of whom 25 had no small savings.
The median holding of financial assets is just £1,250, abont the same figure applying for median holdings of basic assets. The median holding of sophisticated assets is £3,000. Mean holdings, at about £5,300 for all of financial assets and £3,900 for basic assets are, of course, much larger than the medians in each case. The size distribution even among those reporting holdings is very skewed: only about 22 per cent of holders (fewer than 15 per cent of the total sample) report financial assets above the mean.a°
As might be expected, both mean and median holdings vary considerably from asset to asset, with the largest applying to unit-linked or similar bonds (median holdings of £10,000) and the smallest to small savings, where median holdings are just £25 - mean holdings about £720.
The median income for those holding sophisticated assets, at over £19,000, is considerably higher than that for all financial asset holders
(£ 13,000). The divergence is even more marked for asset holdings: median financial assets of sophisticated-asset holders is £12,000 - about ten times the median assets of all financial asset holders.
Although, as mentioned, both mean and median holdings are higher for bonds than for an), other asset category, bond holdings are less concentrated among high income households than are other assets. The
3°Furtber information about the size distribution of asset holdings is contained in
THE I~A’IT"ERN OF HOUSEI’IOI,D PORTFOLIOS 25
households of the top income decile bold only 14.5 per cent of the outstanding stock of bonds, whereas they hold as ranch as 44 per cent of equities and 32 per cent of gilts, and over 20 pet" cent of basic assets.
The size distribution of bank deposit holdings is, perhaps, of particular interest because of their laomogeneity and general importance among financial assets. These are quite concentrated, with fully one half of all household bank deposits being held by 7 per cent of tbose households t-eporting financial assets, i.e., tbose with holdings of above £15,000. One quarter of household bank deposits are held by 2 per cent of the
households, i.e., those with holdings of more than £25,000.
Brt~’akdown by 14ousehokl Characteristics (T~lbh; 4.2)
Table 4.2 presents a breakdown of basic and sophisticated assets by various household characteristics. In each case the table shows the
percentage of the households with the given characteristics reporting holdings of each type of asset, and the mean and median holdings of holders. The precise way in which these characteristics were measured is detailed in Annex 2.
The first pa~zel of Table 4.2 shows holdings by income decile of the household."~ As might be expected the percentage reporting holdings of financial assets increases steadily with income: only about one-half of the bottom 30 per cent of the income distribution report having financial assets, compared with something approaching 90 per cent of the top income decile (cf. Figure 4.2). Even tbough these data do not include current bank accounts, it seems likely that the latter figure should really be closet" to 100 per cent.
Although tbe bottom decile bas dae lowest mean holdings, and the top decile the highest, mean holdings of all financial assets do not increase nniformly with increasing income decile: this is evident fi-om Figure 4.1. This finding is not surprising, since we know that, for example, older
people are not equally represented in all income categories.
Far more of the higher income households report holdings of sophisti-cated assets: more than I in 6 of the top income decile, compared with 7 per cent of the total sample and about 3 per cent of the lower half of flae income distribution (Figure 4.4). Though many cells in die lower part of the distri-bution have too few observations for reliable inferences about mean holdings (fewer than ten cases), it is noteworthy that some of the middle deciles report quite substantial holdings of sophisticated assets (cf. Figure 4.3). Once again, factors other than income clearly need to be taken into acconttt.
26
Figure 4.1
THE FINANCIAL ASSETS OF HOUSEHOLDS IN IREI~.ND
Finonciol Assets by Income Decile
Meon ond medion holdingg
v
Figure 4.2
100
Finoncial Assets by Income Decile
Per£ enlo~e te~tting
90 80 70 60 50 40 30 20 ~0
0
Figure 4.3
20 19 18 17 ~6 15 14 13
No
8 7 6 5 4 3 2 I 0
Figtu-¢ 4.4
18
17 18 15
14 13
12 11 10
9 8 7 6
5 4 3
2
0
THE PA’I’I’EI~’q OF HOUSEHOLD PORTFOLIOS
Sophisticated Assets by Income Oecile
Meon ond median holdlngs
Sophisticated Assets by Income Decile
Percentoqe reportin9
Bottom 2 3 4 :5 6 7 8 9
Top
Top
28 THE FIN±~u\~CIAL ASSETS OF HOUSEHOLDS IN IRELAND
The second panel of Table 4.2 refers to age. There is some evidence (most clearly seen in Figure 4.6; see also Figure 4.5) of the htunl}-shaped profile of asset-holdings with age 001at would be predicted by the life-cycle model of savings, with accumulation of ,assets into middle age followed by dissaving ~ffter retirement.
Turning to 003e third panel, listing the four categories of socioeconomic group (Fignre 4.9), it is not surprising 001at the professional and managerial class report much higher holdings of total financial and sophisticated assets; in 1300001 cases their mean holdings are more than twice those of any of the other three categories. Farmers have the second highest mean holdings of all financial assets, but their mean holdings of sophisticated assets are lower than those of the remaining two groups.
The labour force status of households forms the basis of the fourth panel of Table 4.2 and of Figures 4.7 and 4.8. Here 001e unemployed are dole on00iers: only 42 per cent report financial assets at all, and a half of these have holdings less than £150. The mean holdings for the unemployed with financial assets are about £1,200, less than a quarter of the over’all mean. Very few of the unemployed (or of 003e ill and disabled) have sophisticated assets. The category wi003 the highest mean holdings are the retired.
From the fifth panel of Table 4.2 it is evident that outright home ownership (not mortgaged) is associated wi001 much higher mean financial assets and sophisticated assets than o001er forms of tenure (Figure 4.10). In contrast, 00~ose ,enting d-ore local au001orities have very low mean financial assets (less than £900), and almost none of them hold sophisticated assets.
For each sub-category32 of households, 001ere is a wide gap between mean and median holdings of both basic and sophisticated assets - the mean being more than three times dole median in the bulk of cases. This indicates the high concentration of financial asset holdings.
More Detailed Asset Classification (7hble 4.3)
Percentages holding each of 003e five categories of asset, together with median holdings are presented in Table 4.3. No detailed account of the contents of this table will be presented in the text; a number of features stand out. First, a ra001er smaller proportion of households in each category have small savings than have deposits. The proportion holding small savings varies from 18 pet" cent (local authority tenants) to 68 per cent (professional and managerial), whereas the proportion holding deposits varies fi’om 30 per cent (001e unemployed and local au001ority tenants) to 76 per cent (top income decile). The median holdings of small savings are in all cases very low indeed - usually about £20 representing a few prize bonds. Mean holdings of small savings are generally higher by a multiple of tens.
THE PAqTFERN OF HOUSEHOLD I’ORTFOLIOS 29
Figure 4.5
Finoncial Assets by Age-group
Meon holding
Figure 4.6
80
Finonciol Assets by Age-group
Percentog~ reDorting
70
60
50
40
-
30-¯ 20 - ~
10
-0 .
0-25
\\\\ \\\\ \\N\
] \\\\ \\\\ \\\\ N\\\ \\\N \\\\ \N\\ N\\\ \\\N N\\\ \\\\ \\\\ \\\\ \\\\ \\\\ \\\\ \\\\ \\N\ \\\N
25-34 35-44 a5-5a
E2N~ \
30
Figure 4.7
9O 80 7O 60 3
50 4o
¯ 30
20 io
Figure 4.8
3O
THE FINt~NCIAL/~SSE’I’S OF HOUSEHOI,DS IN IREIa~tND
Financial Assets by Labour Force Status
Percentoge reporting ond mean holdings
Retired Home duties
Self--employed Employee Unemployed
Meon ~
Sophist. Assets by Labour Force Status
Percentoge teportincJ Ond mean holdings 28
25 24 22 20 18 16 14 12 10
Retired Home duties
Self -employed Employee Meon ~
Ul I
Figure 4.9
12O
THE PATrERN OF HOUSEHOLD PORTFOI.IOS
Financial Assets by Socioeconomic Group
Perc~Atoge repor~iA(] 0nd nl~an holdJngl
31
///
///
/// /// /// ///\\\M
///
/// ///
/// /// ///
r/// X\\N
Prol/klonogerleJI Low skill~
Figure 4. l0
80
771 Meotl ~
Financial Assets by Tenure of Home
Percentoge reportlng on~ meon holdings
70,
50-40 .
30"
20"
113
-0
\\\ \\\ \\\ \\\ \\\
/// \\\ /// \\\ /// \\\ /// /// \\\ /// \\\ /// \\\ /// \\\ ///
32 TI’IE FINANCIAL ,,’LSSETS OF I-IOUSEHOLDS IN IREL.~,NI)
Apart fronl deposits and small savings, most of tile remaining cells in Table 4.3 contain only a few observations, so the medians cannot be taken as reliable. Nevertheless, it is clear tbat bonds do not attract small invesunents: the median bond holdings for any household category are at least £5,000.
Chapter 5
MODELLh\tG THE POR77~OIAO CHOICE OF HOUSEHOLDS
Methodological Approach
The task addressed in this section is to arrive at a coherent statistical model describing bow the structtu’e of household portfolios tends to vat’), with the household characteristics on which data are available. The
major
recent papers that have conducted econometric analysis of a single cross-section of household financial asset holdings are Feldstein (1976), Friend and Bhtme (1975), Shorrocks (1982) and Uhler and Cragg (]971). We draw on their methodology in what follows.Note that, tvbereas exl)laining trends in aggregate holdings of financial assets requires information on the yields and other characteristics of the assets, tile attempt to discover from a single cross-section what factors influence different households to hold different quantities of financial assets is based tvllolly on household characteristics. If more than one cross-section is available, and especially if there is panel itaformation on the evolving asset-holdings of a given sample, the combination of household and asset characteristics can be very inlbrmative. Indeed, that combinatiola has been tile basis for most recent international research on household financial ,asset holdings. However, the present study is limited to a single cross-section and so variations ill asset yields do not enter into consideration.3"a
The main candidate explanatory variables used are total wealth, financial assets,34 income and age category. In addition, the following dummy variables are considered: urban/rural, sex, four socio-economic
SSActually, the sample on which this stud)’ is based was inte~,iewed over a period of several months in 1~87 when financial market conditions were by I~o means static. Interest
rates in Februat’}, |987, when the main i¢itet~,iewixlg started, were much higher th‘azl ,at the end of the math inlets’Jew period in.lldy. Thus. choosing the three month interbank rate as a s~llsitiv~ indicator of ii~arkel COllditions, this i~te t~11 fi’ot~l 14.25 per cent at end-FebruaO’ to 10.44 per cenl :ll end-June. However, we treat the sampling period ,as ,q single |~oint in time, aI’td pay no attention to these interest t~Lte ~triations. The prol)lenl may not be vel3’ ‘acute because several of the queslions specific,~lly .asked for the "usual level" of ,asset holdings over a twclve month period.
S’lExcept at the node (A) where this is the dependent "~-al’ial)lc.
34 THE I:INANCIAL tL.qSETS OF HOUSF.HOLI)S IN IREL,~ND
gronps, and the main labour force categories (notably the employed and self-employed). It is worth recalling that the inclusion of a durum), ~u’iable as significant indicates that households falling into that class tend to have different portfolios even after accounting for their deviation fi-om the overall average in wealth, age, and income.
One conventional approach would be to run regression equations for the value of each asset held, including all available explanatory variables in each equation. Such an approach has a nnmber of drawbacks: the statistical significance of most inclnded variables is inevitably low, and it is hard to interpret the results. Results of that approach are not reported in this paper.
Instead we adopt a more strnctured approach, using regression strategies to eliminate irrelevant explanatory variables. Variables are deleted fi’om the list of candidates if the), are not statistically significant,"~5 and the equation is re-estimated without them. As is well known, this carries its own risks, including the possible omission of relevant variables and overesdmaung the importance of those variables which survive in the equation.
The Decision Tree
We assume"s6 that households choose their portfolio on the basis of a decision tree as schematised in Chart 1. Households make different choices at each node depending on their characteristics. We focus on three key nodes: A, B, and C.
At the apex of the decision tree is the choice (marked A) of how to allocate household wealth between financial and non-financial assets. Note that, for the present, the "total wealth" variable whose allocation into financial and financial components is explored includes only non-human wealth and is net of mortgages and farm borrowings. For about o, vo-thirds of the sample (N=2,121) this node is relevant in that some financial ,assets were chosen.
S~The criterion for inclusion ofa ~’ariable in the reported least-squares regressions was that the ratio of estimate to standat’d error should exceed 1.9. This is a more demanding criterion for inclusion than maximisation ofR"2 and should minimlse spurious inclusion of irrele~ant variables. Each of the reported Tobit regressions corresponds to a reported least-squares regression without fiwther deletion of variables.
Chart 1
MODEI.IJNC, THE, PORTFOIJO CHOICE OF HOUSI~I-IOLDS
35
=.
6
Z
O
t--(.3
q
-..I
0
--I
0
l--
if-0
n.-0
U-I.U
m
rr"
I--Z
0
0
I.U