1
Year
-
round performance assessment of a ground source heat
1
pump with multiple energy piles
2Yuanlong Cui, Jie Zhu
3
Department of Architecture and Built Environment
4
The University of Nottingham, University Park, Nottingham NG7 2RD, United Kingdom
5
6
ABSTRACT 7
The year-round performance of a ground source heat pump (GSHP) with multiple energy piles (EPs) is 8
investigated in this study based on a 3D transient heat transfer model. The GSHP heating and cooling capabilities 9
are simulated and assessed according to thermal energy demands of an air conditioned domestic building, its 10
coefficients of performance (COPs) obtained from numerical analyses and experimental tests are compared and 11
the largest difference between them is less than 8%. The maximum heating and cooling COPs of the GSHP are 12
3.63 and 4.73 respectively in the first year operation period, and the soil final temperature is lower than its initial 13
temperature, therefore the soil is not capable of recovering by itself due to the building unbalanced heating and 14
cooling loads. Finally, the effects of the soil thermal properties on its temperature and the GSHP COPs are 15
investigatedand compared between the first year and tenth year operations, and it is found that the soil with low 16
volumetric heat capacity and high thermal conductivity could achieve a quick temperature recovery. 17
Keywords: Energy piles, GSHP, Ground heat extraction/injection, Soil thermal property, COPs 18
19
1 Introduction 20
Shallow geothermal energy is one of the most popular renewable energy sources for efficient building air 21
conditioning with GSHP. A typical GSHP system is presented in Fig.1, which consists of three main components: 22
(i) ground heat exchanger (GHE), (ii) heat pump and (iii) ventilation system [1]. In winter, soil temperature is 23
higher than the mean ambient air temperature, and therefore the soil can be used as a heat source for space heating; 24
however, in summer, its temperature is lower than the average outdoor air’s and the soil can be adopted as a heat 25
sink for space cooling. Thereby soil temperature is a very important parameter and should be clarified for 26
designing GHE, which is decided by the geographic location and regional climate condition. Numerous 27
Corresponding author. Tel: +44-115-8466141 Fax: +44-115-951315
approaches have been developed to predict soil temperature, such as numerical [2, 3], analytical and semi-28
empirical [4-5], statistical and purely empirical methods [6]. Mihalakakou et al. [2] proposed a 3D transient 29
numerical heat transfer model to assess the soil temperatures at different depths under a building foundation, and 30
got a very good agreement between numerical results and measurement data, the maximum soil temperature 31
difference between them is less than 0.3 °C. Zoras et.al [3] developed a numerical response factor method to 32
simulate soil temperature variation under a normal square slab-on-ground floor, and found that the method 33
precision relies on the depth of grid nodes regarding the time required for heat waves to penetrate at their locations. 34
Droulia et al. [4] calculated the subsurface soil temperature profile based on analytical and semi-empirical models, 35
and discovered that the semi-analytical approach only needs daily mean soil or air temperature, while the 36
analytical solution does not require any data at all. Elias et al. [5] studied soil temperature distribution by an 37
exponential-sinusoidal analytical model and compared their results with the analytical solution data, and found 38
that the maximum soil temperature error is 0.3 °C at a depth of 0.1 m. Zheng et al. [6] presented a normal 39
methodology to calculate daily soil temperature based on the ambient air temperature and precipitation statistical 40
data, and examined soil temperature distribution under vegetation cover by the Leaf Area Index (LAI). Their 41
results demonstrate that soil temperature under vegetation cover at regional and continental scales can be decided 42
through LAI. It is essential to sustain high soil temperature surrounding the GHE for good performance, so several 43
techniques are adopted to manipulate geothermal energy system design based on theoretical models [7-9]. Li and 44
Lai [10] developed analytical model targeting on heat conduction in infinite anisotropic and semi-infinite media, 45
and concluded that the anisotropy of the medium has little impact on the short time performance of GHE, while 46
it has obvious effect on the long-term temperature response. Notably, soil thermal property is another vital factor 47
affecting ground heat transfer. Casasso and Sethi [11] descripted that soil thermal conductivity is a key source of 48
uncertainty when modelling the GSHPs. Their results reveal that a fluid temperature difference of 5.66 °C and 49
heat pump energy consumption difference of 12.5% exist for soil thermal conductivity difference of 1.5 W/(m·K). 50
Lee [12] studied the impact of vertical heterogeneities of the soil thermal conductivity, and found that the adoption 51
3 53
Fig. 1. A typical GSHP system [1]. 54
The amount of heat extracted/rejected from/to the soil in the GSHP system relies on building heating/cooling load. 55
Correspondingly, the GHE should have the ability to meet the building thermal energy requirement. Over the 56
years, various analytical and numerical vertical GHE models have been proposed and utilized as the design tools, 57
which are also used to estimate the working fluid temperature in the GHE for thermal performance evaluation. 58
Moch et al. [13] developed two 2D axisymmetric analytical models to analyse thermal interaction between the 59
soil and a helical BHE, and found that thermal properties of the soil have a significant influence on sizing the 60
geothermal installation. Al-Khoury et al. [14-16] proposed a 3D numerical model depicting thermal interactions 61
among inlet-pipe, outlet-pipe and grout. Their model addresses the formulation equilibrium, effects of thermal 62
resistance and finite element method (FEM) discretization. Ozudogru et al. [17] suggested a 3D numerical model 63
for vertical GHE based on FEM for simulating two cases, namely, an EP with double U-tubes and a BHE with a 64
single U-tube, and demonstrated that the model can be successfully used to predict vertical BHE and EPs 65
performances with different sizes and loop configurations. 66
Recently, EPs have received more attention, because a GSHP with EPs is one of the most effective strategies for 67
building air conditioning [18, 19], thereby a number of research works have been implemented on its thermal 68
characteristics [20-24]. Olgun et al. [1] analysed 30-year operation characteristics of EPs to evaluate the long-69
term performance with balanced and unbalanced heating loads under different climatic conditions, and discovered 70
temperature variation of the soil surrounding an EP mainly depends on the seasonal energy requirement.Gashti 71
et al. [25] proposed a 3D numerical heat transfer model based on finite element theory to assess the performance 72
between the pile wall and inlet fluid is around 25–33%, and there is a big temperature fluctuation near the tube 74
curve at the EP end. Li et al. [26] simulated the soil temperature surrounding an EP, and deduced that the influence 75
of pile thermal load on the soil temperature decreases with radial distance. Capozza et al. [27] investigated the 76
long-term and seasonal behaviours of a GSHP unit by CaRM simulation tool to figure out unbalanced thermal 77
load profiles for two office buildings in Italy, and found that the soil temperature depends mainly on the annual 78
heating and cooling loads. Kim et al. [28] used TRNSYS program to assess the performance of a GSHP system 79
with vertical BHEs, and discovered that the COPs of heating and cooling could be individually improved by up 80
to 25.2% and 15.1% with a systematic approach. Darkwa et al. [29] studied the long-term performance of a single 81
BHE, and presented that the yearly mean thermal energy rejected into the BHE is approximately 4.5 times more 82
than the amount extracted. Pasquier and Marcotte [30] developed a quasi-3D numerical model for a single BHE 83
as well, and considered thermal capacitances of both the grouting material and working fluid. Their results 84
illustrate that the error of the working fluid temperature is lower than the measurement uncertainty. Retkowski 85
and Thöming [31] presented a mixed-integer nonlinear programming method to minimize the year-round running 86
cost of vertical BHE system, but thermal interaction between BHEs is not considered. Lee et al. [32] compared 87
the transient performance features between a hybrid GSHP using a heat storage bath and a pure one, and found 88
that the mean COP of the hybrid GSHP system is around 7.2% higher than that of the pure one at the optimum 89
operating condition. Kurevija et al. [33] analysed the long-term thermal disturbance between boreholes in Zagreb 90
using the g-functions, and adopted a constant energy efficiency for heat pump unit. Ghoubali et al. [34] 91
investigated a heat pump performance with simultaneous domestic hot water heating, space heating and cooling 92
functions using TRNSYS software under three different weather conditions in France, and a maximum seasonal 93
COP of 2.28 is achieved. Kizilkan and Dincer [35] deduced exergy and energy assessments of a GSHP system in 94
Ontario, Canada, and found that the system performance in cooling mode is slightly lower than that in heating 95
mode. Zhao et al. [36] developed a 3D transient model to investigate thermal behaviours of different GHEs, such 96
as, U-shaped, W-shaped and spiral-shaped. Their numerical results present that the spiral-shaped GHE provides 97
the lowest temperature working fluid under the same initial and boundary conditions. Luo et al. [37] carried out 98
numerical and experimental studies of a GSHP with four different kinds of GHEs including double-U, triple-U, 99
double-W and spiral-shaped under an intermittent operating condition, and found that the double-U type has the 100
lowest energy performance and its thermal efficiency only accounts for 67~69% that of the spiral or double-W 101
category. Hamada et al. [38] studied the field performance of a GSHP with EP system, and discovered that the 102
5
Currently, there is a need to fill the research gap in studying the multiple EPs year-round performance with 104
consideration of “thermal short-circuiting” and soil thermal property effects, even though few mathematical 105
models focusing on heat transfer in the shallow EPs have been produced. The objectives of this paper are to 106
investigate the year-round performance of a GSHP with multiple EPs and identify the influence of soil thermal 107
property. In this study, a 3D numerical model is used to discretize the EP components and working fluid along 108
the U-tube pipe for accurate representation of heat transfer procedure, heat extraction and injection capacities are 109
calculated through C code. 110
2 Numerical model 111
An existing 3D transient heat transfer numerical model based on finite volume method (FVM) [39] is adopted in 112
this study, the effect of “thermal short-circulating” between two pipes of a U-tube in EP is taken into account, and 113
the initial and boundary conditions are established. Thermal partial differential equations of the model are 114
discretized at spatial nodal points and solved by linear approximation method. The major elements in heat transfer 115
process are the nearby soil, concrete piles, polyethylene U-tube pipes and working fluid. In order to develop a full 116
3D transient heat transfer model, the simplifying assumptions in this study are made as follows: 117
1) The ground is regarded as a homogeneous medium with mean thermal physical properties. 118
2) Initial soil surface temperature is assumed as the undisturbed ground surface temperature. 119
3) Heat transfer in the solid region is regarded as pure heat conduction and the effect of groundwater flow is 120
negligible. 121
4) A profile of velocity in U-tube pipe is uniform. 122
In terms of the working fluid flow region, energy equations of the inlet and outlet pipes are setup separately 123
because of the different flow directions. 124
2.1 Mathematical equations 125
For heat transfer analysis, the EP is classified into two regions: solid and fluid regions. 126
2.1.1 Energy balance in solid region 127
The solid region includes soil, grout and pipe, where heat transfer is regarded as 3D transient heat conduction. 128
The soil is divided into one hundred (100) layers in the vertical direction in order to interpret the fluid temperature 129
variation. Therefore, energy balance equation of the soil domain is given as: 130
s s s s
soil soil soil soil soil
T T T T
ρ c (k ) (k ) (k )
t x x y y z z
(1) 131
Grout as heat transfer medium in EP has high thermal conductivity and storage capacity. Hence, energy balance 132
g g g g grout grout grout grout grout
T T T T
ρ c (k ) (k ) (k )
t x x y y z z
(2) 134
Heat transfer through the pipe is treated as pure heat conduction as well, and defined as 3D heat conduction versus 135
time. Thus, the corresponding energy conservation equation can be written as: 136
p p p p
pipe pipe pipe pipe pipe
T T T T
ρ c (k ) (k ) (k )
t x x y y z z
(3) 137
Where ρsoil, ρgrout and ρpipe are densities of soil, grout and pipe (kg/m3) respectively; csoil, cgrout andcpipe are thermal
138
capacities of soil, grout and pipe (J/kg·K), respectively; ksoil, kgrout andkpipe are thermal conductivities of soil, grout
139
and pipe (W/m·K), respectively; Ts, Tg and Tp are temperatures of soil, grout and pipe (°C ), respectively; t is time
140
(s). 141
2.1.2 Energy balance in fluid region 142
Heat convection occurs between the pipe and working fluid, the average temperature of the upward flow fluid is 143
equal to that of the downward flow fluid, so V1= -V2= (-) V.
144
The fluid in the inlet pipe (downward flow) can be modelled as: 145
2 inlet inlet inlet
fluid fluid f fluid 2 ig grout inlet
T T T
ρ c (ρcv) k b (T T )
t z z
(4)
146
Similarly, the fluid in the outlet pipe (upward flow) is modelled as: 147
2 outlet outlet outlet
fluid fluid f fluid 2 og grout outlet
T T T
ρ c (ρcv) k b (T T )
t z z
(5)
148
Where, ρfluid is density of working fluid (kg/m3); cfluid is thermal capacities of working fluid (J/kg·°C); kfluid is
149
thermal conductivity of working fluid (W/m·K); Tinlet and Toutlet are inlet and outlet fluid temperatures (°C),
150
respectively; big is reciprocal of thermal resistance Rig between inlet pipe and grout (W/m2·K); and bog is reciprocal
151
of thermal resistance Rog between outlet pipe and grout (W/m2·K).
152
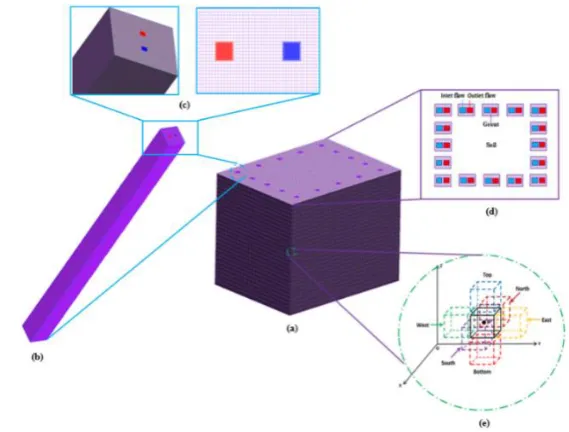
2.2 Multiple EPs model 153
The single EP has limited heat transfer capacity, so the EP system is normally designed with multiple piles. One 154
arrangement of multiple EPs is shown in Fig.2, sixteen EPs are installed in rectangular shape. A 3D FVM model 155
using a rectangular coordinate system [39] is applied for the EPs performance assessment. The entire soil volume 156
is discretized and each EP is represented by a square column circumscribed by the borehole radius. The soil and 157
working fluid temperatures within the EPs are worked out simultaneously by using an iterative approach. The 158
simulated region is discretized as a finite number of contiguous non-overlapping cell cubes. A black cube (P point) 159
7
north, top and bottom in which the corresponding cell faces are denoted by w, e, s, n, ť and b respectively, while 161
φ, ω, j represent a nodal point in direction of x, y and z axes, respectively. 162
163
Fig. 2. Schematic diagram of discretised model: (a) 3D multiple EPs model; (b) 3D single EP model; (c) top 164
discretised cross-section of single model; (d) top discretised cross-section of multiple EPs model; (e) arbitrary 165
cube cell [39]. 166
Integration of Eqs. (1) - (5) over the control volume and a time interval from t to (t + Δt) gives 167
t Δt t Δt t Δt t Δt
e w n s t ' b
CV t t t t
T T T T T T T
[ ρc dt]dV [(kA ) (kA ) ] [(kA ) (kA ) ] [(kA ) (kA ) ]
t x x y y z z
(6)168
Where, A is surface area of the control volume, CV is its control volume. Thereby, the left side of the volume 169
integral of the temporal derivative can be written as 170
t Δt
0 P P CV t
T
[ ρc dt]dV ρc(T T )ΔV t
(7) 171Where, 0
P P
T 1
(T T ) t Δt
, this term has been discretised by a first-order (backward) differencing scheme, in 172
which
T
P0 is value of T at time t and TP is value at time (t+Δt), with Δt is time step, and ΔV=dxdydz.173
The fully implicit discretisation method is applied to this proposed model, thereby the value of ε is set equal to 1. 174
t Δt
0
T p p p
t
I T dt [εT (1 ε)T ]Δt
(8) 1752.3 Initial and boundary conditions 176
Cecinato and Loveridge [40] illustrated that the hetero-thermal zone should be accounted for EP design. The 177
[image:7.595.150.435.116.332.2]soil year mean amp year shift
π 2π Z 365
T (Z, t ) T T exp( Z ) cos[ (t t )]
365 365 2 π α
(9) 179
Where Tsoil (Z, tyear) is undisturbed ground temperature at time (t) and depth (Z) (°C); Tmean is mean surface
180
temperature (average air temperature) (°C); Tamp is amplitude of surface temperature [(maximum air temperature
181
– minimum air temperature)/2] (°C); Z is depth below the surface (surface=0) (m); α is thermal diffusivity of soil 182
(m2/day); t
year is current time (day); tshift is day of the year when the coldest air temperature occurs (day).
183
Boundary conditions are classified into two categories, the first is expressed in terms of temperature at the 184
boundary while the second is presented in terms of temperature gradient. In the case of the first boundary 185
condition, at z = 0, the inlet pipe temperature is equal to the fluid temperature: 186
inlet fluid
T (0, t)T (t) (10) 187
In terms of the second boundary condition, at z = 0, heat flux at the exit of outlet pipe is depicted as: 188
outlet T (0, t)
0 z
(11) 189
2.4 COPs of heat pump 190
A vapour-compression heat pump model is used in this study and its parametric model reflecting the effect of 191
compressor rotation speed is adopted [43]. 192
1 r,cond n r c r,suc v
r,evap
P
m V ωρ [1 C (1 ) ]
P
(12) 193
n 1 r,evap r,cond n comp r,dis r,suc
r,suc r,evap
P P
n
Δξ ξ ξ [( ) 1]
n 1 ρ P
(13)
194 r comp el comp m Δh Q η
(14) 195
Where, mr is refrigerant mass flow rate (kg/s); Vc is compressor swept volume (m3); ω is compressor rotational
196
speed (rev/s); ρr,suc is compressor suction refrigerant density (kg/m3); Cv is compressor volumetric coefficient, P
197
is pressure (kPa); ξ is specific enthalpy (kJ/kg), n is polytropic compression coefficient; ηcomp is compressor
198
mechanical efficiency; Δξ is specific enthalpy change (kJ/kg); Qel is electrical energy consumption (kW).
199
The COPs of heat pump are defined as: 200 el heating h Q COP Q
(15) 201 cooling c el Q COP Q
9
Where COPh and COPc are heating and cooling COPs, respectively, Qheating and Qcooling are heating and cooling
203
capacities (kW), respectively. 204
3 Methodology 205
3.1 Building and soil property 206
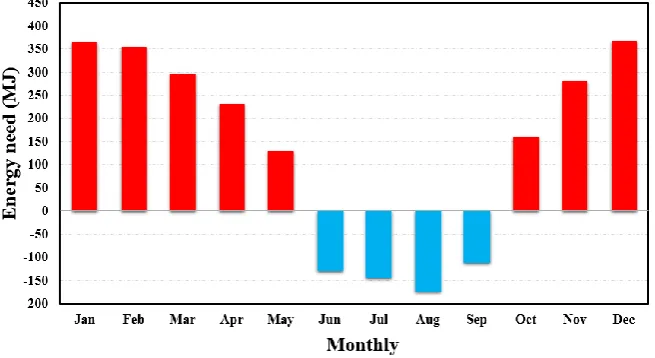
The numerical model is used to investigate a GSHP performance in a two-storey residential building in the UK. 207
The building with the total floor area of 144 m2 is designed for one family of four persons, and its monthly heating
208
and cooling energy requirements are shown in Fig.3 [44]. The maximum heating energy is 366 MJ, while the 209
minimum is 128 MJ. By contrast, the maximum cooling energy is 173 MJ and the minimum is 110 MJ. 210
211
Fig. 3. Monthly heating and cooling energy requirements. 212
As shown in Fig. 4, the ground consists of four geological layers: (1) the first layer, 0~2.22 m, is made of slightly 213
sandy clay, light grey and very sandy slightly clay gravel; (2) the second layer, 2.22~3.3 m, consists of orange 214
brown mottled grey black and coarse gravel; (3) the third layer, 3.33~5.5 m, is only very soft, red brown, slightly 215
gravel; and (4) the forth layer, 5.5~10 m, is formed with very soft, red brown, slightly gravel clay. 216
217
[image:9.595.135.463.258.437.2]219
Fig. 4. The profile of the geological layers within a depth of 10 m [44]. 220
3.2 Multiple EPs system 221
Total 16 EPs are utilized in this study and arranged in rectangular shape as shown in Fig. 2, the working fluid is 222
a mixture of glycol and water. Table 1 gives the EP parameters [44, 45]. 223
Table 1 Characteristics of the EPs in the experimental system. 224
Description Value
Fluid density 1035 kg/m3
Fluid kinematic viscosity 4.94x10⁻⁶ m2/s
Fluid heat capacity 3795 J/(kg ·K)
Fluid thermal conductivity 0.58 W/(m·K)
Pipe density 950 kg/m3
Pipe heat capacity 2300 J/(kg ·K)
Pipe outside diameter 0.032 m
Pipe inside diameter 0.013 m
Shank spacing 0.06 m
Grout thermal conductivity 2 W/(m ·K)
Grout density 1860 kg/m3
Grout heat capacity 840 J/(kg ·K)
EP diameter 0.3 m
EP depth 10 m
3.3 Heat pump unit 225
The EPs are connected to a 5.9 kW Greenline HT Plus heat pump [44, 45] which produces hot water at a 226
[image:10.595.70.521.468.672.2]11
air temperature is used to control the heat pump unit operation, and the set-points are 18 °C and 27 °C for heating 228
[image:11.595.66.523.134.296.2]and cooling respectively. The main parameters of the initial condition are shown in Table 3. 229
Table 2 Nominal specification of the heat pump [44]. 230
Description Value
Emitted /Supplied output at 0/35°C 5.9/1.3 kW Emitted /Supplied output at 0/50°C 5.4/1.7 kW
Minimum flow heating medium 0.14 l/s
Nominal flow heating medium 0.20 l/s
Superheat 3 °C
Subcooling 4 °C
Refrigerant R407C mass flow rate 0.02 kg/s Evaporating temperature (dew point) -1 °C Condensing temperature (dew point) 58.9 °C
Evaporating pressure 4.5 bar
Condensing pressure 24.7 bar
231
Table 3 Initial condition and basic parameters. 232
Description Value
Initial ground surface temperature 10.4 °C
Soil body temperature (soil far field boundary) 15.0 °C
Soil bottom temperature 15.5 °C
Fluid inlet temperature 1.2 °C
233
3.4 Simulation program 234
The year-round operation process is divided into four periods according to the local climate conditions. The first 235
is heating period from 05th/November/2007 to 30th/April/2008, the second is the first soil temperature natural
236
recovery period from 1st/May/2008 to 15th/June/2008, the third is cooling period from 16th/June/2008 to
237
15th/September/2008, and the last one is the second soil temperature natural recovery period from
238
16th/September/2008 to 4th/ November /2008. The flowchart of simulation program is presented in Fig.5. The
239
nodal temperature in the equivalent cube is calculated at each step until the time required for the fluid to flow 240
through the pile heat exchangers is reached. The related parameters including temperatures and heat transfer rates 241
are obtained in the process. After that, the program will output the simulation data if the results meet the precision 242
requirement and stop, otherwise the time t will be iterated (t = t + Δt) and the simulation process starts again. 243
244
245
246
[image:11.595.62.526.329.419.2]248
249
[image:12.595.69.527.78.677.2]250
Fig. 5. Flowchart of year-round performance simulation program. 251
252
13 4 Results and discussion
254
Before the numerical model is utilized to simulate the system performance, it needs to be validated at first. As 255
mentioned in the previous paper [50], the numerical model has been verified by experimental data with less than 256
8% error. To further validate the numerical model, the experimental data of the heat pump unit in literature [46] 257
are adopted, which are available from November/2007 to May/2008. Fig.6 illustrates the COPh comparison
258
between the numerical results and experimental data in heating mode, the maximum error is 7.14 % noticed at the 259
beginning of operating stage, and the average error is 6.34 %, thereby the simulation results are effectively 260
supported by the experimental data. Therefore, the 3D numerical model can be utilized to study the annual energy 261
performance of the GSHP with multiple EPs. 262
[image:13.595.126.472.280.475.2]263
Fig. 6. COPh of the heat pump.
264
4.1 Heating period in the first year operation 265
The system heating performance is simulated and presented in Fig. 7. As can be seen from this figure, the system 266
is capable of meeting the building heating energy demand referring to Fig.3, the system daily thermal energy 267
outputs are lower during the first and last few days than those in the middle period. Notably, the system maximum 268
daily thermal energy output is approximately 2037 MJ on the 116th day, and the minimum value is around 185
269
MJ on the 172nd day. The building daily internal mean temperatures are shown in Fig.8, it is found that the average
270
temperature of 18.9 °C in heating period is higher than the set value of 18 °C.On the other hand, during the middle 271
period of heating season, the system runs in the most of time so that the ground has no sufficient time to recover. 272
Hence, the ground temperature surrounding the EPs is relatively low, which leads to a low temperature working 273
extracted from the soil is approximately 1382 MJ on the 116th day, and the minimum value is about 129.8 MJ on
275
the 172nd day.
276
[image:14.595.162.432.120.271.2]277
Fig. 7. Daily variations of thermal energy output in heating period. 278
279
Fig. 8. Daily variation of mean internal temperature in heating period. 280
281
Fig. 9. Daily variation of ground heat extracted in heating period. 282
4.2 Cooling period in the first year operation 283
The GSHP is able to meet the building cooling energy requirement (referring to Fig.3) throughout the first year 284
operation period. As shown in Fig. 10, the system maximum daily cooling output is approximately 712 MJ on the 285
54th day, while the minimum is about 22.6 MJ on the 63rd day. Typically, the indoor temperature fluctuates within
[image:14.595.163.432.307.459.2] [image:14.595.164.430.495.646.2]15
an acceptable range during the system operation period as indicated in Fig. 11, it is found that the average indoor 287
temperature of 25.4 °C in cooling period is lower than the set value of 27 °C because the system cooling output 288
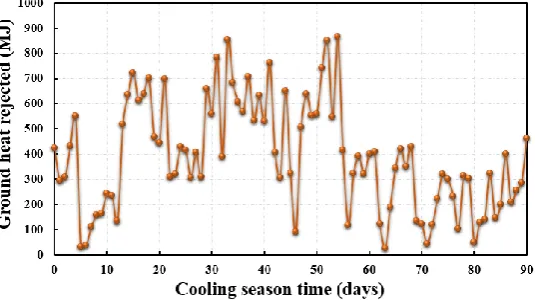
is larger than the building cooling load. Fig.12 descripts the daily variation of heat rejected into the ground. The 289
maximum rejected heat is approximately 865.4 MJ on the 54th day, while the minimum value is about 27.5 MJ on
290
the 63rd day.
291
[image:15.595.163.433.188.340.2]292
Fig. 10. Daily variations of cooling energy output. 293
[image:15.595.164.432.377.527.2]294
Fig. 11. Daily variations of internal temperature in cooling period. 295
296
Fig. 12. Dailyvariations of ground heat rejected in cooling period. 297
[image:15.595.165.433.566.716.2]In this study, there are two periods used for soil natural recovery as mentioned in Section 3.4. The regression 299
equation developed by Shang et al. [49] is adopted for predicting the soil temperature variation under natural 300
recovery condition. The variations of soil temperature nearby the EPs (soil temperatures in all the diagrams are at 301
5 m depth underground) throughout the year are illustrated in Fig.13. 302
[image:16.595.75.528.170.443.2]303
Fig. 13. Daily variations of soil temperature: (a) heating period; (b) the first soil natural recovery period; (c) 304
cooling period; (d) the second soil natural recovery period. 305
The soil temperature decreases from 14.85 °C at the start to 10.81 °C in the heat extraction period, while it 306
increases from 10.81 °C to 11.60 °C in the first soil natural recovery period. In terms of the heat rejection period, 307
it can be seen that the soil temperature has a dramatically increase from 11.60 °C to 13.37 °C. In the subsequent 308
period, the soil temperature decreases slowly from 13.37 °C to 12.59 °C. The final soil temperature of 12.59 °C 309
is reached which is below its initial temperature of 14.85 °C as expected, therefore the soil has no ability to recover 310
by itself due to the building unbalanced heating and cooling loads. 311
4.4 Heat pump electricity consumptions and COPs in the first year operation 312
Fig. 14 depicts electricity consumptions of GSHP unit during heating and cooling periods in the first year 313
operation. It can be seen that electricity consumption gradually reduces when the heating/cooling load drops 314
(referring to Fig. 3). The maximum daily electricity consumption in the heating period reaches approximately 665 315
17
is far lower than that in the heating periods, the maximum value of electricity consumption is only around 153 MJ 317
on the 54th day, the mean being 70 MJ, while the minimum is about 4.9 MJ on the 63rd day.
318
[image:17.595.74.524.119.249.2]319
Fig. 14. (a) Power consumption variation in heating period; (b) Power consumption variation in cooling period. 320
[image:17.595.70.526.287.418.2]321
Fig. 15. Daily variations of COPs in the first year: (a) heating period; (b) cooling period. 322
The COP variations in the heating and cooling periods are described in Fig.15. The maximum value of COPh is
323
approximately 3.63, the average being 3.41, while the minimum reaches around 3.11. By contrast, the maximum 324
value of COPc is approximately 4.73, the average being 4.64, while the minimum is around 4.44. Some previous
325
studies have presented the similar COP variations. For example, the seasonal COPh of a GSHP in Venice, Italy,
326
is 4 and its COPc is 4.2 in literature [21]. Additionally, the COP range of 3.85 to 4.20 is achieved by a GSHP
327
system in Hong Kong [50]. The monthly COP is investigated through experiment in literature [51], the mean 328
values of 3.03 and 4.33 are presented for heating and cooling respectively. 329
4.5 Performance in the tenth year 330
Fig.16 illustrates the system mean heating and cooling energy outputs for the tenth year operation. Notably, the 331
system is still capable of meeting the building heating and cooling requirements. In order to make the soil full 332
recovery, the extra energy should be provided, for example, hot water from a solar collector can be circulated 333
through the EPs to recharge the ground, thereby ameliorating the whole system performance. Fig.17 presents the 334
COP variations for the tenth year operation. The maximum COPh over the heating period is approximately 3.21,
the average being 2.82, while the minimum reaches around 2.47. By contrast, the maximum COPc is
336
approximately 4.40, the average being 4.31, while the minimum is around 4.08. 337
[image:18.595.71.525.119.238.2]338
Fig. 16. Daily variations of mean energy output in the tenth year: (a) heating period; (b) cooling period. 339
[image:18.595.69.528.274.408.2]340
Fig. 17. Daily variations of COPs for the tenth year: (a) heating period; (b) cooling period. 341
4.6 Influence of soil thermal property 342
Soil is typically stratified with different materials, including sand, clay, rock and so on. In order to analyze the 343
soil temperature variation surrounding the EPs, gravel, pebbly clay and mild clay are selected as the 344
representatives, their properties, such as volumetric heat capacity, thermal conductivity and diffusivity, are given 345
[image:18.595.72.519.584.655.2]in Table 4. 346
Table 4 Soil thermal properties. 347
348
Fig. 18 displays the soil temperature variations surrounding the EPs for the first year operation period. The soil 349
temperature variations have the similar tendencies, and are relatively small. In terms of the mild clay, heat 350
extraction for 180 days brings approximately 4.10 °C temperature decrease (from 14.58 °C to 10.48 °C), while 351
for the pebbly clay, the temperature reduction is around 4.09 °C (from 14.72 °C to 10.63 °C), the similar situation 352
Soil type
Volumetric heat capacity MJ/(m3·K )
Thermal Conductivity W/(m·K)
Thermal diffusivity (m2/s) × 10-6
Gravel 2.48 1.50 ~1.70 0.50
Pebbly Clay 2.68 1.42 0.73
19
for the gravel, the temperature drops about 4.04 °C (from 14.85 °C to 10.81 °C). During the continuous heat 353
rejection period, the gravel, pebbly clay and mild clay temperatures rise 1.77 °C, 1.74 °C and 1.67 °C, respectively. 354
As for the first natural soil recovery period, it can be seen from Fig.18 (b) that the gravel, pebbly clay and mild 355
clay temperatures increase 0.79 °C, 0.74 °C and 0.72 °C respectively. By contrast, during the second natural soil 356
recovery period, their temperatures decrease 0.77 °C, 0.79 °C and 0.82 °C individually. When the first year 357
operation is completed, the gravel, pebbly clay and mild clay temperatures decrease 2.26 °C, 2.27 °C and 2.3°C 358
respectively compared with their initial temperatures. It is found that the gravel with relatively low volumetric 359
heat capacity and high thermal diffusivity makes thermal energy migrate quickly, and the mid clay with low 360
thermal conductivity and high volumetric heat capacity can store more energy. As a result, it can be deduced that 361
the soil with high thermal conductivity and low volumetric heat capacity has the ability to recover quickly. 362
[image:19.595.37.535.87.653.2]363
Fig. 18. Soil temperature variations in mild clay, pebbly clay and gravel for the first year operation. 364
Fig.19 presents the mean soil temperature variations in the tenth year operation. The gravel, pebbly clay and mild 365
clay temperatures decrease 4.02 °C, 4.05 °C and 4.07 °C respectively in the heat extraction period. For the heat 366
rejection period, the soil temperatures of the three soil types rise 1.77 °C, 1.83 °C and 1.89 °C individually. As 367
for the two natural soil recovery periods, the gravel, pebbly clay and mild clay temperatures rise 0.79 °C, 0.73 °C 368
and 0.68 °C respectively at the end of the first period, while at the end of the second recovery period, their 369
temperatures reduce 2.25 °C, 2.26 °C and 2.29°C individually. Finally, the gravel, pebbly clay and mild clay 370
[image:19.595.74.526.305.577.2]gives the mean COPs of the first year and tenth year operations, it can be seen that the tenth year COPh, in terms
372
of the mild clay, pebbly clay and gravel, reduce 19.28%, 18.64% and 17.30% respectively compared with that of 373
the first year’s. Similarly, the tenth year COPc reduce 9.17%, 8.37% and 7.11% individually for the three soil
374
types. This is because the soil is not capable of recovering by itself. As a result, the auxiliary system, such as solar 375
collector, has to be adopted to charge the ground in this case. 376
[image:20.595.72.528.188.466.2]377
Fig. 19. Soil temperature variation in mild clay, pebbly clay and gravel in the tenth year operation. 378
379
Fig. 20. COP comparisons between the first year and tenth year operations: (a) heating; (b) cooling. 380
5 Conclusions 381
The year-round performance of a GSHP with multiple EPs system is simulated through a 3D transient heat transfer 382
numerical model. Sixteen concrete piles are utilized for heat exchange with soil in this study, which have a depth 383
[image:20.595.74.523.500.618.2]21
for a typical low-energy home. The soil temperature variations under different operation conditions are 385
investigated as well. The following conclusions are obtained: 386
(1) In the first year operation, the maximum heat output of the heat pump is 2037 MJ while the minimum is 185 387
MJ, and the maximum cooling output is 712 MJ and the minimum is 22.6 MJ. 388
(2) The maximum heat extraction from the ground is 1382 MJ in the first year operation while the minimum is 389
129.8 MJ, and the maximum heat rejection into the ground is 865.4 MJ and the minimum is 27.5 MJ. 390
(3) The soil is not capable of recovering by itself because of the building unbalanced heating and cooling loads. 391
(4) The maximum electricity consumption reaches 665 MJ in the first year heating period, while the maximum 392
electricity consumption in the first year cooling period is only 153 MJ. 393
(5) In the first year operation, the maximum COPh is 3.63, the average being 3.40, and the minimum is 3.11; the
394
maximum COPc is 4.73, the average being 4.63, and the minimum reaches 4.44. By contrast, in the tenth year
395
operation, the maximum COPh is 3.21, the average being 3.82, and the minimum is 2.47; the maximum COPc
396
reaches 4.40, the average being 4.31, while the minimum is 4.08. 397
(6) The soil temperature order from high to low is gravel, pebbly clay and mild clay at the end of the first year 398
operation. So the soil with high thermal conductivity and low volumetric heat capacity is more easily 399
recovered. 400
(7) The system tenth year performance is lower than the first year’s, and its mean COPh decrease 19.28%, 18.64%
401
and 17.30% respectively for the gravel, pebbly clay and mild clay, while its average COPc reduce 9.17%,
402
8.37% and 7.11% individually. 403
For the future research work, the effect of groundwater advection on the soil temperature will be investigated. 404
405
References 406
[1] C.G. Olgun, T. Ozudogru, S. Abdelaziz, A. Senol, Long-term performance of heat exchanger piles, Acta 407
Geotechnica 10 (2015) 553–569. 408
[2] G. Mihalakakou, M. Santamouris, D.N. Asimakopoulos, A. Argiriou, On the ground temperature below 409
buildings, Solar Energy 55 (1995) 355–362. 410
[3] S. Zoras, A. Dimoudi, P. Kosmopoulos, Analysis of conductive temperature variation due to multi-room 411
underground interaction, Energy and Buildings 55 (2012) 433–438. 412
[4] F. Droulia, S. Lykoudis, I. Tsiros, N. Alvertos, E. Akylas, I. Garofalakis, Ground temperature estimations 413
[5] E.A. Elias, R. Cichota, H.H. Torriani, Q.D.J.V. Lier, Analytical soil-temperature models: correction for 415
temporal variation of daily amplitude, Soil Science Society of America Journal 68 (2004) 784–788. 416
[6] D. Zheng, E. R.H.Jr, S.W.Running, A daily soil temperature model based on air temperature and precipitation 417
for continental applications, Climate Research 2 (1993) 183–191. 418
[7] M. Hajmohammadi, M. Moulod, O. Shariatzadeh, S.S. Nourazar, Essential reformulations for optimization 419
of highly conductive inserts embedded into a rectangular chip exposed to a uniform heat flux, Journal of 420
Mechanical Engineering Science 228 (2014)2337–2346. 421
[8] M. Hajmohammadi, S. Poozesh, M. Rahmani, Heat transfer improvement due to the imposition of non-uniform 422
wall heating for in-tube laminar forced convection, Applied Thermal Engineering 61 (2013) 268–277. 423
[9] M. Hajmohammadi, A. Campo, S. Nourazar, Improvement of forced convection cooling due to the attachment 424
of heat sources to a conducting thick plate, Journal of Heat Transfer 135 (2013) 124504–124511. 425
[10] M. Li, A.C.K. Lai, Heat-source solutions to heat conduction in anisotropic media with application to pile and 426
borehole ground heat exchangers, Applied Energy 96 (2012) 451–458. 427
[11] A. Casasso, R. Sethi, Efficiency of closed loop geothermal heat pumps: a sensitivity analysis, Renewable 428
Energy 62 (2014) 737-746. 429
[12] Lee CK, Effects of multiple ground layers on thermal response test analysis and ground-source heat pump 430
simulation, Applied Energy 88 (2011) 4405–4410. 431
[13] X. Moch, M. Palomares, F. Claudon, B. Souyri, B.Stutz, Geothermal helical heat exchangers: coupling with 432
a reversible heat pump in Western Europe, Applied Thermal Engineering 81 (2015) 368-375. 433
[14] Al-Khoury R, Bonnier PG, Brinkgreve, RBJ. Efficient finite element formulation for geothermal heating 434
systems. Part I: steady state. International Journal for Numerical Methods in Engineering 63 (2005) 988–1013. 435
[15] Al-Khoury R, Bonnier PG. Efficient finite element formulation for geothermal heating system. Part II: 436
transient. International Journal for Numerical Methods in Engineering 67 (2006) 725–745. 437
[16] Al-Khoury R, Kolbel T, Schramedei R. Efficient numerical modelling of borehole heat exchangers. 438
Computers and Geosciences 36 (2010) 1301–1315. 439
[17] T.Y. Ozudogrua, C.G.Olgunb, A.Senola, 3D numerical modelling of vertical geothermal heat exchangers, 440
Geothermics 51(2014)312–324. 441
[18] P. Bayer, D. Saner, S. Bolay, L. Rybach, P. Blum, Greenhouse gas emission savings of ground source heat 442
23
[19] M. Li, A.C.K. Lai, Thermodynamic optimization of ground heat exchangers with single U-tube by entropy 444
generation minimization method, Energy Conversion and Management 65 (2013) 133–139. 445
[20] R. Saggu, T. Chakraborty, Thermal analysis of energy piles in sand, Geomechanics and Geoengineering 10 446
(2015) 10-29. 447
[21] N. Batini, A.F.R. Loria, P. Conti, D. Testi, W. Grassi, L. Laloui, Energy and geotechnical behaviour of energy 448
piles for different design solutions, Applied Thermal Engineering 86 (2015) 199-213. 449
[22] F. Dupray, L. Laloui, A. Kazangba, Numerical analysis of seasonal heat storage in an energy pile foundation, 450
Computers and Geotechnics 55 (2014) 67–77. 451
[23] A.A. Mehrizi, S. Porkhial, B. Bezyan, H. Lotfizadeh, Energy pile foundation simulation for different 452
configurations of ground source heat exchanger, International Communications in Heat and Mass Transfer 453
70 (2016) 105–114. 454
[24] T.V. Bandos, A. Campos-Celador, L.M. Lopez-Gonzalez, J.M. Sala-Lizarraga, Finite cylinder-source model 455
for energy pile heat exchangers: Effects of thermal storage and vertical temperature variations, Energy 78 456
(2014) 639-648. 457
[25] E. H. N. Gashti, V.-M. Uotinen, K. Kujala. Numerical modelling of thermal regimes in steel energy pile 458
foundations: A case study, Energy and Buildings, 69 (2014) 165-174. 459
[26] X. Li, Y. Chen, Z. Chen, J. Zhao, Thermal performances of different types of underground heat exchangers, 460
Energy and Buildings 38 (2006) 543–547. 461
[27] A. Capozza, A. Zarrella, M. D. Carli, Long-term analysis of two GSHP systems using validated numerical 462
models and proposals to optimize the operating parameters. Energy and Buildings 93 (2015) 50–64. 463
[28] J. Kim, J.C. Jang, E.C. Kang, K.C. Chang, E.J. Lee, Y. Kim, Verification study of a GSHP system 464
manufacturer data based modeling, Renewable Energy 54 (2013) 55–62. 465
[29] J. Darkwa, W. Su, D.H.C. Chow, Heat dissipation effect on a borehole heat exchanger coupled with a heat 466
pump, Applied Thermal Engineering 60 (2013) 234–241. 467
[30] P. Pasquier, D. Marcotte, Joint use of quasi-3D response model and spectral method to simulate borehole 468
heat exchanger, Geothermics 51 (2014) 281–299. 469
[31] W. Retkowski, J. Thöming, Thermo-economic optimization of vertical ground-source heat pump systems 470
through nonlinear integer programming, Applied Energy 114 (2014) 492–503. 471
[32] J.S. Lee, H. Park, Y. Kim, Transient performance characteristics of a hybrid ground source heat pump in the 472
[33] T. Kurevija, D. Vulin, V. Krapec, Effect of borehole array geometry and thermal interferences on geothermal 474
heat pump system. Energy Convers Manage 60 (2012) 134–42. 475
[34] R. Ghoubali, P. Byrne, J. Miriel, F. Bazantay, Simulation study of a heat pump for simultaneous heating and 476
cooling coupled to buildings, Energy and Buildings 72 (2014) 141–149. 477
[35] O.Kizilkan, I.Dincer, Borehole thermal energy storage system for heating applications: thermodynamic 478
performance assessment, Energy Conversion and Management 90 (2015) 53–61. 479
[36] Q. Zhao, B.M. Chen, F. Liu, Study on the thermal performance of several types of energy pile ground heat 480
exchangers: U-shaped, W-shaped and spiral-shaped, Energy and Buildings 133 (2016) 335–344. 481
[37] J. Luo, H.F. Zhao, S.Q. Gui, W. Xiang, J. Rohn, P. Blum, Thermo-economic analysis of four different types 482
of ground heat exchangers in energy piles, Applied Thermal Engineering 108 (2016) 11–19. 483
[38] Y. Hamada, H. Saitoh, M. Nakamura, H. Kubota, K. Ochifuji, Field performance of an energy pile system 484
for space heating, Energy and Buildings 39 (2007) 517–524. 485
[39] Y. Cui, J. Zhu, 3D transient heat transfer numerical analysis of multiple energy piles, Energy and Buildings 486
134 (2017) 129–142 487
[40] F. Cecinato, F.A. Loveridge, Influences on the thermal efficiency of energy piles, Energy 82 (2015) 1021– 488
1033. 489
[41] G.A. Florides, S.A. Kalogirou, Annual ground temperature measurements at various depths (2004). 490
[42] T. Kusuda, O. Plet, J.W. Bean, Annual variation of temperature field and heat transfer under heated ground 491
surfaces: slab-on-grade floor heat loss calculations, Centre for Building Technology National Bureau of 492
Standards Washington, DC 20234. 493
[43] H. Jin, J.D. Spitler, A parameter estimation based model of water-to-water heat pumps for use in energy 494
calculation programs, ASHRAE Transactions 108 (2002) 4493-4510. 495
[44] C.J. Wood, Investigation of Novel Ground source Heat Pump, in: Built Environment, Vol. Doctor of 496
Philosophy, University of Nottingham, 2009. 497
[45] C.J. Wood, H. Liu, S.B. Riffat, An investigation of the heat pump performance and ground temperature of a 498
piled foundation heat exchanger system for a residential building, Energy 35 (2010) 4932–4940. 499
[46] Greenline HT Plus, http://www.intelligentenergysolutions.com/assets/images/Datasheets/Ground Source 500
Heat Pumps/IE SIVT Green line HTPlus.pdf. 501
[47] Y. Shang, M. Dong, S.F. Li, Intermittent experimental study of a vertical ground source heat pump system, 502
25
[48] C. K. Lee, Effect of borehole short-time-step performance on long-term dynamic simulation of ground-source 504
heat pump system, Energy and Buildings 129 (2016) 238–246. 505
[49] H. Esen, M. Inalli, Y. Esen, Temperature distributions in boreholes of a vertical ground-coupled heat pump 506
system, Renewable Energy 34 (2009) 2672–2679. 507
508
Nomenclature
A Area (m2)
b Reciprocal of thermal resistance
cp Heat capacity (J/(kg·K))
d Diameter (m)
Cv Volumetric coefficient of compressor
h Heat transfer coefficient (W/(m2·K))
H Height (m)
k Thermal conductivity (W/m·K)
l Length (m)
mr Refrigerant mass flow rate (kg/s)
n Polytropic compression coefficient
P Pressure (kPa)
Q Energy capacity (kW)
R Thermal resistance (W/m2·K)
Vc Swept volume of compressor (m3)
Greek Letters
α Ground thermal diffusivity (m2/day)
∆d Shank spacing (m)
∆h Specific enthalpy change (kJ/kg)
∆T Temperature gradient (°C)
∆t Time interval (s)
∆x, ∆y, ∆z Space interval at different directions
η Efficiency
τ Period of a temperature cycle (s)
μ Dynamic viscosity (N·s/m2)
ν Kinematic viscosity (m2/s)
δ Pipe wall thickness of square cross-section pipe (m)
ρr,suc Compressor suction refrigerant density (kg/m3)
∆ψ Temperature interval (°C)
ω Rotational speed of compressor (rev/s)
ξ Specific enthalpy (kJ/kg)
Δξ Specific enthalpy change (kJ/kg)
Subscripts
ave Average
b Borehole
c Compressor
cond Condenser
el Electricity
evap Evaporator
f Fluid
g Grout
ig Inlet pipe and grout
og Outlet pipe and grout
p Pipe
s Soil
v Vapour
w,e,s,n,b,t’ West, east, south, north, bottom, top
r Refrigerant
Abbreviations
BHE Borehole heat exchanger
27 CV Control volume
EP Energy pile
FEM Finite element method
FVM Finite volume method
GHE Ground heat exchanger
GSHP Ground source heat pump
3D Three-dimensional
![Fig. 1. A typical GSHP system [1].](https://thumb-us.123doks.com/thumbv2/123dok_us/8554850.363888/3.595.120.465.73.317/fig-a-typical-gshp-system.webp)
![Fig. 4. The profile of the geological layers within a depth of 10 m [44].](https://thumb-us.123doks.com/thumbv2/123dok_us/8554850.363888/10.595.70.521.468.672/fig-profile-geological-layers-depth-m.webp)
![Table 2 Nominal specification of the heat pump [44].](https://thumb-us.123doks.com/thumbv2/123dok_us/8554850.363888/11.595.62.526.329.419/table-nominal-specification-heat-pump.webp)