Shift-Life Interactive Art: Mixed-Reality Artificial Ecosystem Simulation
Eugene Ch’ng
a, Dew Harrison
band Samantha Moore
baNVIDIA Joint-Lab on Mixed Reality, University of Nottingham Ningbo China, 199 Taikang East Road,
Zhejiang Ningbo China 315100. [email protected]
bFaculty of Arts, University of Wolverhampton, Wulfruna Street, Wolverhampton WV1 1SB, United Kingdom.
[email protected] and [email protected]
Abstract
This article presents a detailed design, development and implementation of a Mixed Reality Art-Science
collaboration project which was exhibited during Darwin’s bicentenary exhibition at Shrewsbury, England. As
an artist-led project the concerns of the artist were paramount, and this article presents Shift-Life as part of an
on-going exploration into the parallels between the non-linear human thinking process and computation
using semantic association to link items into ideas, and ideas into holistic concepts. Our art explores
perceptions and states of mind as we move our attention between the simulated world of the computer
and the real-world we inhabit, which means that any viewer engagement is participatory rather than
passive. From a Mixed Reality point of view, the lead author intends to explore the convergence of the
physical and virtual, therefore the formalization of the Mixed Reality system, focusing on the integration
of artificial life, ecology, physical sensors and participant interaction through an interface of physical
props. It is common for digital media artists to allow viewers to activate a work either through a computer
screen via direct keyboard or mouse manipulation, or through immersive means to activate their work, for
“Shift-Life” the artist was concerned with a direct “relational” approach where viewers would intuitively engage
with the installation’s everyday objects, and with each other, to fully experience the piece. The Mixed Reality
system is mediated via physical environmental sensors, which affect the virtual environment and autonomous
agents, which in turn reacts and is expressed as virtual pixels projected onto a physical surface. The tangible
hands-on interface proved to be instinctive, attractive and informative on many levels, delivering a good
example of collaboration between the Arts and Science.
Keywords: mixed reality, artificial life, agent-based modeling, art, participatory, sensors
1.
Introduction
The Mixed Reality installation titled “Shift-Life” presented in this article was exhibited at the Shift-Time
Festival of Ideas (3-12 July 2009) which coincides with Charles Darwin’s 200th year celebration. The project
was later exhibited at The Wolverhampton Art Gallery and demonstrated at the Gadget Show Live (8-11 April
The Shift-Life installation was conceived when our lead artist Dew Harrison was invited by the Shrewsbury
Museums Services, and funded by Arts Council England, to create a work related to Charles Darwin for the
bicentenary of his birth in his birthplace of Shrewsbury. She was one of only 10 artists commissioned to make a
work in response to Darwin’s “On the Origin of Species” for the festival. For this she envisaged a real-world
installation that would allow immediate access to a Darwinian virtual world of artificial creatures which users
could affect via physical inputs. As a digital media artist with an interest in new technologies, her main focus is
on the parallels between the human thinking process and computer processing where both are non-linear
systems using semantic association to link items into ideas, and ideas into holistic concepts. She is also curious
about perceptions and mind states as we move our attention between the created virtual world of the computer
and the real-world we inhabit. Most of her work is interactive and considers viewer engagement as a
participatory, and not as a passive activity.
Harrison uses digital thinking and technologies in her practice, which materializes as installations,
interactive pieces, looped videos and online performances. Her work is concerned with the similarities of
memory, mind and associative thinking held between computers and humans, where she constructs hypermedia
systems of concept-based art by linking art’s ideas into concepts. Earlier pieces focused on the complex and
enigmatic art works and ideas of Marcel Duchamp, the forefather of Conceptual Art, who was immersed in the
rapidly developing scientific understandings and new technologies of his time (1887-1968). Duchamp is
single-handedly responsible for the shift in art thinking from the aesthetics of the art object to the ideas held within that
object, and for the understanding that the art object needs a viewer to “complete” it, through their mental
engagement and interpretation. Such thinking led Harrison from the Modern to the Postmodern and, together
with advances in computer technology, towards “interactive” art. Harrison began by creating interactive art
pieces and now, in line with current art theory, builds “participatory” works in collaboration with programmers
and designers. For “Shift-Life” she extended her practice of transposing Duchampian ideas into interactive
hypermedia systems by transposing the “big idea” of Charles Darwin into a participatory installation. This
Mixed Reality piece was to facilitate a holistic grasp of the necessary adaptation of life-forms in their struggle
for survival in a volatile environment. It required the viewers to be physically engaged in activating the virtual
ecosystem and then working with each other to keep it in balance.
From the Arts perspective, the project is an attempt to elucidate Darwin’s thinking using holistic interaction
interfaces. The bug-like creatures in the Mixed Reality installation are reminiscent of childhood and take the
form of jelly sweets and allsorts. The creatures use a cartoony aesthetic to make manifest their artificiality; they
are clearly hand drawn characters and not attempting to present an indexical trace of reality. Their visual roots in
confectionary make clear the playful nature of the work and encourage interaction. The green/yellow jelly bugs
spent his childhood in Shrewsbury, where he began his observation of natural life forms and started his vast
collection of beetles. This boyish interest would last all his life and led to his great insights and contribution to
science later on as an adult. In response to Darwin’s idea, the aim of this “participatory” artwork was to create
an “alternate” biological life as a set of artificial or virtual organisms that possess similar biological processes to
their “real” counterparts – growth, reproduction, competition, and adaptation. The virtual life exists in a trophic
relationship of predator and prey and includes sessile (rooted) and vagile (free moving) organisms. Animal
intelligence was programmed into the virtual organisms to allow them survival strategies. The experiment
involves the construction of an enhanced Mixed Reality-based environment which is connected with wireless
sensors with environmental manipulators for altering the “climate” of the ecosystem. By bringing virtual “living”
creatures into the physical world where they would seemingly respond to audience activity, we hoped to create a
liminal space blurring the perceived virtual and real states to the point where our viewers might suspend the
belief that these life forms were artificial, and thus engage with the work on a deeper level. Complementary
details of the meanings behind the installation as an Art piece is available (Harrison, Ch’ng, Mount, & Moore,
2009).
Here, a Mixed Reality interface is essential in our artwork as it encourages intuitive interactivity for visitors
while the virtual world responds in real-time. Participants can physically manipulate a set of tools as everyday
objects such as watering cans to radically alter the living conditions of the virtual creatures in their mixed
virtual-real habitat. The virtual agents and their habitat are projected onto the installation space to create a sense
of reality in the physical space, as if the creatures actually exist in the physical world. Participants alter the
living conditions of the environment by pouring liquids to adjust the pH level and humidity of the soil, varying
light conditions, and hammering to create earthquakes in the box, altering the conditions and reaction of the
real-time agent simulation with immediate effect. The environmental change could be detrimental to the
survivability of a certain species, or promote their growth and reproduction. These responses are dependent on
the adaptation of their genotype, which describes their survival strategies and trophic networks.
Observation of the instant effect which a participant’s actions had on the creatures and their ecosystem,
projected onto the installation space proffered an understanding of how changes in environmental conditions
induces reactive response as a result of their behaviors. Participants have direct control on tipping the balance
between survivability and total destruction of the virtual-real ecosystem. Figure 1 is a relationship diagram of
the Mixed Reality system described here, which illustrates how our artwork connects the relationships between
participants, the interface sensors and the environment through its collection of artificial creatures. Participants
in the artwork interact with physical sensors via physical props, sensors activate and send physical (electrical)
and virtual (bits) signals to the virtual environment, virtual environment changes causing virtual agents to react,
there has been a lack on the developmental aspects of integrating interactive artificial life and simulation of
ecosystems with input that affects the simulation in real-time from participants via sensors, our system and the
details of its implementation presented here acts as a formalization of an Mixed Reality system for the
interactive art community, as well as the mainstream research community.
FIGURE 1 HERE
In the next section, we cover the brief background related to the present research. Section 3 documents the
exhibit and participant reaction. Section 4 is the formalization of our Mixed Reality work, which covers the
details of the implementation with behavioral mathematics for the artificial life and how they interface with the
real world via environment sensors. Finally, we discuss our artwork, the interdisciplinary experience acquired
during the creation the Shift-Life artwork, and what we have learned throughout the project.
2.
Mixed Reality, Art and Artificial Life
The term “Mixed Reality” was first conceived in the seminal paper by Paul Milgram, “A Taxonomy of
Mixed Reality Visual Displays” (Milgram & Kishino, 1994), yet the two decades after the definition of Mixed
Reality was set – what it includes, and its boundaries are still somewhat vague. We felt that the vagueness may
be beneficial as it allows a broad range of interpretation, creativity and expression for the community. A
particular interest of ours is how Art concerns can involve the use of Mixed Reality interfaces (Grasset, Woods,
& Billinghurst, 2007; Gwilt, 2009; Marshall, 2009), and the focus and content which drives our art installation
is artificial life (Langton, 1997) which implies a simulation of ecosystems. The simulation of living creatures is
of late a very popular area in virtual environments, yet Mixed Reality systems where simulation of artificial life
and ecosystems affected by participants via sensors are still relatively unexplored in both art and other
disciplines. The work here therefore, aims to formalize and outline the mechanisms involved in this particular
strand of work.
Mixed Reality generally refers to a suite of technology that “overlays our real-world environment with
digital, computer generated object” (Costanza, Kunz, & Fjeld, 2009) covering diverse technological subjects
from signal processing, computer vision, computer graphics, user interfaces, human factors, wearable computing,
mobile computing, information visualization, and the design of displays and sensors (Costanza et al., 2009).
Mixed Reality is differentiated with VR from the fact that in VR, participants are disembodied and completely
immersed in an interactive virtual environment involving at least the sense of sight and contributing to the
phenomenon known as presence (Lombard & Ditton, 1997; Luciani, Urma, Marlière, & Chevrier, 2004).
Costanza et al. (Costanza et al., 2009) states that in Mixed Reality, the virtual aspects are equally dominant as
the physical reality, this is again, in contrast with Augmented Reality (R. Azuma et al., 2001; R. T. Azuma,
1997) where virtual elements are less dominant in the display. The essence of Mixed Reality is the fusion of the
Mixed Reality is a field with many applications including that of the arts world. Artists create works with
various media. Artistic “technology” has progressed through art specific media such as paint and canvas to those
designed for other means and so artists now utilize digital technology in an exploratory manner. Some have
extended the digital medium into the real world via combinations of physical and digital media. This
combination merges the real with the virtual and can be categorized as a form of Mixed Reality media through
which artistic ideas can be communicated. Artworks using Mixed Reality are not new. Grasset et al. (Grasset et
al., 2007) provided a survey of artworks in the context of Mixed Reality, exploring artistic innovations via
Mixed Reality technology. A deeper study which focuses on Mixed Reality and art practice studies the creation
of illusion in computer aided performance (Marshall, 2009). Mixed Reality and artworks using mobile devices
have also been studied (Gwilt, 2009). The context of meaningful encounters with artists and Mixed Reality is
crucial and involves the look and feel, multimodal experience and interaction, and immersion as a subjective
emotion, and game play scenarios (Misker & van der Ster, 2010). Shaw et al.’s (Shaw, Kenderdine, & Coover,
n.d.) Web of Life and ConFIGURING the Cave allow participant's physical actions to be transposed, altering the
aesthetics of the virtual imagery. Ulrike Gabriel's Breath (1992-1993) mentioned in (Barker, 2009), uses a
combination of physical and digital information and processes to generate a particular aesthetic, co-mingling the
physical and digital to generate aesthetics. While the many case studies of artists using Mixed Reality involve
real humans but static, non-living computer generated 2D or 3D objects, we believe that the innovative inclusion
of “living” virtual agents and concepts from AI will greatly enhance the experience of participants by exploiting
more fully this digital encounter.
Artificial Life (Langton, 1997), the core driver of our artwork has been in widespread use in the
entertainment industry since its potentials were demonstrated by Reynolds (Reynolds, 1987) in the synthesis of
emergence in self-organizing systems such as bird flocks. Karl Sims’ Evolving Virtual Creatures (Sims, 1994)
is another example. Artificial Life and Art have been discussed at length (Whitelaw, 2004). However, our
survey reveals that this interest may not have been appropriately developed within the rather sparse Mixed
Reality community. This is reflected in the lack of literatures formalizing its use. A seminal paper (Maes, 1995)
attempted to contextualize the importance of believable and entertaining characters in entertainment with
artificial life. Most artificial life characters mentioned both in the text and in literatures exist purely in the virtual
environment (e.g., Prophet’s work discussed at the end of the article) – at the extreme right-end of the virtual
continuum.
In Artificial Life the simulation of an environment for supporting life is essential. Simulating life implies
the understanding of the relationship between organisms and their environments, such as in Ecological
Modeling (Gillman & Hails, 1997). A particular branch of Ecological Modeling that abstracts away from state
Breckling et al. (Breckling, Müller, Reuter, Hölker, & Fränzle, 2005) stated that “IBMs contrasts with common
ecological models which frequently operate on the population level and represent a population as an overall
state, thereby specifying rules how the overall state changes.” Individual Based Model aims to develop theories
of the adaptive behavior within the content of their population and environment and seeks to understand the
mutual relationship between the adaptive behavior of individual and system-level properties of populations,
communities, and ecosystems (Grimm & Railsback, 2013). Individual Based Models are decentralized and is a
bottom-up approach (Resnick, 1994) that is particularly suitable for our artwork.
Our project employs concepts from artificial life and ecology as drivers of “life” in our artwork for the
Shift-Time festival, experimenting with Mixed Reality and applying the idea as an interactive simulation where
voltage and silicon-based life-forms are brought into the physical environment and real-world environmental
factors are merged with the virtual via hardware sensors that are partly controlled by participants.
3.
The Shift-Life Mixed Reality Art Exhibit
To meet the commissioned development, and, in order to elicit an entertaining but partial understanding of
the Darwinian view of life through our art interactive art, a collection of agent representations, together with an
intuitive interface was required, mediated by tangible physical activity that participants could interact with. Here,
we explain our approach in the making of Mixed Reality art.
3.1.
Agent Representations
Our artist specifically chose the animator Sam Moore’s work as she did not want the “creatures” to
resemble real-life animals or microbes in any way, instead, preferring them to be flat graphics and non-scientific
in their look. The agents also needed to be simple, fun, and to reference Darwin's childhood in Shrewsbury
where he first began his interest in the natural world putting small beetles in boxes for observation. Sam
Moore’s animation style ticked all the boxes.
As such, the agent representations were developed as “bugs-in-a-box” “sweet” creatures with a view to
making them as approachable as possible to a diverse audience (Figure 2). The images moved away from a
computer-games visual aesthetic of hyper-reality and towards a deliberately non-digital, non-microbe, graphic
and comic aesthetic. This positioned the animator’s work in the realms of the overtly rather than covertly “made”
and referenced a clear fantasy world instead of attempting photo-realism. The creatures were based on pick and
mix sweets; the carnivore was a liquorice all-sort, the herbivore was a jelly sweet and the foliage (for shade,
sustenance etc.) was based around a selection of penny sweets. The creatures were limited to two dimensions as
they were to be observed from above. The completed representations of the agents and environments can be
FIGURE 2 HERE
3.2.
The Mixed Reality Art Installation
The art installation (Figure 3) was made to a size that can accommodate small groups of people, families
and individuals, accessible to both children and adult. The installation ran across two days at the Shrewsbury
event and our observations and interviews showed that all our visitors, young and old actively contributed as
participators by physically moving the box objects to change the parameters that affected the projected virtual
world. Participants often remained in a state of reflection by passively observing others’ actions, watching as
“life” takes place in the virtual world. The algorithms implemented were self-sustaining and stable, without the
need to intervene, as such it was visually mesmerizing as noted by our participants. There was room for
contemplation where the virtual world could be understood as an analogy for human activity and its effect on
global climate change within our own world. This became evident through our conversations with participants
during the session. The tangible hands-on interface proved to be instinctive, attractive and informative on many
levels, delivering a good example of collaboration between the Arts and Science.
As our art is “alive”, there were permutations of scenarios documented from the exhibition demonstrating
the many facets of events that could possibly happen, these were some of them:
As they poured water, for instance, the humidity would alter and some plants may die back, this
would mean less food for the herbivore green jelly sweet bugs, and consequently less bugs to eat
for the pink carnivores.
Switching the lamp on would dry out the atmosphere and enable plants to grow again, however too
much “sun” might be detrimental to the point of wiping out the carnivores entirely! They could, in
fact, become extinct due to their reproduction method of cloning, unlike the egg laying herbivores.
When this occurred, we had to re-start the program to reassure the smaller children that they
weren’t responsible for a complete genocide.
Pouring vinegar from a watering can would “feed” the poisonous plants, toxic to all the creatures,
but this could be remedied by pouring baking soda liquid and restoring the plant balance, the
herbivores’ food.
Hammering on the box sent the carnivores into panic mode and they would run for cover under the
3.3.
Participant Reactions
Once the piece was completed and on show, the viewers' slippage between virtual and real states became
apparent, even though the set-up was basic with plastic watering cans etc., and the creatures were comic brightly
colored line drawings, the viewers' talked about them as though they were alive. Their conversations illustrate
their understanding of how the animals had to “adapt to survive” the climate changes that were being introduced
into their ecosystem. But more interestingly, we also saw how this piece worked on a higher level as a signifier
for human activity – climate change and the earth:
“What happens if you change the light, do the creatures disappear?” someone else requested that the lamp
be brought nearer the box, “oh, they’re all dying!”
“So, if the Earth gets too close to the sun, we’ll all die?” “You’ve completely changed their planet, they’re
all dying, it’s not in balance.” This meant that they were now extinct “like the dinosaurs?” The participants
asked us to re-start the system to bring the creatures back into a sustainable environment, which we did. “This
could be the Earth that you’ve wiped out, we can’t re-boot the earth!”
The participants expressed similar sentiments, “the simulation was self-sustaining, stable and all
found the installation visually mesmerizing”. As creators of the system, we ourselves were occasionally
surprised by the emergent behavior witnessed during the exhibition – simple rules can indeed produce
complex behaviors, for “the whole is greater than the sum of its parts” ~Aristotle.
FIGURE 3 HERE
Figure 3 shows various scenarios during Shift-Time Shift-Life art exhibition. In A and B, young
participants can be seen adjusting the “sunlight” and adding moisture to the virtual environment to help with the
plant growth. In C, participants added vinegar into the watering in order to adjust the pH level of the virtual soil
for helping with the growth of certain species of plants. In D, a participant is seen pointing to a dying creature. E
shows a participant hammering the sides of the sandpit box in order to create a virtual earthquake. Finally in F,
crowds are seen gathering around the sandpit, mesmerized by the dynamics of the flourishing ecosystem when
the environment is appropriately moderated through the Mixed Reality props.
Figure 4 contains screenshots of the virtual environment when participants interacted with the Mixed
Reality system. Each figure is at a different period of the simulation showing different scenarios. The figure in
the top left shows carnivores emerge from the canopies after an earthquake (activated by participants hitting the
“earthquake” sensor with a toy hammer). In the top right are newly hatched herbivores heading towards the
clusters of edible plants. At the bottom left are carnivores in a feeding frenzy. Two herbivores in the same figure
have just died (multi-shaded blobs) due to attacks by a carnivore. At bottom right are herbivores clustering
around the group of plants. Some carnivores have died due to senescence and from ingesting a herbivore made
FIGURE 4 HERE
4.
Implementation of the Mixed Reality Interface
Mixed Reality interfaces generally refer to systems which augment reality by overlaying real-world
environments with computer-generated objects via headsets or digital displays. Our research experimented with
an inverse of this concept by projecting computer generated agents and environment into the physical world and
feeds environmental factors (temperature, sunlight, humidity, soil pH, and earthquake) back to the virtual
environment. This allows a mixed-mutual relationship between the real and the virtual – virtual agents sense our
environment while human participants interact with them. Our approach is particularly suited to relational
artworks involving multiple participants in public spaces. The more complex task here is the development of an
artificial life ecosystem (Section 4.3), the “life” of our artwork, which will be the body of technical details
covered in this section. We believe that the formalization of our Mixed Reality approach will enable more
creative approaches in the future when the ecology of “living” objects becomes necessary. In this context, our
lead artist has since expanded her practice towards notions of creating “living” virtual Duchampian art objects
endowed with animal behaviors, which might inter-relate to allow new insights into this body of work.
4.1.
The Shift-Life Interactive Art Installation
The Mixed Reality system comprised of a 1.2m2 box filled with polystyrene beads held under a muslin
sheet and surrounded by a set of manipulative tools. A projector fixed to the ceiling of the installation projects
real-time rendering of the virtual agents and its environment onto the muslin sheet. The interactive tools are
made up of a foam-based hammer used for simulating earthquakes; two watering cans were used for altering the
humidity and pH level of the soil, and a light source for altering the luminance to affect both the temperature
and the light/shade of the environment. Figure 5 illustrates the specifications with a cross-section diagram.
FIGURE 5 HERE
4.2.
Environmental Sensors
The sensor system consists of the following devices:
An attached Oak USB 3-axis accelerometer hidden underneath a paper icon attached to the side of the
bug box and a toy hammer with which to actuate the sensor. The output of the sensor was normalised
and an exponential weighted moving average applied to smoothen the response from the transducer;
An Oak USB luminosity sensor, actuated by an angle-poise lamp;
An Oak USB relative humidity sensor, protected by a Gortex membrane, actuated by pouring water
A Phidgets USB pH sensor, actuated by pouring vinegar and bicarbonate solutions into the sandpit.
The sensor network was centralised and reported back to the system. Software objects in the environment
receive the signals and adjusts the virtual environment accordingly, which affects the virtual agents in a
feedback loop. A number of optimisations were made to enable the application to appear to be responding
immediately, i.e., unnecessary sensor signals and logs were suppressed, and each datum only reported back to
the ecosystem if it differed from the previous reading by a threshold.
4.3.
Agents and Environments
This elaborate section details the implementation of the agent-based model and virtual environment, which
drives the virtual creatures in our Mixed Reality art installation. The sub-sections describe in detail the
behavioral mathematics and algorithms, which are foundational to the implementation of our Mixed Reality
system. We believe that by outlining our approach in detail, our system can be replicated, and used by
researchers wishing to extend our work in other application areas. For the purpose of standardizing the
presentation of the agent-based model for our readership, the format of the technical presentation of the model
in this section follows that of the Individual-Based Modeling (IBMs) technique in the Ecological Modeling
community (Grimm et al., 2006).
4.3.1.
Purpose
The purpose of the agent-based model used in our system is to generalize, and to create a collection of
extensible living entities which can be interacted with, in real-time, via physical inputs.
4.3.2.
State variables and scale
The model we used for our virtual creatures is a predator-prey ecosystem simulation and comprises a
hierarchical level of individual, meta-population, community and environment. There are three types of agents.
The first two are vagile – herbivore, carnivore, and the third is sessile – a vegetation type, these are edible herbs,
canopies, and poisonous plants. The agents are short-lived (60 seconds minimum and 150 seconds maximum),
this is essential for public exhibition where a large population of visitors are expected. The short life-span of the
creatures allow our viewers to see a fully scenario of the simulation in a few minutes of viewing, but people
generally stayed for half and hour or more. The general behavior of each organism is its survivability and the
reproduction of progenies. The survival of the entire ecosystem depends on the balance of the organisms that
inhabit the landscape. If the predator out-grows the prey, an imbalance occurs and the system perishes. If the
prey out-grows the edible plants, the food is scarce and the system is at a dilemma. If the canopies (large trees)
over-reproduce, the predator has little space left to hunt. If the poisonous plants outgrow the vegetation, more
and more herbivores are toxic; this toxic reaction kills the carnivores when they eat the herbivores. When the
levels). The difficulty of such an artificial life development is the maintenance of equilibrium. The “fun” part of
the exhibit is when users interact with the system by increasing any of the environmental factors via our sensor
network: temperature, sunlight, humidity, pH level.
Herbivore and carnivore individuals are characterized by:
1. Dynamics – speed (hunting, fleeing), eyesight, field-of-view (FOV)
2. Physique – age, deterioration (affects the maximum age), energy, hunger threshold, flesh index
3. Behavior – impulse, safe distance (security boundary), feeding distance
4. Reproduction – number of progenies, and sexual maturity
5. Ecology – adaptability to sunlight, temperature, seismic vibrations, and humidity.
Vegetation is characterized by these traits: their energy, resource index, seed count, reproduction age,
dispersal distance, and ecology – adaptability to sunlight, temperature, soil pH, availability of space and
humidity.
The population is characterized by size (the number of individuals in a given species) and the community
interacts within their trophic network. Populations can be controlled (culled) when a threshold is reached. The
highest hierarchical level in the model is the environment, which is discrete, i.e., the smallest unit of movement
is a single pixel. Abiotic factors depend on user-interaction and include temperature, sunlight, pH level,
humidity, and seismic vibrations (earthquakes). Environmental factors can both be controlled by both on-screen
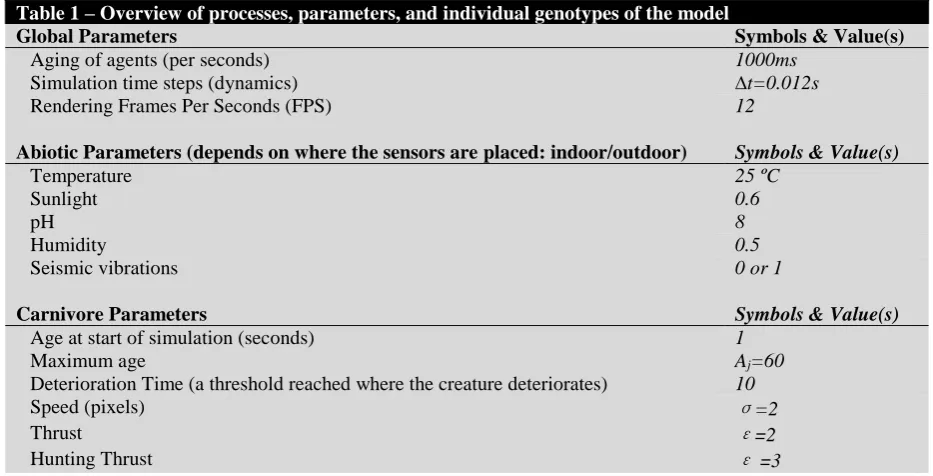
sliders (widgets) and hardware sensors. Table 1 shows an overview of the processes, parameters and individual
genotype of the model. The symbols used represent variables in the equations in the Submodels section (4.3.7).
It is important to note that these variables are based on the principal author’s literature review, and observation
of animal behavior in the wild and in captivity, which were translated into a relative measure during our
development. Whilst the variables were meant to reflect only the behaviors of our imaginary creatures, they do
[image:11.595.64.531.565.803.2]have semblance with real world organisms.
Table 1 – Overview of processes, parameters, and individual genotypes of the model
Global Parameters Symbols & Value(s)
Aging of agents (per seconds) 1000ms
Simulation time steps (dynamics) ∆t=0.012s
Rendering Frames Per Seconds (FPS) 12
Abiotic Parameters (depends on where the sensors are placed: indoor/outdoor) Symbols & Value(s)
Temperature 25 ºC
Sunlight 0.6
pH 8
Humidity 0.5
Seismic vibrations 0 or 1
Carnivore Parameters Symbols & Value(s)
Age at start of simulation (seconds) 1
Maximum age Aj=60
Deterioration Time (a threshold reached where the creature deteriorates) 10
Speed (pixels) σ=2
Thrust ε=2
Fleeing Thrust ε =4
Thrust Limit τlim=0.5
Friction ϕ=0.9
Rotation Angle θ =10 º
Eyesight d=100
Field of View v=90º
Energy at start of simulation λ=1.0
Energy Loss (when moving) κ =-0.001
Energy Rest Threshold (at a point when agent needs rest) υ=0.2
Energy used in predation κ =-0.6
Hunger threshold (depletion of energy results in hunger) 0.5
Flesh index 1.0
Impulse range (pixels) ι =200
Impulse I=20
Safe distance (from predation) 80
Feeding distance (prey captured at this distance) 10
Progenies n=1
Next reproduction age (reproduced only after n seconds) 30
Mature Age Ratio (reproduced when >= age*MatureAgeRatio) 0.5
Sunlight (L=lower range, P=preferred, U=upper range) L:0.2, P:0.6, U:0.8
Temperature (ºC) (L=lower range, P=preferred, U=upper range) L:-4.0, P:25, U:35
Humidity (L=lower range, P=preferred, U=upper range) L:0.3, P:0.5, U:0.8
Seismic vibration (Earthquake) 1
Herbivore Parameters Symbols & Value(s)
Age at start of simulation (seconds) 1
Initial size of creature at birth ς0=0.5
Rate of growth g=5.0
Maximum age A=100
Deterioration Time (a threshold reached where the creature deteriorates) 10
Speed (pixels) σ=2
Thrust ε=3
Hunting Thrust ε=3
Fleeing Thrust ε=8
Thrust Limit τlim =0.5
Friction ϕ=0.9
Rotation Angle θ=10 º
Eyesight d=250
Field of View v=90º
Energy at start of simulation λ=1.0
Energy Loss (when moving) κ =0.0005
Energy Rest Threshold (at a point when agent needs rest) υ=0.0
Energy used in predation κ =0.5
Hunger threshold (depletion of energy results in hunger) 0.8
Flesh index K=1.0
Impulse range (pixels) ι =200
Impulse I=5
Safe distance (from predation) 50
Feeding distance (prey captured at this distance) 3
Progenies n=5
Next reproduction age (reproduced only after n seconds) 15
Mature Age Ratio (reproduced when >= age*MatureAgeRatio) 0.3
Sunlight (L=lower range, P=preferred, U=upper range) L:0.1, P:0.6, U:0.8
Temperature (ºC) (L=lower range, P=preferred, U=upper range) L:-4.0, P:25, U:35
Humidity (L=lower range, P=preferred, U=upper range) L:0.3, P:0.5, U:0.8
Seismic vibration (Earthquake) 1
Vegetation Parameters Symbols & Value(s)
Age at start of simulation (seconds) 1
Maximum age A=70
Culling (maximum population) 15
Energy ρ=1.0
Resource index K=1.0
Reproduction age 10
Dispersal distance (pixels) D=130
Sunlight (L=lower range, P=preferred, U=upper range) L:0.1, P:0.5, U:0.8
Temperature (ºC) (L=lower range, P=preferred, U=upper range) L:18.0, P:26, U:38
Soil (P=preferred, U=upper range) P:0.5, U:0.8
pH (L=lower range, P=preferred, U=upper range) L:5.0, P:8.0, U:10.0
Space (P=preferred, U=upper range) P:0.6, U:1.0
Humidity (L=lower range, P=preferred, U=upper range) L:0.3, P:0.5, U:0.7
Canopy Parameters Symbols & Value(s)
Age at start of simulation (seconds) 1
Maximum age A=150
Culling (maximum population) 10
Energy ρ=1.0
Resource index K=1.0
Seed count s=5
Reproduction age 25
Dispersal distance (pixels) D=250
Sunlight (L=lower range, P=preferred, U=upper range) L:0.1, P:0.8, U:1.0
Temperature (ºC) (L=lower range, P=preferred, U=upper range) L:15.0, P:30, U:45
Soil (P=preferred, U=upper range) P:0.4, U:0.6
pH (L=lower range, P=preferred, U=upper range) L:1.0, P:7.0, U:10.0
Space (P=preferred, U=upper range) P:0.28, U:0.5
Humidity (L=lower range, P=preferred, U=upper range) L:0.3, P:0.5, U:0.7
Poison Plant Parameters Symbols & Value(s)
Age at start of simulation (seconds) 1
Maximum age A=50
Culling (maximum population) 15
Energy ρ=1.0
Resource index K=1.0
Seed count s=3
Reproduction age 10
Dispersal distance (pixels) D=160
Sunlight (L=lower range, P=preferred, U=upper range) L:0.1, P:0.4, U:0.7
Temperature (ºC) (L=lower range, P=preferred, U=upper range) L:16.0, P:27, U:33
Soil (P=preferred, U=upper range) P:0.5, U:0.8
pH (L=lower range, P=preferred, U=upper range) L:6.0, P:9.0, U:14.0
Space (P=preferred, U=upper range) P:0.6, U:1.0
Humidity (L=lower range, P=preferred, U=upper range) L:0.3, P:0.5, U:0.7
4.3.3.
Process overview and scheduling
Time is discrete steps in the simulation and the aging of the agents proceed every seconds. Within each
second, certain processes (simple rules) occur – state changes, growth, interaction, adaptation, feeding/fleeing,
reproduction and inheritance, and senescense. Figure 6 and 7 are Finite State Machines (FSM) of the Carnivore
and Herbivore agents. The processes for each autonomous agent are specified in the pseudocode below.
For Vegetation
Sense the environment (Temperature, Sunlight, Humidity, pH level, Space)
Grow (aging) and die of senescence (Maximum age)
Compete with nearby plants for space
Reproduce when sexual maturity is reached
For Carnivore
Sense the environmental (Temperature, Sunlight, Humidity, earthquake)
Change states
Grow (aging) and die of senescence
Avoid Canopy and Poison
Reproduce when sexual maturity is reached
Die when the fitness is depleted
For Herbivore
Sense the environmental (Temperature, Sunlight, Humidity, earthquake)
Change states
Grow (aging) and die of senescence
Avoid Carnivore
Change color when toxic plant eaten
Reproduce when sexual maturity is reached
Die when the fitness is depleted
FIGURE 6 HERE
FIGURE 7 HERE
4.3.4.
Design concepts
The concepts presented below are central to simulating an ecosystem of virtual creatures which interact
amongst themselves and with the environment affected by physical inputs. Since our model is a complex system,
explicitly presenting these concepts will also help with the observation of individual and collective behaviors
during simulation time.
Emergence: Emergence does not occur at the population level as there are no interactions between the same
species of agents. At the community level, certain emergent phenomena are observable due to the interactions
between predator, prey, vegetation (food and protection), and abiotic factors.
Adaptation: Adaptation in the model refers not to the general adaptation in evolutionary time-scale but is
tolerance to biotic and abiotic factors that have already been developed.
Fitness: The fitness of each organism is measured by the Adaptability Measure (Ch’ng, 2007). The
creatures are affected by three abiotic factors: temperature, sunlight and humidity and the plants are affected by
six factors: temperature, sunlight, soil, humidity, pH level, and space. The temperature, sunlight, humidity and
pH level are streamed from electronic sensors installed at strategic locations in the virtual bug box. Soil
space for the plants depends on the number of plants growing within that space. Fitness-seeking are not modeled.
The fitness measure is provided in later sections and is a product of the Adaptability Measure.
Prediction: Estimation of future consequences of agent decisions is not modeled.
Sensing: Agents are aware of their own age-related mechanisms (reproduction, senescence), other agents
that has direct impact on their survivability, and the abiotic factors.
Interaction: Individuals do not interact within their species. Carnivores interact with herbivores via
predation. Carnivores avoid canopies, which are protection for herbivores. Herbivores interact with all three
types of vegetation. Edible and poison plants provide energy but poison plants provide an additional chemical
which, if ingested by carnivores causes death.
Stochasticity: Stochasticity is implemented in the distribution of seeds (angle and bounded distance), and
the impulses of the movement thrusts of the vagile agents.
Collectives: Individuals are not grouped into collectives or social groups.
Observations: Scientific observation of the model itself is unnecessary as this is an interactive art
simulation.
4.3.5.
Initialization
At the start of simulation, all agents are randomly distributed in the landscape using the default parameters
listed in Table 1. Similarly, abiotic factors are initialized and read from the hardware sensors, which depends on
the current temperature at the place of installation. The environment varies depending on where the sensors are
– outdoors, or within an enclosed space.
4.3.6.
Input
Abiotic parameters are directly read from the hardware sensors. The raw data is polled and processed every
0.012ms. This corresponds to the simulation cycle of the agents, ensuring a continuous flow of abiotic
information to the biotic components.
4.3.7.
Submodels
This section explains in detail all submodels and parameterization representing the processes listed within
Section 4.3. The section covers the mathematical structure of the vegetation behavior and the dynamics of the
vagile agents.
4.3.8.
Vegetation Behavior
Vegetation behavior is a simplified version of an agent-based model (Ch’ng, 2009). The simplified model
Sensing the Environment
The vegetation agents sense the environment via receptors. The abiotic factors that the agents take into
account are temperature, sunlight, humidity and soil pH. Biotic factors include the competition for space and the
risk of being consumed by Herbivores. Each abiotic factor is measured by the Adaptability Measure (AM)
(Ch’ng, 2007) and contributes to the fitness measure.
Fitness Measure and Death
The AM measures four abiotic factors and a biotic factor to generate the fitness for individual agents i at
time t (Equation 2) in each simulation cycle:
(
)
t t
i i i
f
CTS
. (1)
Where the output of AM for each fitness related to biotic or abiotic interactions are computed:
iis theinteraction fitness of the pH level of the soil for plant i,
C
it is the only biotic local interaction fitness of thecurrent condition
c
it (Equation 2) at time t,T
it is the interaction fitness of the plant related to the temperature,t i
S
is the fitness affected by the sunlight and
it is the fitness of the plant in the current humidity. Theinteraction of the factors is a logical way for deciding the fitness of the plant. The variable Resource Index ρ,
defined as the storage of energy is decremented
unit (Table 1) in the condition in Equation 2. Death occurswhen
itt
0.0
,
0.0
t t t t
i i i
f
i
. (2)Competition
The collective occupation of the space used by the competing plants contributes to the accumulated space
t i
c
at time t for the plant i in Equation 3. Competition for space is defined as an interaction. A plant interactswith its neighbor in the condition,
2 2
1
(
)
(
)
0
,
for 0
1
n
t t t t t t t t t t t
i i x x y y size size size size age age i
t i
c
P
O
u
O
u
O
u
O
u
O
u
c
. (3)
Where n is the number of competing plants, and
P
i is the effective space used by a single plant.P
i
0.05
if the undergrowth species (vegetable or poison) competes against it’s own species,P
i
0.12
if theundergrowth compete against a canopy, and
P
i
0.2
among canopy competition. The differences inP
i adjuststhe position of the source plant at time t.
O
sizet andu
sizet ,O
aget andu
aget are respectively the diameter and the age of the two competing plants.Growth and Reproduction
Growth and reproduction uses time as a measurement. Growth is by aging, plants age every seconds and
senescense occurs when the maximum age is reached. Reproduction for Canopy and Vegetable depends on the
parameter Reproduction Age and the number of seeds s. Poison plant reproduces quicker on the high pH level of
the soil. The pseudo code below describes the process, the parameters for the variables below is listed in Table 1:
For Canopy and Vegetable
nextReproductionAge = lastReproductionAge + reproductionAge
IF age ≥ nextReproductionAge
Reproduce n seeds
lastReproductionAge = age
For Poison
nextReproductionAge = lastReproductionAge + reproductionAge
IF age ≥ nextReproductionAge – acidity (φ)
Reproduce s seeds
lastReproductionAge = age
The variable acidity is conditional:
φ=10 IF pH ≥ 0.9, φ=5 IF 0.6 ≤ pH < 0.9, ELSE φ=0
Reproduction distance and direction is stochastic:
cos
s i i
x
x
D X
. (4)
sin
s i i
y
y
D X
. (5)
Where
x
s andy
sare respectively the x and y position of the seed,x
i andy
i are respectively the x and yposition of the parent plant, X is a function from
R
to
0,1
and is a stochastic variable.D
i is the maximum4.3.9.
Carnivore and Herbivore Behavior
Sensing the Environment
The vagile agents sense the environment via receptors. The abiotic factors that the agents take into account
are temperature, sunlight, and humidity. Each abiotic factor is measured by the Adaptability Measure (AM)
(Ch’ng, 2007) and contributes to the fitness measure.
Fitness Measure and Death
The AM measures each environmental factor, which is combined with other factors to generate the fitness
v j
f
for each individual agent j (Equation 6) in each simulation cycle:(
)
t t
j j
f
TS
. (6)
Where the output of AM for each fitness related to abiotic interactions is computed:
T
jt is the interactionfitness of agent j at time t in the current temperature,
S
tj refers to the interaction fitness with sunlight and
tj isthe fitness in the current humidity. When
f
j
0.0
the agent dies.Growth and Reproduction
Growth and reproduction uses time as a measurement. Growth is defined by aging – the agent ages every
seconds and senescense occurs when the maximum age is reached. Graphically, the size of the Herbivore agents
has the following ratio, Carnivore size does not change.
1
0
(1 4 )
1
1
jt t
j j g A t
e
. (7)Where g is a constant (g=5.0) is the Rate of Growth to reach full size, it is the growth spurt,
A
jis theMaximum Age of the agent, and
0j is the Initial Size of creature at birth.Reproduction depends on the parameter Mature Age Ratio, Reproduction Age and the number of Progenies
n. The progenies appear from below the agents when they are reproduced. The pseudo code below describes the
process, the parameters for the variables below is listed in Table 1:
For Carnivore and Herbivore
IF age ≥ age*MatureAgeRatio
nextReproductionAge = lastReproductionAge + reproductionAge
IF age ≥ nextReproductionAge
Reproduce n number of progenies
4.3.10.
Behaviors and Dynamics of Carnivores and Herbivores
These behaviors are our approach in defining the movement dynamics and behaviors of our virtual
creatures, such as chase and evade, roaming and scavenging, and energy gain and loss. These are foundational
formulae, essential to the implementation of our simulation, which bring the virtual creatures to life. The
formulae can be extended for application in other research.
Movement When Targeting Another Agent
During one simulation time step, the steering behavior of the agent position updates with the speed, thrust
(to propel the body forward) and heading,
cos(
)
t t t t t
j j j j j
x
x
. (8)
sin(
)
t t t t t
j j j j j
y
y
. (9)
Where
x
tjty
tjt
is the vector of agent j with speed
j (length of the vector) and Thrust
tj(changes only during the roaming state, see Equation 20) at time t+∆t. The heading
tj (orientation of thevector) depends on the position of the target agent j,
if
1
if
1
j jk t j j jk
u
u
. (10)Where
j is the agent heading. Avoidance behavior is defined below by simply swapping the signassociated with the heading,
if
1
if
1
j jk t j j jk
u
u
. (11) t jku
andv
tjk are the visibility (Eyesight) from agent j to target agent k with the distance between the agentsin the x and y component
x
tjk andy
tjk at time t,cos(
)
sin(
)
t t t t t
jk jk j jk j
u
x
y
. (12)
sin(
)
cos(
)
t t t t t
jk jk j jk j
v
x
y
. (13)
Where,
t t t
jk k j
x
x
x
. (14)
t t t
jk k j
y
y
y
. (15)
2 2
(
)
(
)
t t t t t
jk j k j k
d
x
x
y
y
. (16)
The target agents are visible to the hunting agents at 90° field of view,
0
j
v
jk
. (17)
Where
j is the decision to hunt (move to) the target.Movement during the ROAM State
When in the roaming state, both Carnivore and Herbivore uses their impulses to navigate. The impulse to
turn either right or left and the thrust to move forward in short bursts depends on Equations 18 and 19,
if
if
j j j
t j
j j j
X
X
. (18)if
0
j j j
j
X
otherwise
. (19)Where
j is the heading of the agent j with steering angle
j at time t, the thrust
j as the decision topropel the body forward with force
j,X
is a function fromR
to
0,1
and is a stochastic variable,
j isthe Impulse Range, and
j is the Impulse of the agent (in Table 1). During the roaming state a friction isapplied to the thrust for the simulation time step t+∆t,
lim lim
if
t t
j j j j j
t t j j
otherwise
. (20)Where
tjis the Thrust in the Thrust Limit
limj and
j is the Friction applied to the force.Hiding and Fleeing (Earthquake or targeted by predator)
Carnivore goes into the hiding state when earthquakes occur and Herbivore goes into the fleeing state when
targeted by a predator:
IF earthquake sensed THEN find the closest Canopy
Hide under the Canopy until earthquake magnitude subsides
IF targeted by predator THEN find the closest Canopy
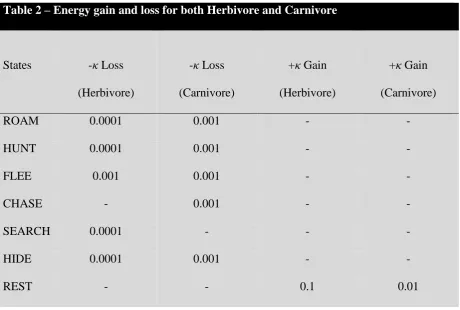
Energy Gain and Loss
Energy is gained via predation and food intake and energy loss occur during the movements. The use of
energy depends on the efficiency of each species with the gain and loss,
t t t
j j
. (21)
Where
tjt is the energy of the agent i at time t+∆t and κ defined in Table 2 is the amount of energy gained orlost. When Carnivore acquires Herbivore as food, the Flesh Index (Table 1) K is added to the energy of the
Carnivore. Herbivore acquires their energy from the Resource Index of the plants. The agent rests (stops
[image:21.595.69.530.245.555.2]activities) in the condition
tj
j where
j is the Energy Rest Threshold (Table 1).Table 2 – Energy gain and loss for both Herbivore and Carnivore
States
-
κ
Loss
(Herbivore)
-
κ
Loss
(Carnivore)
+
κ
Gain
(Herbivore)
+
κ
Gain
(Carnivore)
ROAM
0.0001
0.001
-
-
HUNT
0.0001
0.001
-
-
FLEE
0.001
0.001
-
-
CHASE
-
0.001
-
-
SEARCH
0.0001
-
-
-
HIDE
0.0001
0.001
-
-
REST
-
-
0.1
0.01
4.3.11.
The Object-Oriented Implementation Details
During the preparation for the exhibition, it was decided that Adobe Flash Action Script 3.0
(Object-Orientation) should be used for the development for practical reasons (i.e., portability to the Web), however, the
general mathematics algorithms can be applied to any object-oriented languages, such as a separate complex
systems built for large-scale simulation in Java/C++ (Eugene Ch’ng, 2013), or a simplified version of plant
distribution for virtual environments and visualization (Ch’ng, 2011). Details that are not covered in the
Submodels section are covered here. Figure 8 shows an overview of the classes. Figure 9 and 10 illustrates the
properties and methods of the class relationships between the agents and the environment. These important
The Main class acts as the controller for the entire system – setting up the user interface, initializing the
agent and environment objects, updating, and managing and rendering the graphics Sprite layers associated with
each agents (UILayer, SoilLayer, HerbivoreLayer, CarnivoreLayer, CanopyLayer, VegetableLayer,
PoisonLayer). Note that the Sprite layers are to make sure that the rendering order is correct. For example, the
SoilLayer should be the lowest layer (rendered first as a background) while the CanopyLayer should be at the
top (rendered last).
The subsequent paragraphs explain the Environment and Agent classes in Figures 9 and 10 in more detail.
For the purpose of more effectively visualizing the UML diagrams, the Flash event methods (Event, Keyboard,
Mouse, Timer, etc.) are not shown in the diagrams.
FIGURE 8 HERE
The Environment class manages the connection with data input from the hardware sensors. Each variable in
this list are linked to the hardware sensors – sunlight, temperature, humidity, pH, and isTremor. The isTremor
requires other related variables to work. The timeHandler() and updateLiveStream() function manages the
isTremor variable. timeHandler() is updated every seconds and updateLiveStream() reads the sensors every
0.012ms. The pseudo code describes the process:
timeHandler()
if isTremor = True
tremorCount++
if tremorCount > 5
isTremor = false
tremorCount = 0
liveTremor = 0.1
liveTremorPast = 0.1
updateLiveStream()
tremorMagnitude = liveTremor – liveTremorPast
if tremoreMagnitude >= 0.1
liveTremorPast = liveTremor
isTremor = true
The three plant agents –Canopy, Poison, and Vegetable use the PlantInfo class for accessing the genotype
parameters stored in an XML file. Each object derived from the classes senses the live stream from the abiotic
senescence (when age > maxAge). The update() method manages the rendering of the frames (Figure 9), calls
the fitness() methods, and checks for scheduled reproduction.
FIGURE 9 HERE
The LifeProcesses class is used by all agents for measuring its adaptability to biotic and abiotic factors. All
agents are made aware of other species via the Collection variables – plants, preys, predators. Each agent has a
unique identification index and the agents identify their food target, competitors, and protection (Canopy) via
these variables – competitorIndex, foodTarget, plantIndex, and coverIndex. The index of a particular target are
obtained from the functions – ProximityTest() and FindPreyType(). The Carnivore and Herbivore class uses the
AnimalInfo class to access their genotype via an XML file. These vagile agents are differentiated from the plant
agents by the AnimalState, movement variables and methods, and the lesser number of abiotic factors that affect
them.
FIGURE 10 HERE
5.
Discussions
This section is a reflection of our artwork after having successfully collaborated in this interdisciplinary
project, in having designed, implemented and deployed our exhibit in multiple venues, and interacted with
participants representing a diverse range of demographics.
In this project, we explored a particular interest on how an artwork can better engage with audiences via a
robust Mixed Reality interface, and as a positive consequence, investigated an innovative approach in
converging the real and the virtual in a true, Mixed Reality system. The content of our artwork was Darwinian
adaptation for survival. For this participatory art, we “mixed” reality by simulating virtual life which can be
interacted with via actual physical human activity, converging the virtual and the physical in an innovative
Mixed Reality system which we have formalized. We accomplished a truly mixed reality system by integrating
real-time display, artificial life, ecological simulation, and real-time sensors, and physical props in a
participatory artwork. Life itself and the shaping of life by nature’s forces have always fascinated humankind. A
mixed reality system requires such an aspect of work, our experience with the Shift-Life exhibit suggests that
virtual life can lengthen viewer participation, fascinate audience, promote discussions, and enhance content
sustainability. Our unique Shift-Life approach was the propitious provision by Darwin’s Bicentenary Shift-Time
Festival, and the eventful gathering of two faculties, allowing us to explore, and consequently experiment with
such an artwork, which we believe extends the concept of Mixed Reality to another level – for what is true