REAL CODED GENETIC ALGORITHM COMPARED TO THE CALSSICAL METHOD OF
FAST FOURIER TRANSFORM IN HARMONICS ANALYSIS
Naser Zamanan
(1), Jan K. Sykulski
(1)and A. K. Al-Othman
(2)(1) University of Southampton, UK (2) College of Technological Studies, Kuwait
ABSTRACT
Harmonics in voltages and currents comes from the daily equipments used in homes, industrial facility and offices. Any devices with non-linear characteristics may be injecting back harmful harmonic currents and voltages into the electrical system. Power Quality has become a factor in our life and Harmonics may affect the whole electrical environment and it can further degrade the power quality. In order to design harmonic filters to maintain power quality, the evaluation of harmonic distortion should provide an accurate measure of power system harmonics and exact characteristics of the voltage and current waveforms. This paper presents an enhanced measurement scheme for identification and tracking of harmonics in power system. The proposed technique is not limited to stationary waveforms, but can also estimate harmonics in waveforms with time-varying amplitudes. The paper compares the results obtained from Fast Fourier transform with results obtained by Real Coded Genetic Algorithm (RCGA), which is a technique for optimization inspired by genetics and natural evolution. The algorithm was tested using simulated data. The effects of sampling rate studied. Results are reported and discussed.
I
NTRODUCTIONThe difficulty in tracking and measuring harmonics comes from the fact that harmonic generating sources are dynamic in nature. As power semiconductors are switched on and off at different points on each cycle, damped transients are generated. When a fault happens on a transmission line, radical changes occur in the current and voltage waveforms. The magnitudes and phases of the fundamental frequency current and voltage signals are badly corrupted by noise, in the form of a DC offset as well as frequencies above fundamental frequency[1].
The classical Fourier transform is the mechanism by which we decompose the signal to find its harmonic content. We use The Fast Fourier Transform (FFT) to obtain voltage and current frequency spectra from discrete time samples. However, misapplication of the FFT algorithm may lead to incorrect results. The FFT algorithm has been applied successfully in power system harmonic measurements and analysis. However, there are several basic assumptions embodied in the application of FFT for harmonic analysis. These assumptions are [2, 3]:
• The signal is stationary (constant in magnitude) and periodic.
• The sampling frequency is greater than twice the highest frequency to be evaluated.
• The number of periods sampled needs to be an integer.
• Only integer multiples of the fundamental frequency are taken into account in the harmonic survey. Therefore, the waveform must not contain frequencies that are not
integer multiples of the fundamental frequency.
In fact, the fundamental frequency is the line frequency of the power system and the frequency resolution is the reciprocal of the sampling length of time. The sampling frequency (fs) is equal to the number of samples multiplied
by the frequency resolution defined in the application. When the above mentioned assumptions are satisfied, the results of the FFT are accurate. There are three major pitfalls in the application of FFT, namely aliasing, leakage, and the picket-fence effect [2, 3]. "Aliasing" is the phenomenon due to which high frequency components of time function can translate into low frequencies if the sampling rate is too low. The term "leakage" refers to the apparent spreading of energy from one frequency into adjacent ones. For the FFT algorithm to be applied, the third assumption must be satisfied to avoid "leakage". However, the fundamental frequencies of the current and the voltage in power system may not be exactly their nominal values. Moreover, there is always uncertainty in determining the actual fundamental frequency in the power system waveforms. The sampling rate of data acquisition and the sampling data are usually set at fixed numbers. If the truncation interval is not an integer multiple of the period of the fundamental, the so-called "spectral leakage" will occur since the sampled sequence will not be truncated exactly at the end of a cycle [4, 5]. In this case, the FFT algorithm will lead to incorrect results. The window techniques can be applied to the sampling data for reducing the spectral "leakage" in the FFT of such a sampled waveform [5]. The "picket-fence effect" occurs if the analyzed waveform includes a frequency which is not one of the discrete harmonics of the fundamental. Since the FFT is discrete, only the amplitudes of frequencies that fall exactly on these discrete points in the frequency domain are calculated exactly. Therefore, transients caused by
dynamic loads can affect the accuracy of the magnitudes of each harmonic.
In this paper the Real Coded Genetic Algorithm (RCGA), which is an optimization technique inspired by genetics and natural evolution, is used for tracking harmonics on power systems and compared with FFT, and the results obtained by the genetic algorithm are compared with the traditional method of Fourier.
FOURIER TRANSFORM
Fourier transform is a versatile tool used in many fields of science as a mathematical tool to alter a problem to one that can be more easily solved. The Fourier transform decomposes a signal or a function into a sum of sines and cosines of different frequencies which sum up to the original signal or function. The main advantage of Fourier transform lies in its ability to transfer the signal from its time domain to the frequency domain which usually contains more information about the analyzed signal [6]. The discrete Fourier transforms (DFT) yields frequency coefficients of a signal representing the projection of an orthogonal sine and cosine basis functions. This is an adequate method of analysis if a signal is predominantly sinusoidal, periodic and stationary. As power system disturbances are subject to transient and non-periodic components, the DFT alone may fail to provide an accurate signal analysis. Theoretically DFT can be applied to any serried of values but in practice for large series it takes considerable time to perform the required computations, the time taken being proportional to the square of the number of points in the series. A much faster algorithm was developed around 1965 called the Fast Fourier transform (FFT). The only restriction on the number of points using FFT is the number of points in the series which ideally it should be a power of 2. The computation time for FFT is proportional to , Where N is the number of points in the series [6]. The basic idea is to break up a transform of length N into two transforms of length N/2 using the identity of:
)
(
2
log
N
N
N k n j N n n N k n j N n n N nk j N n n e a e a e a / ) 1 2 ( 2 1 2 /0 2 1
/ ) 2 ( 2 1 2 / 0 2 / 2 1 0 + − − = + − − = − − = ∑ + ∑ = ∑ π π π (1)
THEHARMONICMODEL
A signal can be defined as a function that carries information, usually about a state or a procedure of a physical system. However, signals can be represented in several ways. Mathematically, a periodic and distorted signal can be suitably represented in terms of its fundamental frequency and harmonic components, expressed as a sum of sinusoidal waveforms referred to as the Fourier series. Each frequency is an integer multiple of
the fundamental system frequency. In order to obtain an approximation of such waves, mathematical models are employed. Consider a voltage waveform with harmonic components, written as Equation (2) [7, 8]
) cos(
1 cos( )}
{ )
( ο ∑ ω φ ωο +φο
=Α +
+ Α
= m t
i fi fit fi t
V (2)
Where:
• Αο is the fundamental voltage amplitude;
• ωο is the power frequency;
• Αfiis the amplitude of the flicker voltage;
• ωfi is the flicker voltage frequency.
• m is the number of flicker models.
• φfiis the phase angle of flicker voltage.
With only one flicker frequency this can be written as:
) 3 )( cos( ) 1 1 cos( 1 ) cos( )
(t =Αο ωοt+φο +Α ωf t+φf ωοt+φο V
Given that ωοis known, now the problem is to fine the optimum values for Αο,φο,Α1,ωf1,φf1 using RCGA.
GENETIC ALGORITHM
Genetic algorithm is a computational model that solves optimization problems by imitating genetic processes and the theory of evolution [9-11]. Solutions from a population are used to form a new population. This is motivated by the hope that the new population will be better than the old one. Solutions that will form new solutions are selected according to their fitness: the more suitable they are, the more chances they have to reproduce. This is repeated until some condition (for example, number of generations or improvement of the best solution) is satisfied. In the traditional GA, all the variables of interest must first be encoded as binary digits (genes) forming a string (chromosome).To minimize a function
f
(
x
1,
x
2,...,
x
k)
using GA, first, eachx
i is codedas a binary or floating-point string of length
m
Where:]
01011
...
11110
[
...
...
...
...
]
11110
...
00101
[
]
01001
...
10001
[
2 1=
=
=
kx
x
x
Where {
x
1,
x
2,...,
x
k} is called a chromosome andx
iareThen three standard genetic operations, i.e., reproduction, crossover, and mutation are performed to produce a new generation [9-11]. Such procedures are repeated until the pre-specified number of generations is achieved, or the required accuracy is satisfied.
other coding types have been considered for the representation issue, such as Real Coded Genetic Algorithms (RCGA), which would seem particularly natural when tackling optimization problems of parameters with variables in continuous or discontinuous domains.
In the real-coded GAs, a chromosome is coded as a finite-length string of the real numbers corresponding to the design variables. The real-coded GAs is rigorous, precise, and efficient Because the floating point representation is conceptually close to the real design space. In addition, the string length reduces to the number of design variables. A comparative study conducted by [12] has concluded that the real-coded GAs outperformed binary-coded GAs in many optimization problems.
Fitness Function
The fitness function (FF) is one of the key elements of GAs as it determines whether a given potential solution will contribute its elements to future generation through the reproduction process. The FF should be able to provide a good measure of the quality of the solution and should differentiate between the performances of different strings. In this study the fitness function is set to minimize the maximum individual error. The evaluation function is the function responsible for the determination of the fitness of each individual. Its objective is to evaluate the estimation error (e). The coded parameters are compared to the measured value in each time step V (t) to calculate the average error (e). We use the evaluation function as the function of the sum of quadratic errors. The error at each time step can be calculated as:
ei V
Vi(actual)− i(calculated) = For i=1,2,...m (4)
The quadratic error is calculated according to (5)
m i e Fsum
m i
∑ = =1
2
(5)
TESTING OF ALGORITHM
Equation 6 and 7 represent a transmission line fault situation as seen in [13]. A single phase to ground fault is used since it's the most common type and the fault is applied at a voltage peak since this is the worst condition concerning transients. With a pre-selected sampling rate and specified window size, the actual analogue signal is converted to discrete digital samples. A/D converters are used to generate the measurement vector [V]. The fitness function proposed earlier is used to evaluate the RCGA
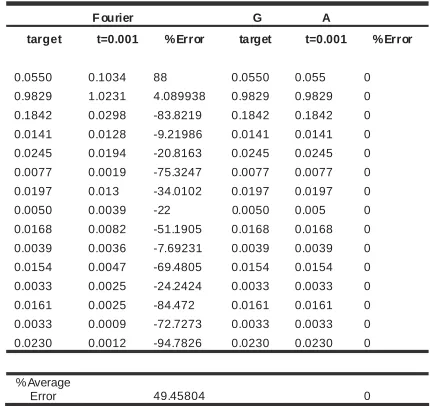
solution and compared to the solution of the FFT. A data window size of one cycle is used with fixed sampling frequency(Δt =0.001). Table 1 and 2 shows the results obtained using RCGA and FFT. From the obtained results, the numbers generated by the RCGA presented a much better estimation if compared to the traditional FFT method. Furthermore, and from the results showing below we can see that performance of the proposed method is superior if compared to Fourier estimation. In table 3 we have sampled the current I(t) to see at what stage FFT gives us a close result to RCGA. From the results in table 3 we can see that in order for FFT to achieve a very small Percentage of error to match RCGA accuracy it needs 200000 samples per cycle while the RCGA need only 20 samples per cycle. As a result of that, FFT needs more processing power and more computing time. It is clear now that RCGA has performed a better harmonic analysis and it could be used as a tool for power system problems.
V(t)=0.0550exp(0.4t)+0.9829cos(wt)+0.1842sin(wt)
+0.0141cos(2wt)+0.02454sin(2wt)+0.0077cos(3wt) +0.0197sin(3wt)+0.0050cos(4wt)+0.0168sin(4wt) +0.0039cos(5wt)+0.0154sin(5wt)+0.0033cos(6wt) +0.0161sin(6wt)+0.0033cos(7wt)+0.0230sin(7wt) (6)
I(t)=0.2491exp(0.4t)+0.9587cos(wt)+0.2841sin(wt) +0.0619cos(2wt)+0.1054sin(2wt)+0.0329cos(3wt) +0.0811sin(3wt)+0.0206cos(4wt)+0.0643sin(4wt) +0.0146cos(5wt)+0.0528sin(5wt)+0.0116cos(6wt) +0.0448sin(6wt)+0.0052cos(7wt)+0.0401sin(7wt) (7)
[image:3.612.332.547.502.705.2]
Table 1. Estimated harmonics magnitudes for V(t) using GA and FFT at Δt =0.001
Fourier G A
target t=0.001 %Error target t=0.001 %Error
0.0550 0.1034 88 0.0550 0.055 0 0.9829 1.0231 4.089938 0.9829 0.9829 0 0.1842 0.0298 -83.8219 0.1842 0.1842 0 0.0141 0.0128 -9.21986 0.0141 0.0141 0 0.0245 0.0194 -20.8163 0.0245 0.0245 0 0.0077 0.0019 -75.3247 0.0077 0.0077 0 0.0197 0.013 -34.0102 0.0197 0.0197 0 0.0050 0.0039 -22 0.0050 0.005 0 0.0168 0.0082 -51.1905 0.0168 0.0168 0 0.0039 0.0036 -7.69231 0.0039 0.0039 0 0.0154 0.0047 -69.4805 0.0154 0.0154 0 0.0033 0.0025 -24.2424 0.0033 0.0033 0 0.0161 0.0025 -84.472 0.0161 0.0161 0 0.0033 0.0009 -72.7273 0.0033 0.0033 0 0.0230 0.0012 -94.7826 0.0230 0.0230 0
% Average
Table 2. Estimated harmonics magnitudes for I(t) using GA and FFT at Δt =0.001
Fourier G A
target t=0.001 %Error target t=0.001 %Error
0.2491 0.3007 20.71457 0.2491 0.2491 0
0.9587 1.0265 7.072077 0.9587 0.9587 0
0.2841 0.1366 -51.9183 0.2841 0.2841 0
0.0619 0.0659 6.462036 0.0619 0.0619 0
0.1054 0.0803 -23.814 0.1054 0.1055 0.094877
0.0329 0.049 48.93617 0.0329 0.0329 0
0.0811 0.0494 -39.0875 0.0811 0.0811 0
0.0206 0.0327 58.73786 0.0206 0.0206 0
0.0643 0.0262 -59.2535 0.0643 0.0643 0
0.0146 0.0176 20.54795 0.0146 0.0146 0
0.0528 0.0097 -81.6288 0.0528 0.0528 0
0.0116 0.0023 -80.1724 0.0116 0.0116 0
0.0448 0.0011 -97.5446 0.0448 0.0448 0
0.0052 0.0164 215.3846 0.0052 0.0052 0
0.0401 0.0048 -88.0299 0.0401 0.0401 0
% Average
Error 59.95363 0.006325
Table 3. RCGA vs. FFT in term of Δt and accuracy for I(t)
Fourier G A
target t=0.0000001 %Error target t=0.001 %Error
0.2491 0.2481 -0.40145 0.2491 0.2491 0 0.9587 0.9587 0 0.9587 0.9587 0 0.2841 0.2847 0.211193 0.2841 0.2841 0 0.0619 0.0619 0 0.0619 0.0619 0 0.1054 0.1057 0.28463 0.1054 0.1055 0.094877 0.0329 0.0329 0 0.0329 0.0329 0 0.0811 0.0813 0.246609 0.0811 0.0811 0 0.0206 0.0206 0 0.0206 0.0206 0 0.0643 0.0645 0.311042 0.0643 0.0643 0 0.0146 0.0146 0 0.0146 0.0146 0 0.0528 0.0529 0.189394 0.0528 0.0528 0 0.0116 0.0116 0 0.0116 0.0116 0 0.0448 0.0449 0.223214 0.0448 0.0448 0 0.0052 0.0052 0 0.0052 0.0052 0 0.0401 0.0402 0.249377 0.0401 0.0401 0
% Average
Error 0.141127 0.006325
CONCOLUSION
A new application of genetic algorithms optimization technique was proposed for power system harmonics analysis and compared to FFT. The problem is addressed as an estimation problem. RCGA are used to solve this formulated optimization problem. This method based on Real Coded genetic algorithm was successfully tested using one sampling frequency. A brief comparison study has been made between RCGA and FFT for measuring harmonics and the results shows that RCGA has a much better results than FFT. In order for the FFT to get as close results as RCGA it needs more sampling per cycle and more processing power. The very accurate results obtained show that the proposed method can be used as a very
accurate on line harmonic estimator especially for signals with time varying magnitudes.
REFERENCES
1. J. Arrillaga, D.A.B., and P. S. Bondger, Power Systems Harmonics. 1985, New York: John Wiley & Sons.
2. Girgis, A.A., W.B. Chang, and E.B. Makram, A digital recursive measurement scheme for on-line tracking of power system harmonics. IEEE Transactions on Power Delivery, 1991. 6(3): p. 1153-1160.
3. Moo, C.S., Y.N. Chang, and P.P. Mok, A digital measurement scheme for time-varying transient harmonics. IEEE Transactions on Power Delivery, 1995. 10(2): p. 588-94.
4. Girgis, A.A. and F.M. Ham, A quantitative study of pitfalls in the FFT. IEEE Transactions on Aerospace and Electronic Systems, 1980. AES-16(4): p. 434-9.
5. Harris, F.J., On the use of windows for harmonic analysis with the discrete Fourier transform. Proceedings of the IEEE, 1978. 66(1): p. 51-83. 6. Haykin, S., Communication Systems, ed. 3rd.
1994, New York: John wiley & Sons, Inc. 7. Al-Hasawi, W.M., H.K.M. Youssef, and K.M.
El-Naggar. A genetic algorithm for on-line identification and tracking of power system harmonics. in Proceedings of 2000 Conference on Power and Energy Systems (PES 2000), 19-22 Sept. 2000. 2000. Marabella, Spain: IASTED/ACTA Press.
8. R. C. Dugan, M.F.M., H. W. Beaty, Electrical Power Systems Quality. 1996, United states: McGraw Hill.
9. Goldberg, D.E., Genetic Algorithms in Search Optimization and Machine Learning. 1989, Reading, Ma: Addison Wesely.
10. Coley, D.A., An introduction to Genetic Algorithms for Scientists and Engineers. 1999, Addison-Wesley.
11. Mitchell, M., An introduction to Genetic Algorithms. 1999, London England: MIT Press. 12. Janikow, C.Z. and Z. Michalewicz. Experimental
comparison of binary and floating point representations in genetic algorithms. 1991. San Diego, CA, USA: Publ by Morgan-Kaufmann Publ, Inc., Palo Alto, CA, USA.
[image:4.612.68.287.324.537.2]Ont., Canada: Institute of Electrical and Electronics Engineers Inc.
AUTHOR'S ADDRESS
The first author can be contacted at
Electrical Power Engineering Research Group School of Electronics and Computer Science University of Southampton