An Analytical Method to Find the Optimal Parameters for Gas
Detectors based on Correlation Spectroscopy using a Fabry-Perot
Interferometer.
Everardo Vargas-Rodriguez
*, and Harvey Rutt
†Optoelectronics Research Centre, University of Southampton,
Mountbatten Bldg., SO17 1BJ, Southampton, UK.
ABSTRACT
Several designs of infrared absorption based gas detector use a Fabry-Perot Interferometer (FPI) to modulate the incident light. In these systems, generally the FPI’s fringes are matched with very well defined rotational absorption lines of a target molecule such as CO2, CO, N2O, CH4, etc. In order to obtain modulation the cavity length of the FPI is scanned over one half of the reference wavelength. In this work, we present a simple analytical method based on the Fourier Transform that describes the performance of these systems. Using this method the optimal reflectivity and optical spacing of the FPI can be determined. Furthermore, the modulated signal generated by the system as a function of the cavity length scan can be calculated by applying the inverse Fourier Transform. Finally, this method describes the underlying reasons why for some filters the background amplitude is severe, and gives guidance on the choice of optimised filters. Our method evaluates the optimal FPI parameters and the modulated signal much faster than the direct numerical computation which is used currently. Simulation results for different molecules in combination with diverse filters shapes are presented, with a comparison to directly computed results.
KEYWORDS: Fabry-Perot Interferometer, Rotational Lines, Correlation Spectroscopy.
1. INTRODUCTION
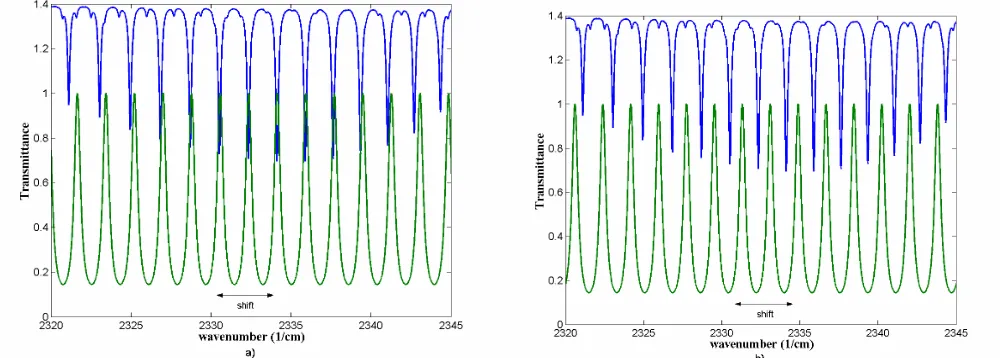
Several designs of infrared absorption based gas detector use a Fabry-Perot Interferometer (FPI) to modulate the incident light. Generally, this technique is applied in the region from 2-8 µm where many gases have their fundamental absorption bands. Some examples of detectors using this kind of modulator are given in references [1- 4]. Detectors based on correlation spectroscopy that use a FPI modulator are suitable to detect molecules with very well defined rotational absorption lines with Lorentzian line shapes. These lines are characteristic of most diatomic and linear molecules, i.e. CO2, CO, N2O, and some specific absorptions bands of symmetric top and spherical top molecules eg. NH3, CH4 at one atmosphere pressure. In these systems to induce the modulation, firstly, the FPI’s fringes are matched with the rotational absorption lines on the target molecule (Fig. 1a). Secondly, the FPI’s fringes are shifted along the wavenumber axis (Fig. 1b); this shift is obtained by scanning the cavity length of the FPI over a range of λ/2.6 Consequently, the transmission through the system changes as the FPI’s fringes are shifted along the wavenumber axis, producing the intensity modulation. The transmission through the system is given by
(
)
∫
∞(
) ( ) ( ) ( )
=
0 , , , , ,
,
,n d I v R n d T v Fil v S v dv R
ID δ FP δ (1)
where
v
is the frequency expressed in wavenumbers (1/cm), d is the FPI cavity length, R is the reflectivity, n is the refractive index of the medium between the FPI’s mirrors, and δ represents the instantaneous value of the cavity length.The FPI’s transmission fringe pattern is defined by the function IFP
(
v,R,n,d,δ)
, the filter transmission is defined by( )
vFil ; T
( )
v is the transmission trough the gas path, and the infrared source spectral profile is defined by S( )
v . As the cavity length of the FPI is scanned by one Free Spectral Range (FSR), around λ/2, a transmission value of ID(
R,n,d,δ)
[image:2.612.65.565.183.362.2]will be obtained for each change in the cavity length (δ ) producing a modulated signal. The amplitude modulation is defined as the difference between the maximum and the minimum values of ID
(
R,n,d,δ)
.Figure 1- Fabry-Perot fringes and target molecule rotational absorption lines. a)FPI’s fringes matched with the rotational lines; b) FPI’s fringes shifted along the wavenumber axis. The rotational lines are shifted up for clarity
The signal amplitude modulation produced by the detector ID
(
R,n,d,δ)
depends of several parameters such as the reflectivity (R) and the optical thickness (nd). We require the maximum possible amplitude modulation when the target is present T( )
v ≠1. Moreover, we require to have the minimum amplitude modulation when the target gas concentration is zero, T( )
v =1, this case is called background modulation. The simplest way to find the optimum values for R, nd, and δ is by numerical evaluation of equation (1). Here, the parameter values are changed simultaneously looking for the combination that gives the best compromise between the background modulation and the amplitude modulation. However, whilst this method is very simple to implement it is time consuming since takes a long time to compute all the possible combinations of R (0 to 1), nd (0 to∞
), and δ (0 to λ/ ). Furthermore the same procedure should be 2 repeated for each filter performanceFil( )
v . After the procured is finished the results are compared to select the best parameter combination and therefore decide which filter performance is best for the application. We have found that some filter performance shapes can seriously affect the background modulation.5 In the present paper we present a new approach based on the Fourier transform that can determine the optimum nd parameter value in a very simple way, and also simplifies the procedure to find the optimum R value. Furthermore, if the modulated signal produced by the system will be recovered by a Phase Sensitive Detector we have found that the optimum R value is 0.41.2. System Response described as a convolution
(
)
∫
∞(
) ( ) ( ) ( )
∆ =
∆
0 , , , ,
, ,
,n d v I v R n d v T v Fil v S v dv
R
ID FP
.
(2)As the filter performanceFil
( )
v , the transmission through the gas pathlength T( )
v , and the source profile do not change when the cavity length is varied, it is possible to express the product of these functions as( )
v
T
( ) ( ) ( )
v
Fil
v
S
v
G
=
.
(3)Hence (2) can be expressed as
(
)
∫
∞(
) ( )
∆ =
∆
0 , , , ,
, ,
,n d v I v R n d v G v dv
R
ID FP
.
(4)Now, considering that the shape and the symmetry of the FPI’s fringes do not change when they are shifted along one Free Spectral Range (FSR) (4) can be rewritten as
(
)
∫
∞(
) ( )
∆ − =
∆
0 , , ,
, ,
,n d v I v v R n d G v dv
R
ID FP
,
(5)Therefore the system response expressed by (1) was reduced into (5) which has the form of
( )
∫
∞(
) ( )
∞
− −
= f τ t k τ dτ
t
h
,
(6)which is the definition of the convolution function. Hence, the system can be solved in a very simple way by using the Fourier transform properties. It is important to recall that the Fourier transform of a convolution
( )
∗
is given by( ) ( )
{
f
t
∗
k
t
} ( )
=
h
ω
=
F
( ) ( )
ω
K
ω
FT
; (7)Therefore, the Fourier transform of (5) can be expressed as
(
)
{
I
DR
,
n
,
d
,
∆
v
}
=
I
D(
R
,
n
,
d
,
ω
)
=
I
FP(
ω
,
R
,
n
,
d
) ( )
G
ω
FT
; (8)transform to (8). In the next section we analyze the characteristics of the Fourier transform of the functions involved in (8) and using these characteristics we develop our approach to determine the optimum parameter values.
3. Fourier transforms characterization of the system functions.
In this section will be show that the optimal parameters n, d, and R can be obtained using the characteristics of the Fourier transforms of the system functions G
( )
v and IFP(
v−∆v,R,n,d)
. Consequently, the detector is optimized for the filter shape, for the source and for the rotational absorption lines of the target gas.3.1. Fourier transform of the FPI’s fringe transmission pattern
For simplicity we will start analysing the Fourier transform of the FPI’s transmission fringe pattern described by the Airy formula.7 Here, for clarity purpose it is convenient to use the Fourier series expansion of the Airy function8 that for normal incidence is given by
(
) (
(
)
)
(
)
⎭ ⎬ ⎫ ⎩ ⎨ ⎧ + + − =∑
∞ m mFP R m ndv
R R d n R v
I 1 2 cos 4π
1 1 , ,
, ; (9)
Hence, it is possible to observe that the Airy function is given by a sum of cosine functions of frequency m2nd. These frequencies are due to the period of the fringes, given by the FSR=1/2nd, which is the separation between two consecutive fringes. Thus, the first harmonic (fundamental) of the Airy Function has a frequency of 2nd, the second harmonic has a frequency of 4nd, the third harmonic of 6nd, and so on. The amplitudes of these cosine functions are given by
(
)
(
+)
= ∞−
= 2 1,2,.. 1 1 m R R R A m
m ; (10)
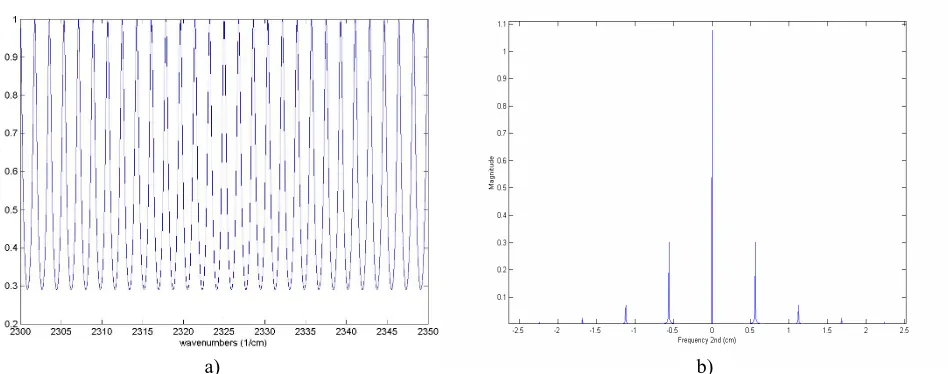
As the Airy function is expressed as a cosine series (9), therefore the Fourier transform of this function consists in a set of impulses centred at frequencies
±
m2nd and magnitude Am/2, which can be expressed as(
)
⎪⎩ ⎪ ⎨ ⎧ ≠ = = nd m nd m A d n RIFP m
2 ω 0 2 ω 2 , , ,
ω
.
(11)Figure 2- FPI transmission fringes characteristics. a) Transmission fringes profile as a function of wavenumbers; b) Fourier transform of the FPI fringes.
3.2. Fourier Transform characteristics of G
( )
v function, and optimum nd parameter value.The function G
( )
v represents the product of the source profile the filter performance and the transmission through the gas pathlength as stated in (3). In figure 3a it is shown an example of a G( )
v profile; in this example we are considering a measured filter performance in combination with a simulated CO2 absorption spectrum at 4.3 µm, the gas pathlength is 2 cm, and the CO2 concentration is 300 ppm. The Fourier transform of the G( )
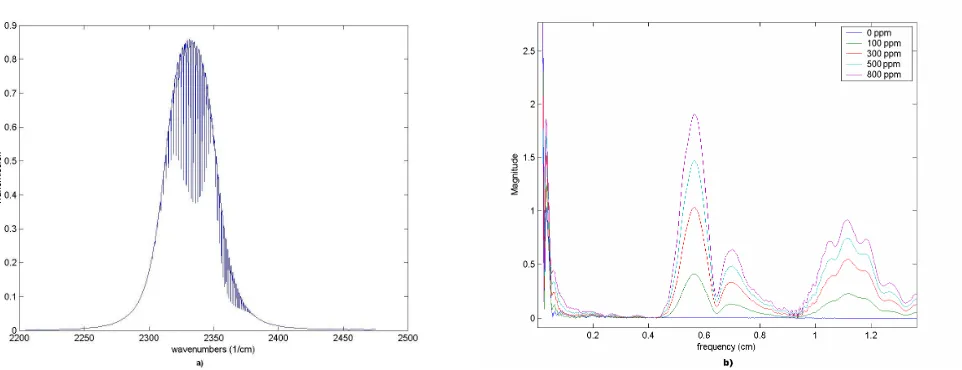
v spectrum is shown in figure 3b. From this figure we see that sidelobes appears at certain frequencies. The sidelobe positions in the Fourier spectrum give information related with the separation of the rotational absorption lines. Additionally in figure 3b we see that the magnitude of the sidelobes will increase as the concentration of the gas increases. From this figure it is clear how the magnitude of the sidelobes increases as the concentration increases whilst the magnitude for the other frequencies remains very close to zero. Therefore, as the amplitude modulation of the system was described by a convolution whose Fourier transform was expressed in (8), which is the product of G( )
ω and IFP(
ω,R,n,d)
, the modulated signal produced by the system will be different from zero if we make that the first impulse of IFP(
ω,R,n,d)
coincide with the range of frequencies where the first sidelobe of G( )
ω is. It can be carried out by directly analysingG( )
ω ; here we just look for the frequency were the first sidelobe peak of G( )
ω occurs(
ωmax)
and we see that the optimum value for the optical thickness of the FPI is nd =ωmax /2. Since in the Fourier spectra the magnitude of the FPI impulse remains constant therefore the greater the magnitude of the sidelobe peak the greater the amplitude of the modulated signal.3.3. Evaluation of the amplitude modulation and optimum R value.
In (8) we define the Fourier transform of the system response and in sections 3.1 and 3.2 we analysed briefly some of the Fourier transform characteristics of the functions involved in (8). As mentioned in section 2 we need to apply the inverse Fourier transform to (8) in order obtain the modulated system response expressed in (5). Hence, we have called the convolution method the process of numerical evaluation of (8) and after that evaluation of the inverse Fourier transform to get the modulated signal produced by the system. Computation of the full convolution method is much faster that the direct numerical evaluation of (1). Additionally the method allows us to predict in very simple way the optimum nd parameter value as shown in section 3.2. Moreover, the convolution method is helpful in finding rapidly the optimum R value for which the amplitude modulation is a maximum. This is possible since the optimum optical thickness of the FPI value can be obtained from G
( )
ω which means that the optical thickness is known nd =ωmax /2;therefore evaluation of (8) for different values of R implies that if the gas concentration does not change G
( )
ω remains constant and only IFP(
ω,R,n,d)
needs to be evaluated for each R value, reducing the number of computational operations. After that the modulated signal is obtained by applying the inverse Fourier transform of (8) for each value Rwe obtain the modulated signal as a function of R. In figure 4 we present a plot that shows the amplitude modulation as a function of the reflectivity obtained with the convolution method; here can be appreciated that for this case the optimum R value is around 0.45, where the maximum amplitude modulation is obtained. Additionally, in this plot we show the result obtained by direct numerical calculation of (1) can be seen that both methods produce practically the same results.
[image:6.612.80.561.215.400.2]Figure 3- a)G
( )
v profile showing the filter performance and the rotational absorption lines of CO2; b) Fourier transformG( )
ω , the magnitude of the sidedelobes around ω =0.55and 1.10cm increase with the CO2 concentration.The amplitude modulation signal is composed of a set of harmonics due to the impulses of IFP
(
ω,R,,n,d)
as definedby (11). Therefore, if the system response is recovered by a phase sensitive detector (PSD) just the first harmonic of the modulated signal produced by the detector ID
(
R,n,d,∆v)
is extracted whilst the rest of the harmonics are rejected.The first harmonic of ID
(
R,n,d,∆v)
corresponds to the first impulse of IFP(
ω,R,n,d)
. Consequently, to get the maximum amplitude modulation for the first harmonic we need to get the maximum magnitude possible for the first impulse of IFP(
ω,R,n,d)
. The magnitude of the IFP(
ω,R,n,d)
impulses is given by (11), from this equation we can express the magnitude of the first impulse as(
) (
(
)
)
RR R d
n R nd IFP
+ − =
1 1 ,
, ,
2
,
(12)By differentiation of (12) we find that the maximum of this function occurs when R=0.41. Therefore if the modulated signal will be recovered by a PSD a reflectivity of R=0.41 will guarantee the maximum amplitude modulation. Additionally from figure 4 it can be appreciated that the amplitude modulation produced using reflectivities within the range 0.3 to 0.6 are very close to the optimum, therefore using a reflectivity in this range will not produce significant change in the amplitude modulation. This result relaxes the FPI requirements since it was shown that a relatively low reflectivity is required to get the maximum amplitude modulation.
3.4. Minimisation of the background amplitude by filter shape optimisation
During the optimisation procedure we found that for some filter shapes the amplitude background, T
( )
v =1, increases dramaticcally, as reported in a previous paper.5 The reasons for this change is very well explained by the convolution method and in this paper we just give a brief review of this issue. The filter performance directly affects the G( )
v profile whilst the FPI’s fringe pattern remains unaffected. The characteristics of the Fourier transform of G( )
v will change for each filter shape, specially the shape and peaks of the sidelobes of G( )
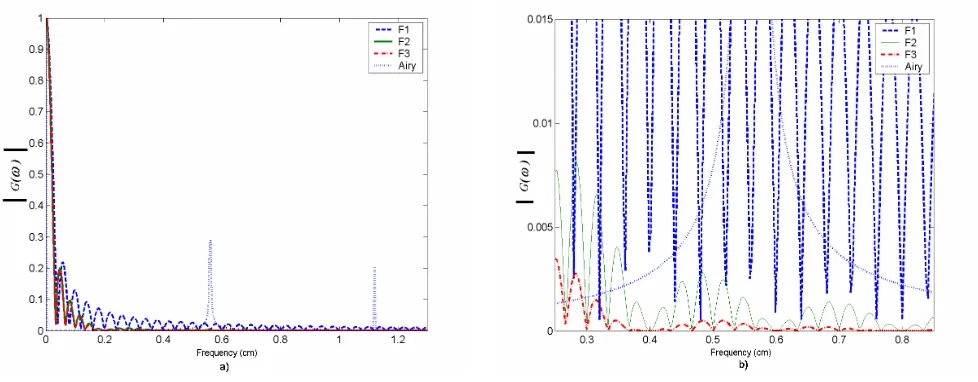
ω . For instance let us consider a set of ideal filters shown in figure 5. The Fourier transform of the filter shapes are shown in figure 6. From this figure it can be appreciated that the magnitude of the sidelobes for the square filter are much larger in comparison with the sidelobes produced by the other filters. For this case the position of the first FPI impulse Fourier spectrum is fixed atnd
2
ωmax = . As the amplitude of the modulated signal produced by the system depends directly on the magnitude of the sidelobes of G
( )
ω , therefore as the sidelobes produced by the square filter are considerable larger so the background modulation obtained with this filter will be considerably larger than the obtained with the other filters.Figure 5- Set of ideal filter performances
Figure 6- Fourier transform of the ideal filter set; b) detail of the filter Fourier transform in the region where the FPI impulse occur.
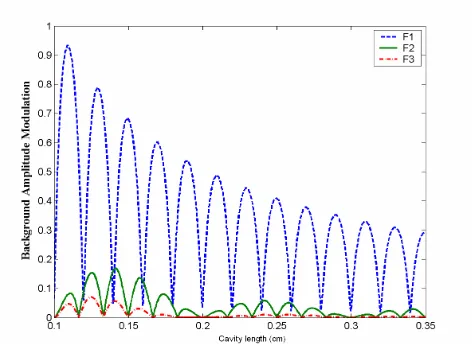
The background amplitude modulation as a function of the cavity length evaluated by direct numerical calculation of (1) is shown in figure 7. In this figure it is clear that the square filter produces the worst background modulation. Also can be appreciated that the background amplitude modulation follows the same pattern as the shown by the Fourier transform spectrum G
( )
ω. In general narrow band, very steep sided, ‘square’ shaped pass-bands filters will produce high background modulation, because the FT of these filters has high sidelobes, whilst filters with more gradual transitions to the stop-band have low sidelobes. This reduces the cost of the system, because in general filters with ‘soft sides’ are the best choice for the application and these filters are relatively cheap and easy to fabricate. [image:8.612.60.549.306.497.2]Figure 7- Background amplitude modulation as a function of the cavity length.
4. CONCLUSIONS
A new method to determine the optimal parameters for gas detectors based on correlation Spectroscopy using a Fabry-Perot Interferometer was presented. By using this method the FPI’s optical thickness can be quickly determined by analysing the Fourier transform characteristics of the system functions. The FPI mirrors reflectivity can be also easily determined and furthermore by this method is concluded that if the modulated signal produced by the system is recovered by a phase sensitive detector (PSD) the optimum reflectivity is 0.41. In most of the cases the reflectivity will be low (0.4-0.55) relaxing the mirrors requirements and reducing the cost of the system. Finally, this method underlying the reasons why narrow band, with very steep sided, ‘square’ shaped pass-bands filters will produce high background modulation, because the FT of these filters has high sidelobes, whilst filters with more gradual transitions to the stop-band have low sidelobes. This reduces the cost of the system, because in general filters with ‘soft sides’ are the best choice for the application and these filters are relatively cheap and easy to fabricate.
5. ACKNOWLEDGEMENTS
The CO2 filter was kindly provided by Dr R Dennis of Edinburgh Sensors. E. Vargas-Rodríguez is grateful to the Mexican National Council for Science and Technology (CONACyT) for a student research grant.
REFERENCES
1. W. Jin and G. Stewart and B. Culshaw and S. Murray and D. Pinchbeck, Absorption measurement of methane gas with a broadband source and interferometric signal processing, Optics Letters, 18(16):1364-1366, 1993 .
2. J. P. Dakin, C. A. Wade, D. Pinechbeck, and J. S. Wykes, A novel fibre methane sensor, SPIE, Vol 734. 3. J. P. Dakin Review of fibre optic gas sensors, The Plessey Company PLC, UK, 1988.
4. W. Jin, G. Stewart, B. Culshaw, and S. Murray. Source-noise limitation of fiber optic methane sensors, Applied Optics, 34(13):2345–2349, 1995.
5. E. Vargas-Rodriguez and H. N. Rutt, A Method to Minimise Spurious Background Signals in Gas Detectors based on Correlation Spectroscopy using a Fabry Perot by Bandpass Filter Shape Optimisation, Optical Engineering, to be published.
6. E. Hecht, Optics, Third edition, Addison Wesley, United States of America, 1998. 7. M. Born and E. Wolf, Principles of Optics, 3rd Edn, Pergamon Press, Great Britain, 1965.