;1111;
(Macropus eugenii)
Jan Michael Hernmi April 1998
This work has been undertaken at the Australian National University while supported with an Australian National University Phd Scholarship and an Overseas Postgraduate Research Scholarship. Prof. R.F. Mark has helped me with the preparation and the supervision of the animals throughout the physiology experiments. Dr. Ulrike Grunert stained one of the batches of horizontal sections for me and labelled figures 1, 2 and 3 in chapter 3. Most of the mechanics of the operant conditioning apparatus for the behavioural experiments in chapter 4 was produced by Istvan Zaveczky from the workshop of the Research School of Biological Sciences and the electronics for the same apparatus was designed and built by Mark Snowball and Geno Ewyk from the Neuroscience workshop. All other work with regards to this thesis is my own.
J
.
(~t
Index
Acknowledgements 7
Abstract 8
General Introduction 9
Visual acuity and contrast sensitivity (Chapter 1) 11 Spectral sensitivity of the photoreceptors (Chapter 2) 12 The retinal topography of the photoreceptors (Chapter 3) 13
Behavioural colour vision (Chapter 4) 13
Chapter 1: Visual acuity and contrast sensitivity 15
Abstract 16
Introduction 17
Materials and Methods 18
Behavioural experiments 18
Statistics 20
Visual Evoked Cortical Potentials 21
Estimation of the retinal magnification factor 24
Results 25
Behaviour 25
General aspects of training 25
Responses to different spatial frequencies 25
Controls 26
Additional influences on performance 28
Contrast sensitivity 32
Retinal Magnification - - -··-·· 33
Discussion 34
A comparison between behavioural and physiological measures of acuity 34
Anatomical upper limit 35
Comparison with other mammals-··· ___ 36
Acknowledgements 38
References 38
Chapter 2: Spectral sensitivity of photoreceptors 43
Abstract 44
Introduction 45
Materials and Methods 46
Microspectrophotometry (MSP) of rod photoreceptors 46
Tissue preparation 46
The microspectrophotometer (MSP) 46
Spectral absorbance measurements 4 7
Data analysis - 47
Electroretinogram (ERG) measurements 48
Results 52
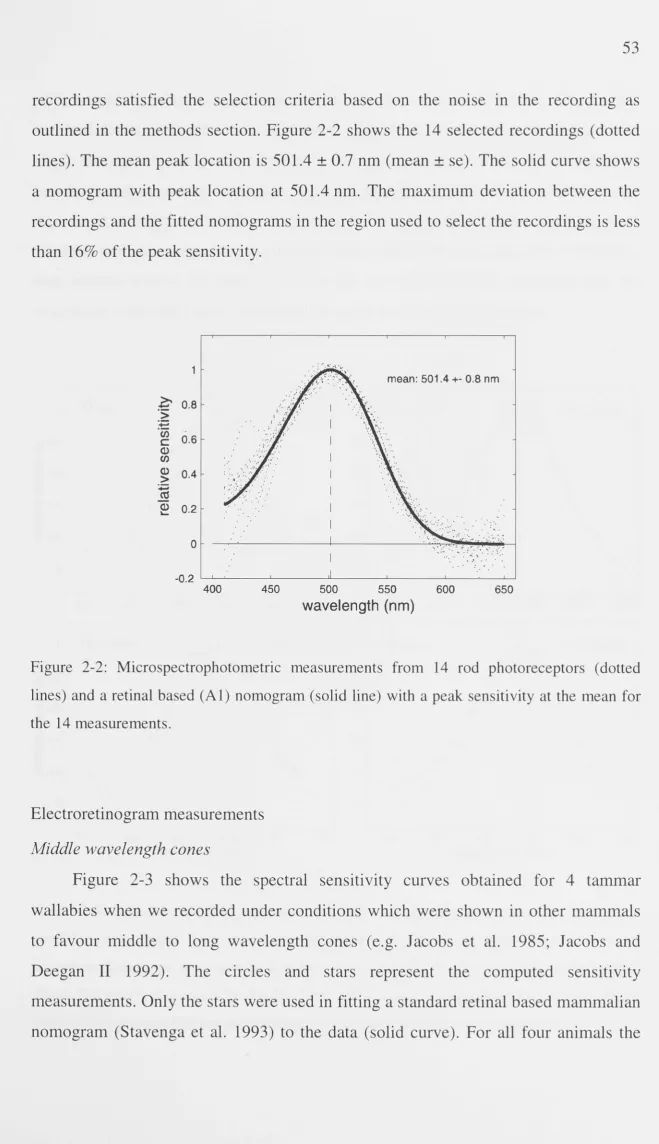
Microspectrophotometry 52
Electroretinogram measurements 53
Middle wavelength cones 53
Other photoreceptors 55
Discussion 57
Rod photoreceptors 57
Cone photoreceptors 58
Comparison with the American opossum 60
Conclusion 61
Acknowledgements 61
References 62
From physiology to anatomy 65
Chapter 3: Distribution of photoreceptor sub-populations 66
Abstract 67
Introduction 68
Materials and Methods 69
Animals 69
Tissue preparation 70
Immunocytochemistry 70
Antibodies 70
Immunostaining 71
Removal of the pigment epithelium 72
Selectivity of staining 72
Results 73
Differential staining and antibody specificity 73
Topography of photoreceptors. 78
M-cones 83
S-cones 85
Percentage of S-cones 88
Rods 91
Oil droplets ___ 92
Discussion 93
Antibody specificity 93
Spectral sensitivity 94
Topography of th~ photoreceptors 95
Oil droplets and double cones 97
Acknowledgements 98
References 98
From spectral sensitivity and its distribution to true colour vision 1 OJ
Chapter 4: Behavioural colour vision in the tammar wallaby 102
Abstract 103
Introduction 104
Materials and Methods 105
Animals 105
Apparatus 105
Design 106
Procedure 107
Experiment 1: Colour discrimination 108
Experiment 2: Range of colour discriminations 108
Experiment 3: Null-point 109
Experiment 4: Colour discrimination in the red 110
Results 111
General performance 111
Experiment 1: Colour discrimination 111
Experiment 2: Range of colour discriminations 112
Experiment 3: Null-point 114
Discussion 120
Colour vision 120
Spectral sensitivity of the short wavelength sensitive cone. 122
Colour perception of dichromats 123
Colour discrimination in the red 124
Comparative aspects 125
Acknowledgements 126
References 126
Summary and Conclusions 128
Acknowledgements
I am especially grateful to Richard Mark for g1v1ng me the freedom and encouragement to develop my own project and learn many different techniques. He has been supportive throughout. I am also grateful to Bill Muntz from Monash University for his introduction to microspectrophotometry, Ted Maddess from the Australian National University for teaching me the basic electroretinogram recording techniques and Ulrike Grunert from Sydney University for introducing me to the immunocytochemical techniques.
A special thanks also goes to Lauren Marotte. I greatly appreciated her constant support during the histological and physiological experiments.
Martin Hofmann and J avaan Chal introduced me to the Linux software and supported the development of the software to control the operant conditioning experiments. Thank you.
I am grateful to many individuals from both, the Developmental Neuroscience and the Visual Sciences groups for many fruitful discussions and comments during my time at RSBS, especially Andrew James, Almuth Kelber, Ted Maddess, Mandyam Srinivasan, Johannes Zanker and Jochen Zeil. For help with regards to specific papers, individuals are acknowledged at the end of the respective chapters.
Abstract
This study is concerned with the relationship between anatomical and
physiological characteristics of the early visual system in the tammar wallaby and
some of its basic visual functions such as visual acuity, contrast sensitivity, spectral
sensitivity and colour vision. The behavioural visual acuity was estimated in dual
forced choice experiments to be about 4.8 c/deg. The contrast sensitivity, measured
by evoked potentials, showed a peak at 0.15 c/deg, but a slightly lower associated
acuity of 2. 7 c/deg, as compared to the behavioural estimate. An
immuno-cytochemical study of the retina of the tammar wallaby showed that it is clearly rod
dominated, but also contains a low percentage of cone photoreceptors (3-5% ),
belonging to two different cone classes. The retina shows an interesting topography
with both cone populations having very distinct distributions. The short wavelength
sensitive cones represent about 5-30% of all cones, depending on the retinal location.
Based on these distributions and in conjunction with the already known ganglion cell
distribution, it is suggested that the retina of the tammar wallaby can be divided into
three distinct regions with different functional specialisations: Spatial sensitivity
(ventral retina), spatial acuity (central streak) and spectral sensitivity (dorsal retina).
This argument is based on the relative numbers of ganglion cells and the two different
cone populations. The spectral sensitivity of the wallaby's middle wavelength
sensitive cones was measured electrophysiologically to have a peak at 540 nm,
whereas the rods were found to peak at 500 nm. An independent
microspectrophotometric study of the rod sensitivity confirmed this estimate. The
spectral sensitivity of the short wavelength sensitive cones could not be determined
electrophysiologically and was estimated from behavioural experiments to peak at
about 420 nm. The same behavioural experiments showed the wallaby to have acute
colour vision of a dichromatic nature. From the results of these studies, the tammar
wallaby can be characterised as having a spatial acuity of about 5 c/deg with a peak in
contrast sensitivity at 0.15 c/deg. It has acute dichromatic colour vision, based on a
420 nm and a 540 nm cone pigment, and its retina shows a differentiated topography
Introduction
The studies presented here are concerned with the relationship between the
fundamental visual capabilities of acuity, contrast sensitivity, spectral sensitivity and
colour vision in the tammar wallaby and the relevant features of the anatomy and
physiology of its eye.
The marsupials add an interesting comparative perspective to our understanding
of the relationship between the environment and the visual system in mammals.
Eutherian mammals and marsupials probably separated in evolutionary history at
some point during the Cretaceous period (Lillegraven 1979). The Australian
marsupials in particular, underwent a strong radiation during which they produced a
variety of forms and adapted to many different environments. By comparing
marsupials with each other and with eutherian mammals, one can infer what the
visual system of their common ancestors may have been like and also the way in
which different environments mould and shape sensory systems. The separation of
traits that have evolved in response to a particular environment and traits that are
based on a common ancestry is not a straightforward process, however. The
marsupials, having separated from the eutherian mammals at such an early date in
evolutionary history, and yet being subject to many of the same environmental
pressures as their present day eutherian counterparts, are ideal subjects to explore and
separate the factors that led to the traits we see today. Before we can achieve this
goal, we first need to know more about marsupials, however.
In recent years, the tammar wallaby has proved itself a valuable mammalian
model for neuronal development. A growing number of studies, including many
investigating the visual system, have taken advantage of the marsupials' enormous
potential for developmental research (Cassidy et al. 1994; Taylor and Guillery 1994;
Harman et al. 1995; Hoffmann et al. 1995; Dunlop et al. 1996; Ding and Marotte
1997; Dunlop et al. 1997; Freeman et al. 1997; Ho 1997; Marotte et al. 1997). The
marsupials' unique reproductive system allows easy access to the young at a very
early developmental stage. Wallabies are born just 28 days after conception, long
example, the optic axons have not reached the brain at birth and it will take 140 more
days before the eyes open (Wye-Dvorak 1984; Ding and Marotte 1997).
Developmental studies and studies on mature systems often interact in a mutually
beneficial way. Together, both fields can provide important insight into questions that
are difficult to answer when studying just one field in isolation. For example, the
functional emergence of cortical subsystems during development is important in
understanding the hierarchical layering in the adult animal. Once the subsystems are
fully developed, it is more difficult to isolate their functions. At the same time,
developmental studies are greatly facilitated by and should be viewed in the context
of the final functional system. The studies presented in this thesis, are intended to
provide some information about the fundamental characteristics of the mature visual
system of the tammar wallaby.
In order to understand the processing of visual information one first needs to
know, what information is extracted by the retina from the environment and passed
on to the brain. Visual acuity, contrast sensitivity, spectral sensitivity and colour
vision, are some of the basic parameters in which one can describe the retinal input
that is limiting cortical processing. There are of course others; such as temporal
resolution or motion sensitivity, which are not covered here, that may or may not be
limited by the retina.
The overall plan of this work has been to correlate anatomical and
physiological measurements of the retina with behavioural measurements and to see
to what extend they agree. In such basic detection or discrimination experiments, one
would, in general, expect the animals to be able to make use of the retinal output up
to its limits and would expect a good correlation between behavioural, physiological
and anatomical methods.
The studies reported in this thesis, are presented in four chapters, followed by a
brief overall summary. The chapters are organised as independent papers that have
been published (Hemmi and Mark 1998) or submitted for publication. Between each
Visual acuity and contrast sensitivity (Chapter 1)
Visual acuity, or more generally contrast sensitivity, is an important
characteristic of an animal's eye design. It sets quite strict limits as to what
information reaches the brain to be used for controlling various kinds of visual
behaviours. Acuity is a very popular measure, because it can be expressed as a single
number, which allows a large range of diverse animals and millions of bespectacled
humans, for that matter, to be compared easily. Visual acuity, or more precisely
resolution acuity, also seems to be related in a straightforward manner to the quality
of the optics and the density of the neural sampling (see Hughes 1977 for a more
detailed discussion). It is important, however, to keep in mind that when discussing
resolution acuity, it is just one possible measurement of the quality of the eye. Some
animals might find some forms of hyperacuities (Westheimer 1975) to be more
important for their needs. Also, contrast sensitivity is not an isolated trait. The need
of a fast moving animal to have a high temporal resolution will impact on its ability
to achieve a high resolution acuity.
Even though there has been strong interest in the retinal topography of the
ganglion cell distribution in a number of marsupials (Hughes · 197 5; Hokoc; and
Oswaldo-Cruz 1979; Tancred 1981; Silveira et al. 1982; Beazley and Dunlop 1983;
Kolb and Wang 1985; Harman et al. 1986; Wong et al. 1986; Schmid et al. 1992;
Dunlop et al. 1994; Arrese et al. 1998), only two studies have measured the visual
acuity behaviourally (Harman et al. 1986; Arrese et al. 1998) and only one study has
measured the contrast sensitivity using visual evoked cortical potentials (Silveira et
al. 1982).
Therefore, the first study undertaken in the tammar wallaby set out to measure
the behavioural visual acuity in a dual forced choice paradigm, using an experimental
design that permitted the estimation of the influence of a range of factors on the
animals' behaviour and therefore on the final acuity estimate. Due to the
time-expensive nature of this type of experiment, visual evoked cortical potentials were
used to complement the visual acuity measurement with an estimate of the complete
and this estimate was compared with the behavioural acuity and the ganglion cell
density.
Spectral sensitivity of the photoreceptors (Chapter 2)
The second chapter is concerned with the spectral sensitivity of the wallaby's
photoreceptors. The spectral sensitivity of an animal's photoreceptors determines
both, the amount of light the eye can absorb and the spectral range which is visible to
the animal. In fish, for example, these constraints have led to a strong correlation
between the spectral sensitivity of the rod photoreceptors and the animals'
environment (e.g. Loew and Lythgoe 1978; Levine and MacNichol 1979; Lythgoe
and Partride 1991 ). In .mammals, on the other hand, all species investigated seem to
have a rod photoreceptor with a peak sensitivity around 500 nm ( e.g. Lythgoe 1972;
Bowmaker 1991). The spectral sensitivities of the cone photoreceptors has in recent
years been measured in a number of mammals (see Jacobs 1993 for a review). To
date, however, there has not been enough information about the animals' light
environments in combination with their spectral sensitivities in order for a convincing
correlation between the two to be attempted.
Despite the interesting evolutionary relationship between marsupials and
eutherian mammals, only one study has tried to measure the spectral sensitivity of the
photoreceptors in a marsupial, the Virginia opossum (Didelphis virginiana). This
study provided evidence for the presence of only one cone pigment of about 560 nm
peak sensitivity and has found no indication for a short wavelength sensitive cone
class (Jacobs 1993).
In an attempt to measure the spectral sensitivity of the tammar wallaby's cones
and rods, two different methods were used: Microspectrophotometry, which operates
on the isolated cone outer segments and an electroretinogram based method, which
I.II
The retinal topography of the photoreceptors (Chapter 3)
Since evidence was found for only one cone photoreceptor in the tammar
wallaby, just as has been the case in the opossum (Jacobs 1993), An
immunocytochemical study was undertaken to determine whether this method could
confirm the absence of any short wavelength sensitive cones (S-cones) in this retina.
With the development of antibodies against specific visual pigments, it has become
possible to identify cone classes belonging to different spectral sensitivities. This
method has so far been very successful in predicting the presence of S-cones or
middle to long wavelength sensitive cones (MIL-cones). The different antibodies
seem to work across a range of species from chicken to humans, but cannot
discriminate between M and L-cones in mammals (for summaries see: Szel and
Rohlich 1989; Szel et al. 1996).
The second equally importqnt reason for undertaking such a study has been that
it allows a topographic analysis of the photoreceptor distributions. Such an analysis,
as well as in primates, has now been undertaken in a range of mammals (Muller and
Peichl 1989; Wikler and Rakic 1990; Petry et al. 1993; Juliusson et al. 1994; Rohlich
et al. 1994; Szel et al. 1994; Ahnelt et al. 1995; Famiglietti and Sharpe 1995; Peichl
1997). It has become apparent that retinae are by no means as homogeneous as one
might expect based on the primate retinae. Different animals sometimes show quite
striking differences between the distributions of their cone classes and between cones
and ganglion cells (Muller and Peichl 1989; Petry et al. 1993; Rohlich et al. 1994;
Ahnelt et al. 1995).
Two different cone classes could be identified in the tammar retina and their
topography mapped across the retina. The results are compared to published ganglion
cell densities for the same species (Tancred 1981; Wong et al. 1986).
Behavioural colour vision (Chapter 4)
A second aspect connected to the spectral sensitivity of photoreceptors which
was not mentioned above, is that of colour vision. If an animal has more than one
\1;
therefore to see colour. This would literally add a whole new dimension to an animal's perception. Colour vision is a very powerful sense that enables its user to detect objects that do not provide a luminance contrast against the background or recognise objects despite that fact that they are cut into segments by strong luminance boundaries, such as those that may have been cast by the shadow of a tree.
Evidence is presented in the study of the retinal topography (chapter 3), for a low density S-cone population which is present throughout the retina. This is a strong indication for colour vision. However, there is only one way to show that this is a valid conclusion and that is through behavioural experiments. A carefully designed behavioural experiment can prove that an animal has colour vision, by showing that the animal can make discriminations between two lights based on their colour (hue), independent of their brightness. In addition, such an experiment will also enable the estimation of the spectral sensitivity of the photoreceptors involved.
Chapter 1
Visual acuity, contrast sensitivity and retinal magnification in a
Marsupial, the tammar wallaby
(Macropus eugenil)
Abstract
The visual acuity of the tammar wallaby was estimated using a behavioural
discrimination task. The wallabies were trained to discriminate a high contrast (80%)
square wave grating from a grey field of equal luminance (1000-6000 cd/m2). Visual
evoked cortical potentials were used to measure the complete contrast sensitivity
function. The stimulus was a sinusoidal phase reversal of a sinusoidally modulated
grating of various spatial frequencies and contrasts with a mean luminance of
40 cd/m2. The behavioural acuity was estimated to be about 4.8 cycles/deg. The
contrast sensitivity peaked at about 0.15 c/deg and declined towards both lower and
higher spatial frequencies. The cut-off frequency of the contrast sensitivity function is
slightly lower than the behaviourally measured acuity at about 2.7 c/deg. The retinal
magnification factor was estimated anatomically from laser lesions to be about
0.16 mm/deg. Based on the known ganglion cell density and the retinal magnification
factor, an anatomical upper limit to visual acuity of about 6 c/deg can be calculated.
The differences in estimates of visual acuity between the behavioural and anatomical
Introduction
A range of marsupials have now been investigated in regard to their ganglion
cell distribution in the retina (Hughes 1975; Hokoc; and Oswaldo-Cruz 1979; Tancred
1981; Silveira et al. 1982; Kolb and Wang 1985; Harman et al. 1986; Wong et al.
1986; Schmid et al. 1992; Dunlop et al. 1994) and its development (Beazley and
Dunlop 1983). The tammar wallaby in particular has received attention with studies
ranging from the development of anatomy and functionality of the retino-cortical
projections (e.g. Vidyasagar et al. 1992; Mark et al. 1993; Ding and Marotte 1997)
electrophysiological studies of motion vision (e.g. Ibbotson et al. 1994) and the
distribution sizes and classes of ganglion cells (Tancred 1981; Wong et al. 1986).
The present study is designed to provide behavioural and physiological
information about the visual acuity of the mature visual system in the tammar
wallaby. Visual acuity, or more general contrast sensitivity is a fundamental limiting
characteristic of a visual system and needs to be taken into account when interpreting
visual performances. The behavioural visual acuity was measured by means of a
discrimination task and compared to a physiological measurement derived from the
cut-off frequency of the contrast sensitivity function measured by Visual Evoked
Cortical Potentials (VECP). We also measured the Retinal Magnification Factor
(RMF), which allowed us to calculate a theoretical upper limit to visual acuity, based on estimates of the peak ganglion cell density from the literature (Tancred 1981;
Wong et al. 1986).
The tammar wallaby is a small kangaroo like marsupial that weighs between
4-8 kg. On Kangaroo Island, South Australia, where this species occurs naturally, the
wallabies spend the day in the scrub which they leave after dusk to feed in the open
grass plains during the night (Inns 1980). Animals in captivity show some activity
throughout the day, but again, are mostly active in the late afternoon and during the
night (Blakers 1972, personal observations). Even though the tammar wallaby is a
Materials and Methods
Behavioural experiments
Two mature male tammar wallabies were used in this study, both of which were
bred at the Australian National University and raised in social groups in large outdoor
paddocks. The two animals, Zauss and Flecke completed 1152 and 504 trials,
respectively.
The experimental design used to measure the limit of visual acuity, was a two
alternative forced choice paradigm. The tests were performed in the animal's normal
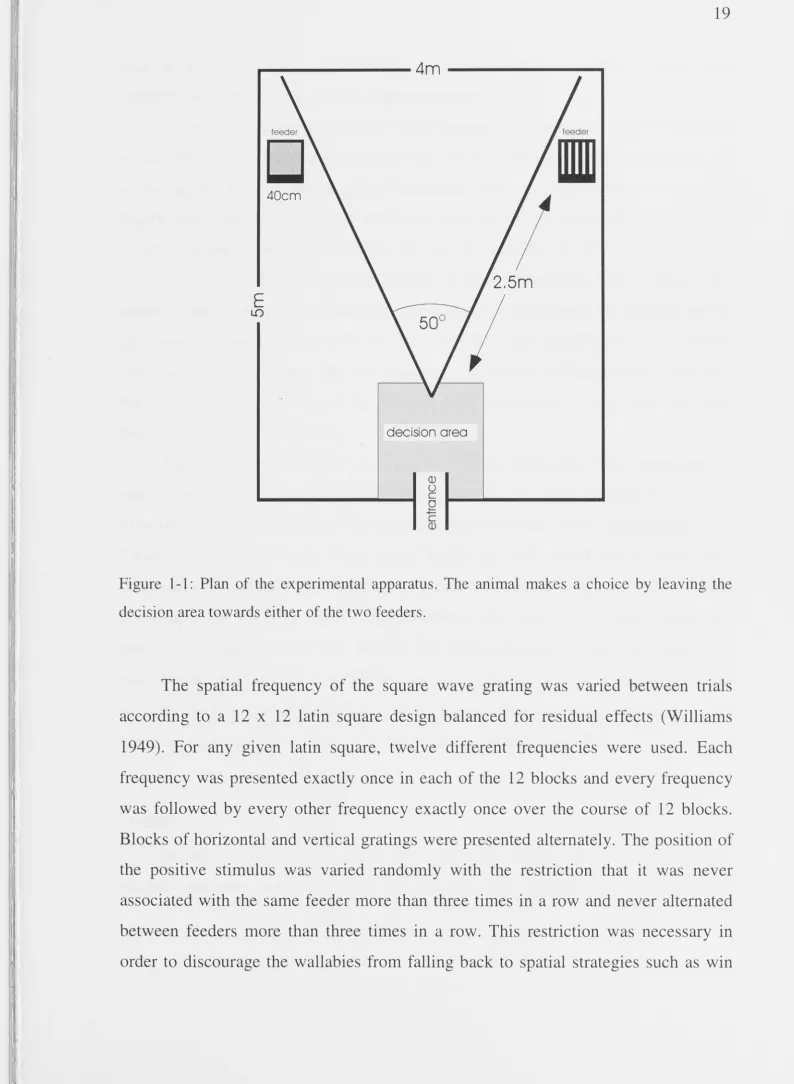
home paddocks, where an area of 5 by 4 meters (figure 1-1) containing a two-arm
maze was set aside. At the end of each arm, at 2.5 meters distance from the decision
area, was a feeder that was marked either by a high contrast (86%) square wave
grating pattern or a uniform grey field of equal space-averaged luminance. The
targets were squares with 40 cm side length which had an angular size of 7.7° as seen
from the decision area. The two feeders were separated by two opaque walls that
were placed at an angle of 50° relative to each other. The entrance area was
deliberately kept narrow in order to force the animal to approach the decision area
straight on and slowly.
The animals were initially trained to distinguish a horizontal grating of
1.05 c/deg from a uniform grey field of equal average luminance. Correct decisions
were rewarded by a few pellets of their usual supplement food, which was placed in
the feeder just below the grating. The food was invisible from a distance greater than
about 50 cm from the feeder. At the beginning of the training the animals were
allowed to turn round after a wrong choice and inspect the second feeder (marked
with the grating) and take the reward which was present there. Later in the training
and during the tests, the animals had to leave the maze immediately after a wrong
choice, after which the position of the grating (left or right feeder) was randomly
changed before the animal was allowed to re-enter the maze and make a new choice.
The wallabies learned to accept this procedure and usually left the maze of their own
.---4m---...
40cm
E
I..()
Figure 1-1: Plan of the experimental apparatus. The animal makes a choice by leaving the
decision area towards either of the two feeders.
[image:19.842.5.799.66.1150.2]stay or win shift. An animal making choices according to either of these two
strategies would still only get 50% correct choices.
After the completion of a set of latin squares (1 vertical and 1 horizontal), the
spatial frequencies were adjusted according to the performance of the animals by
increasing the interval between the frequencies. This was done to keep the animals
highly motivated by keeping the average trial reasonably easy. The total set of
frequencies used was: 0.35, 0.7, 1.05, 1.4, 1.8, 2.15, 2.35, 2.5, 2.75, 2.85, 2.95, 3.2,
3.55, 3.9, 4.15, 4.75, 5.35, 6.5. The purpose of the overall design was to balance for
random effects such as side differences, sequence of presentation and residual effects
of frequencies on the next trial. At each trial the light, temperature and weather
conditions were recorded. The luminance of the stimuli varied between 1100 and
6800 candelas/m2 accdrding to the outdoor light conditions. Testing was generally
done between 0800 and 1200 h.
Two control experiments were run immediately before the main experiment in
order to show that the percentage of correct responses was not affected by the food
location. For both animals this was well after they reached a stable performance level.
Trials alternated between a lower spatial frequency ( 1.05 c/deg) · and a high spatial
frequency (3.55 c/deg) and each was presented against a grey field of mean
luminance. For the high spatial frequency trials the reward was placed under the
positive stimulus (grating) only. For the low spatial frequency trials, the reward was
placed under both, the positive and the negative stimulus (grey field). In the second
control, the low spatial frequency had food under the positive feeder only, which
could be compared to the case where the food was under both feeders.
Statistics
In order to measure the effects of the different experimental conditions on the
fitted to the data: probit (probability of success) = constant
+
effects due to variablesand possible interactions between them
The random variation in the model was assumed to be binomial. An initial model
probit(p) = Intercept
+
animal+
block was fixed to allow for differences betweenanimals (2 level factor) and a change of response accuracy over the 4 sets of la tin
squares (blocks, 4 level factor). Other variables were then added to the model and
their effects explored. Significant variables were included. All variables were tested
for an interaction with frequency. Significance was judged according to the deviance
differences between models (McCullagh and Nelder 1989).
Visual Evoked Cortical Potentials
Two adult tammar wallabies (male/female, 4.5 kg each) were used in the
electrophysiological experiment. Both animals came from the same breeding colony
as described above. The animals received an intramuscular injection of 0.46-0.65 mg
Atropine Sulphate (Atrosine mitis, Parnell) 30 minutes prior to the experiment. They
were first anaesthetised with an intravenous injection of 50 mg thiopentone sodium in
a 5% solution (Pentothal, Boehringer) through a butterfly needle (23G) inserted into
the lateral tail vein. Anaesthesia was continued using thiopentone sodium as required
until the animal was put on a continuous iv. infusion of 3.6 mg/kg/hr of sodium
pentobarbitone (Nembutal, Boehringer) in a compound sodium-lactate solution
(Baxter) 5.6 ml/hr. The infusion also contained 7 mg/kg/hr of suxamethonium
chloride (Scoline, DBL) to maintain paralysis of skeletal muscles. The animals were
artificially ventilated with a 1 :3 mixture of oxygen and nitrous oxide through a 4 mm
Sheridan endotracheal canula. The animals' temperature was maintained at 37
degrees centigrade by a thermostatically controlled heating blanket. Before the animal
was placed into the stereotaxic frame, the hair on its head was cut short, to allow the
placement of subcutaneous electrodes. To assess the depth of the anaesthesia the
electrocardiogram was continuously monitored. The CO2 in the expired air was kept
between 4 and 5% throughout the experiment by adjusting the rate or stroke volume
of the respirator. The animals were euthanased with an overdose of sodium
pentobarbitone after completion of the experiment.
Visual evoked potentials were recorded using three silver/silver-chloride wires
placed subcutaneously. The recording electrode was placed on top of Vl, the
reference electrode temporal on the animal's head behind the ( closed) ipsilateral eye
and the common earth was placed on the animals upper neck. The electrodes were
connected to a two-stage preamplifier with a gain of 50,000, the output of which was
fed into an AID-converter. Cortical voltage responses were sampled at 1.6 kHz
(exactly 16 times the frame rate). Stimulation and recording were both run from the
same clock for exact synchronisation. Visual stimuli were generated on a computer
controlled imaging display (Barco calibrator) driven by a Truevision ATVista
graphics board at 100 Hz frame rate. The visual stimulus subtended an area of 30x30
degrees at a viewing distance of 0.5 m. The stimuli were a range of horizontal
sinusoidal luminance gratings with different spatial frequencies and varying contrasts.
The phase of these gratings was reversed at a temporal frequency of 4 Hz, according
to a sinusoidal luminance modulation. The space averaged lu1ninance was kept
constant at 40.3 cd/m2. In the stereotaxic frame the animals' heads were held in such
a way that the area of highest ganglion cell density, the visual streak, projected
approximately to the horizon (Tancred 1981; Mark et al. 1993). The monitor was then
placed 50 cm from the animal such that the centre of the grating pattern aligned with
the horizon and then moved horizontally until a maximum response was recorded.
For both animals, the final position was very close to being just in front of the animal,
slightly offset towards the stimulated eye. This is consistent with expectations based
on the location of the highest ganglion cell density which projects to directly in front
of the animal (Tancred 1981; Wong et al. 1986; Mark et al. 1993). The opposite eye
was kept closed by taping its lid with adhesive tape.
A 2.12 Diopter hard contact lens was placed onto the recording eye. The animal
was then refracted by placing an additional lens in front of the eye. The strength of
1.25 c/deg spatial frequency and a contrast of 0.5 was obtained. The final refraction
was +3.12 D for both animals.
The contrast sensitivity was measured for eight spatial frequencies (0.07, 0.1,
0.13, 0.2, 0.4, 0.8, 1.6, 3.2 c/deg). The fast fourier transform was applied to the
results and the second harmonic of the modulation frequency (in the complex plane)
was compared to twenty neighbouring frequencies to determine whether it was
significantly different from zero (James et al. 1995). For each spatial
frequency-contrast combination recordings of 120 phase reversals were repeated at least 5 times
and then until, a) the average of the second harmonic of the input frequency was
significantly different from O (p<0.05), or b) a maximum of 20 recordings were
completed. If the second harmonic was found to be significantly different from 0, the
contrast was lowered and the same routine was applied again. If it failed to become
significant within the 20 trials, the contrast was increased and the same recording
procedure repeated. The starting contrast for each frequency was close to one.
Contrast sensitivity was determined as the inverse of the contrast for which at least
two out of three such blocks showed a significant result and at the next lower contrast
at most one out of three blocks showed a significant result. This method was adopted
because in an initial investigation we did not find a clear linear or close to linear
relationship between VECP amplitude and the logarithm of contrast (Jacobs et al.
1980, Silveira et al. 1982). Contrast was usually determined to within about one third
of an octave.
The presentation of spatial frequencies was organised in such a way that all
frequencies were presented in randomised order, each at its own current contrast.
Then the contrast was individually adjusted for all frequencies as stated above and the
next block of frequencies was tested. This assured that there were no large contrast
(perceived contrast) changes between trials near cut-off contrast and that any changes
in either signal or noise levels would affect all frequencies equally, therefore not
distorting the shape of the contrast sensitivity function. The two highest frequencies
were usually dropped about half way through the experiment in order to save
Estimation of the retinal magnification factor
Results
Behaviour
General aspects of training
It took some four months of daily training until the animals participated consistently and reliably in the experiment and until spatial response patterns, such as side preferences and alternation, had disappeared. Normally it was possible to complete two blocks (24 trials) per day per animal. After the training period, the animals seemed to try hard to make a correct choice and avoid errors. They would hop at great speed into the decision area, stop and slowly move their head to shift their gaze from one pattern to the other ( often several times) therefore clearly facing each pattern before making a decision.
Responses to different spatial frequencies
The animals' responses were clearly frequency dependent. Figure 1-2 shows the combined responses from both animals averaged over all conditions. Numbers indicate the number of decisions at each spatial frequency. The performance of the wallabies declined with increasing spatial frequency of the grating, from almost 100% at low frequencies to about 50% at higher frequencies. Since the performance of the two animals was clearly similar and statistically not different (df 1, d=l.03,
1 0 0 ~ ~ ~
90
[image:26.842.72.794.54.1158.2]BO
...
(..)
Q.) 70
,._
,_ 0
(.)
60
~ 0
501--.
40
30
0
•.:-...:.·.
138 ·.. . . ·.
1 :38. . . · '4 • 48
· · .• 14- 96 • 114·. · 42.
- 90
. • -138 • 90
48
~ - mean response
··· 95%CI
.... ~ _48
• 90
• 24
2 3 4 5 6
Spatial Frequency (Hz)
7
Figure 1-2: The percentage of correct choices plotted against the spatial frequency of the
stimulus. The numbers refer to the number of decisions at each frequency. The lines
correspond to the fitted mean function (see methods for the fitting routine) and the
approximate 95 o/o confidence envelope for the mean. Depending on the cut-off criteria, the result is consistent with a visual acuity of about 4-5 cycles/degree.
Controls
I.., 100 90 80
-
(.) Cl)... 70 ... 0 (.)
I so r ns
~
0
50>-· · ·
40 30 l 0 X o·. X X X x·. 0 181 0
- - Zauss X
· · · Fiecke
X
2 3 4 5
Spatial Frequency (Hz)
0
6 7
Figure 1-3: The percentage of correct responses for each of the two experimental animals
plotted against the spatial frequency of the stimulus. The performance of both animals is very
similar and their responses are statisti~ally not different.
100
90
80
t5 70
d)
b 60
0 <.) 50 ... i::: d) <.) 40 I-< d) 0-. 30 20 10 0 n=50 n=50
Zauss Flecke
spatial Frequency c/deg
EJ 3.55 c/deg food under
positive stimulus only
:::::·:::::::::::::J--- • 1.05 c/deg food under both stimuli
llilll 1.05 c/deg food under
positive stimulus only
Figure 1-4: Two control experiments show that the percentage of correct responses is not
affected by the food location. Trials alternated between a low spatial frequency (1.05 c/deg)
and a high spatial frequency pattern (3.55 c/deg), each presented against a grey field of mean
[image:27.842.84.734.89.426.2]stimulus (grating) only (column 1), the animals could not distinguish between the two feeders
and choose randomly. In the low spatial frequency trials, where the reward was placed under
both feeders (column 2), the animals chose the positive feeder with 93 % accuracy. This
percentage did not change in a second control ( column 3 for each animal), with the same low
spatial frequency pattern (1.05 c/deg). Here the food was present only under the positive
feeder (88 o/o ).
The improvement at the low spatial frequencies from about 90% correct trials (figure 1-4, columns 2 & 3) to about 98% during the main experiment (figure 1-2), did not seem to reflect an improvement in the wallabies performance over time. Rather, the fact that the wallabies were presented with a mixture of a wide variety of frequencies seemed to-enhance both their motivation and accuracy. Note that the main experiment also has an in-b~ilt control in that, at high spatial frequencies the response is expected to approach 50%, as can be seen in figure 1-2.
Additional influences on performance
The experimental design allowed the influence of various experimental factors on the wallabies' performance to be separated out. Several factors were found to influence the animals choice accuracy such that the final statistical model (see methods) included the following terms:
probit(p) = Intercept
+
animal+
block+
frequency * (light+
orientation)+
overcastwhere: frequency = spatial frequency of the grating
overcast = 3 level factor measuring amount of sky covered by clouds light = 2 level factor measuring light conditions, measured as whether the
animal cast a shadow onto the ground (sunny conditions) or not (shady conditions).
Figure 1-5 shows the effect of the different light conditions (df 2, d=6.5,
p<0.05). The condition for a particular trial was judged to be sunny (which it was in
the vast majority of the trials), when the animal cast a shadow on the ground. This
turned out to be almost perfectly correlated with a mean luminance of the grating of
more than 2200 cd/m2.
90
BO
...
(.)
Q) 70 .... ....
0 (.)
I 60
~
0
0
P < 0.05
X XX
X
.
if',o
0 · .Q ~ 0
X 0 X 0 0 X 0
- - sunny cond. X
· · · shady cond.
0
5QI-· · · .. -U. . ... ~
X 0
40 X
30 X
0 2 3 4 5 6 7
Spatial Frequency (Hz)
Figure 1-5: The percentage of correct responses under different light conditions (sun or
shade) plotted against the spatial frequency of the stimulus. Under sunny light conditions
(high mean intensity), the reduction in percentage of correct choices with spatial frequency is
slower than for shady conditions (low light intensities, diffuse illumination). The
experimental conditions did not allow us to determine whether this is due to differences of
absolute light levels or to differences in light quality, such as how diffuse the light was under
the two conditions.
It is not possible to distinguish with the data at hand whether the effect is due to
the brightness of the targets or to a change in light quality. During shady conditions
(lower light intensities), the light was much more diffuse than during sunny
conditions (higher light intensities). The effect of this variable is frequency dependent
which means its influence depends on the spatial frequency of the grating. Under high
[image:29.845.83.770.92.1134.2]spatial frequency was slower than for lower light conditions. It is important though to
keep in mind, that even the lowest light intensity of the grating (1100 cd/m2) is
significantly higher than could normally be achieved under normal laboratory
conditions. The high variance found in the results for shady conditions is due to few
repetitions, especially at the higher frequencies.
Figure 1-6 shows the influence of the amount of cloud in the sky on
performance (df 2, d=7.6, p<0.05). The amount of cloud is a good measure for the
stability of the weather conditions. The wallabies performed best under a clear sky
(less than 1/ 3 overcast) and worst under a partially clouded sky (1/ 3-2/ 3 overcast). A
partially cloudy sky was usually associated with a moderate wind and a change in
weather. This effect had no significant interaction term with spatial frequency which
means its influence is the same for all spatial frequencies. It simply shifts the mean
response curve to the left or to the right. This supports the interpretation that the
weather affected the animals' motivation to attend to the visual stimulus rather than
its ability to see the grating. Again, the clear majority of the trials were performed
under the animals preferred conditions (no clouds or full cloud cover), which explains
the higher variance found in the results for a partial cloud cover: The effect of the
clouds is independent of the light conditions as discussed above and its effect persists
after the data has been adjusted for different light conditions and vice versa.
Applying the criterion of 60% correct choices, the performance of the wallabies
improves slightly from about 4.4 c/deg under average experimental conditions to
1 0 0 ~ ~ x+
... -:-o - 0
90
BO
t5 (1) 70 .... .... 0
(.)
I 60
~
X . x· · 0 ' x 0
·X ~' o
' to \jl
·.+ ' 0
0- "
X
0
·.,, ~
X X '\._
X X + X '-- , 0
"
~·. + '
- - 0/3-1/3 overcast
X
+ 1 /3-2/3
overcast 2/3-3/3 overcast
X
X
P < 0.05 x·. ' '" o
+ 0 . '
501-· · · . ,-,.,
X
40
30
0 2 3 4 5
Spatial Frequency (Hz)
6
+ 0
7
Figure 1-6: The percentage of correct responses under different weather conditions. The
animals performed best under clear sky and worst, under a partially cloudy sky. This effect
was found to be significant, even after adjusting for light conditions. The effect of the
weather is the same for all frequencies, supporting the interpretation that the unstable weather
affected the animals' motivation, thus, increasing the number of trials in which the animals
ignored the visual cues completely. The graph illustrates the sensitivity and reliability of the
technique used. Adverse factors influencing the animals performance could be quantitatively
assessed and taken into account when interpreting the data to estimate the visual acuity.
[image:31.845.63.796.76.506.2]90
BO
... c..:>
Q) 70
...
...
0
c..:>
I 60
~
0
X
0
P < 0.005 X
·._lmxx X
·.o
0 0
0
0 >( .
o"
X ~
o . I - - vert1ca
X .
· · · horizontal
0
501-· · __ _ _ _ _ _ _ _ _ _ _ _ _ _ _ _ _ :...:...:...:....:....:...=::::::
40
X
0 30
0 2 3 4 5 6
Spatial Frequency (Hz)
7
Figure 1-7: The percentage of correct responses for horizontal and vertical gratings plotted
against the spatial frequency of the stimulus. At low frequencies the animals performed better
for horizontal gratings, but at high frequencies this difference disappears or even reverses
slightly. This effect is thought to be a training effect (see text for details).
Contrast sensitivity
The results from the VECP experiments are presented in figure 1-8 where the contrast sensitivity measurements for two animals have been plotted along with a thin plate spline function through the data points (Wahba 1990). The results obtained from the two animals are very similar. The contrast sensitivity shows a peak at around 0.15 c/deg and declines toward higher and lower spatial frequencies. The extrapolated visual acuity based on these curves for the two animals are 2.4 and 3.0 c/deg with a mean of 2.7 c/deg.
[image:32.845.84.766.56.517.2]ill,t al.
~
(/J 64
~ c 32
0 ~ T'"" --16 ~ -~ ;t::::
~ 8
Q)
(/)
t5 4
~
+-'
C:
0
() 2
/
*
· ..
,
··.
·.,
·.
1 L _ _ . . L . _ _ _ - 1 . . . _ _ _ l _ _ . . . l _ _ __J__ _ _ _ _ J _ ~ C } - - - - . J L - _ _ _ J
0.06 0.125 0.25 0.5 1 2 4 8 Spatial Frequency (Hz)
Figure 1-8: The contrast sensitivity functions for two animals as determined by the cortical
VEP. The results are very similar with a peak in sensitivity around 0.15 c/deg. The highest
spatial frequency from which significant results could be obtained under the experimental
conditions was 1.6 c/deg (but see text for higher spatial frequencies). From this graph we can
estimate the visual acuity to be about 2.7 c/deg (mean of both animals).
Retinal Magnification
For f 407, the result of the retinal magnification factor is based on 9 clearly
visible lesions that could be attributed to particular laser locations. The fitting routine
gives a horizontal RMF of 0.162 + 0.0035 mm/deg (mean + ste) and a vertical RMF
of 0.157 + 0.0063 mm/deg. For animal f995 28 lesions were clearly visible. The
resulting horizontal RMF was 0.159 + 0.001 mm/deg and the vertical RMF of 0.168 +
0.0036 mm/deg. For animal f995 the vertical RMF is slightly higher than the
horizontal RMF. For the purpose of calculating an anatomical upper limit to visual
acuity, we used the mean of these measurements, 0.161 mm/deg. The ganglion cell
distribution has been looked at in two different studies, both of which agree on a
highest total ganglion cell density of about 5600 cell/mm2 (Tancred 1981; Wong et al.
1986). Using the sampling theorem (Shannon and Weaver 1949, see 1977 for a
[image:33.845.106.724.90.429.2]Discussion
A comparison between behavioural and physiological measures of acuity
We have measured the visual acuity of the tammar wallaby using both a
behavioural and a physiological approach. The behavioural estimate under favourable
conditions, that is high light intensities (luminance >2200 cd/m2) and a clear sky, is
4.8 c/deg which is only a slight increase from 4.4 c/deg under average conditions. The
acuity estimate based on the contrast sensitivity function obtained by VECP is
slightly lower at 2. 7 c/deg.
Before accepting the results of the behavioural experiments, it is important to
be sure that the animals performed reliably. Working outdoors in the wallaby's
normal home paddock could potentially have introduced a range of factors
influencing the animals' accuracy. It had the distinct advantage, however, of keeping
these shy animals calm and focused on the task. Besides, visual performance in the
animals' natural setting is of behavioural significance. Even though the wallabies
were rather difficult to train, once they had learned the task and were accustomed to
the procedure, they performed very well, often taking seconds to make a decision,
even when originally approaching the apparatus at considerable speed. The
experimental design and the statistical treatment enabled us to measure the influence
of a large range of factors on the animals choice behaviour. Only two factors were
found to be significant, light and weather conditions and their influence on the acuity
estimate was rather small (figure 1-5 & 6).
A partial explanation for the lower acuity estimates obtained with the
physiological method might be found in the much lower light intensities used
(40 cd/m2 as opposed to 1100-6900 cd/m2 for the behavioural experiments). The
behavioural experiments did suggest that the wallabies performed better under
brighter light conditions (figure 1-5), although it cannot be ruled out that the
improvement was not due to a change in light quality ( at lower light intensities, the
light was also more diffuse, see results). In comparison, tree squirrels' visual acuity
improved almost two fold from 2.2 to 3.9 c/deg when the luminance of the test
South American opossum shows no significant change in visual acuity with a two log
unit change in light levels (Silveira et al. 1982).
A second reason for the discrepancy may be a methodological one. Cambell
and Kulikowski ( 1972) showed that if the threshold contrast is determined by
extrapolating the VECP recordings to the contrast which would produce zero voltage,
the contrast sensitivity matches the behavioural sensitivity. The same was later found
to be true in the cat (Campbell et al. 1973; Bisti and Maffaei 1974). In the present
study contrast threshold was determined, without extrapolation, as the lowest contrast
for which a response that was significantly different from zero could be recorded.
This procedure leads to a decrease in the contrast sensitivity across all frequencies,
and therefore of the acuity estimate, but it preserves the shape of the contrast
sensitivity function. Extrapolation to zero voltage would shift the contrast sensitivity
curve vertically upwards towards higher sensitivities and would therefore shift the
predicted acuity cut-off to towards higher spatial frequencies. The fact that we were
able to record significant responses to a 3.2 c/deg grating when we increased the
number of presentations is consistent with this idea.
Anatomical upper limit
An anatomical upper estimate of visual acuity can be calculated from the
ganglion cell density based on the sampling theorem (Shannon and Weaver 1949, see
Hughes 1977 for a discussion). Thibos (1987) argued that, in the fovea of humans the
quality of the optics threshold rather than the ganglion cell density sets the limit for
the resolution (Campbell and Gubisch 1966), while resolution in the periphery is
limited by the density of the beta or midget ganglion cell sub-population. It is
unlike! y, however, that the ganglion cell density exceeds the optical image quality in
any part of the retina and it should therefore provide a valid upper limit to visual
acuity (as opposed to hyperacuity, Westheimer 1975). The highest total ganglion cell
density in the tammar wallaby is about 5600 cell/mm2 (Tancred 1981; Wong et al.
1986). This value was arrived at by counting all classes of ganglion cells. The
calculated estimate of visual acuity should therefore slightly overestimate the true
reasonably well with the behavioural results ( 4.8 c/deg), but is a factor of 2 higher than the VECP results. The anatomical estimate is, of course, entirely dependent upon the actual proportion of ganglion cells involved in the respective spatial task. Silveira et al. ( 1982) using the extrapolation method, also found a twofold mismatch between the VECP-acuity and the anatomical estimate in the South American opossum and argued that only a fraction of the ganglion cells are processing spatial information. The close fit between the behavioural and anatomical acuity estimates in the tammar suggest, however, that the majority of ganglion cells are involved in the acuity task.
Comparison with other mammals
A comparison of. contrast sensitivity in the tammar wallaby with that of other mammals can be seen in figure 1-9. Even with the threshold criteria used in this study, the highest sensitivity of the tammar is higher than that of most smaller mammals with the exception of the rabbit and the cat. On the other hand, the behavioural acuity of the tammar wallaby is slightly higher than that of the rabbit (2-3 c/deg, Van Hof 1966; Yaney 1980), but again lower than that of.the cat (5-9 c/deg, e.g. Mitchell 1991).
In conclusion, the contrast sensitivity of the tammar wallaby has a standard
128
~
0 64
....
+-C
0 ~
r
-~ 32
.>
::!:::
Cl)
C
Q)
16
Cl)
1i5
0 '
-
+-C
0
u
84
2
tammar: behavioural acuity
1..._ _ _ ___._ _ _ _ ___._ _ _ _ _._ _ _ _ ..._ _ _ _ ~ - - - ~ - - ~ - - - ~
0.06 0.125 0.25 0.5 2 4 8 16 32 64
Spatial frequency (c/deg)
Figure 1-9: Comparison of the behaviourally or electrophysiologically determined spatial
contrast sensitivity functions for a variety of mammalian species. Solid curves are thin plate
splines (Wahba 1990) through the data points of the following published studies.
Behaviourally determined CSF, Human: (1) DeValois et al. 1974, (2): Birch and Jacobs
1979; Cat: Bisti and Maffaei 1974; Tree squirrels: Jacobs et al. 1982; Rats: Birch and Jacobs
1979; Electrophysiologically determined CSF, Ground squirrel: Jacobs et al. 1980; South
American opossum: Silveira et al. 1982; Tree shrew: Petry et al. 1984; Rabbit: Pak 1984;
[image:37.845.91.746.81.669.2]''i '\
Acknowledgements
We thank Dr. L.R. Marotte for help with the electrophysiological experiments, Dr A. James for allowing us to use his software routines to interface the hardware and Dr. J. Zeil for his thorough criticism of the manuscript. We are grateful to Dr. T. Hesterberg and Dr. S. Barry for their advice on the statistical treatment of the results. We also thank Ms A. Devlin and Mr. K. Williams for taking care of the animals.
The experiments comply with the "principles of animal care", publication no. 86-23, revised 1985 of the National Institute of Health. They are also in compliance with the Australian Capital Territory Animal Welfare Act (1992) and were covered by two Ethical Protocols (RDN.44.95 & RDN.31.93) approved by the animal experimentation ethics committee of the Australian National University.
References
Beazley LD, Dunlop SA (1983) The evolution of an area centralis and visual streak in the marsupial Setonix brachyurus. J Comp Neurol 216: 211-231
Birch D, Jacobs GH (1979) Spatial contrast sensitivity in albino and pigmented rats. Vision Res 19: 933-937
Bisti S, Maffaei L (1974) Behavioural contrast sensitivity of the cat in various visual meridians. Journal of Physioloy 241: 201-210
Blakers M (1972) Aspects of the behaviour, in captivity, of the tammar wallaby
(Macropus eugenii, (Desmarest)). Honours Thesis Zoology Department,
Australian National University.
Cambell FW, Kulikowski JJ (1972) The visual evoked potential as a function of contrast of a grating pattern. J Physiol 222: 345-356
Campbell FW, Gubisch RW (1966) Optical quality of the human eye. J Physiol 186: 558-578
"!\ i I
'
DeValois RL, Morgan H, Snodderly DM (1974) Psychophysical studies of monkey vision: III. Spatial luminance contrast sensitivity test of macaque and human observers. Vision Res 14: 75-81
Ding Y, Marotte LR ( 1997) Retinotopic order in the optic nerve and supenor colliculus during development of the retinocollicular projection in the wallaby
(Macropus eugenii). Anat Embryol 196: 141-158
Dunlop SA, Ross WM, Beazley LD ( 1994) The retinal ganglion cell layer and optic nerve in a marsupial, the honey possum (Tarsipes rostratus). Brain Behav Evol 44: 307-323
Harman AM, Nelson JE, Crewther SG, Crewther DP (1986) Visual acuity of the northern native cat (Dasyurus hallucatus) - Behavioural and anatomical estimates. Behav Brain Res 22: 211-216
Hoko<; JN, Oswaldo-Cruz E (1979) A regional specialization in the opossum's retina: quanitative analyses of the ganglion cell layer. J Comp Neural 183: 385-396 Hughes A ( 197 5) A comparison of retinal ganglion cell topography in the plains and
tree kangaroo. J Physiol 244: 61-63
Hughes A ( 1977) The topography of vision in mammals of contrasting life style: Comparative optics and retinal organisation. In: Crescitelli F (ed) Handbook of Sensory Physiology, vol. VII/5: The visual System in Vertebrates. Springer, Berlin. pp 613-756
Ibbotson MR, Mark RF, Maddess TL (1994) Spatiotemporal response properties of direction-selective neurons in the nucleus of the optic tract and dorsal terminal nucleus of the wallaby, Macropus eugenii. J Neurophysiol 72: 2927-2943
Inns RW (1980) Ecology of the Kangaroo Island wallaby, Macropus eugenii (Desmarest), in Flinders Chase national park, Kangaroo Island. Phd Thesis University of Adelaide.
Jacobs GH, Birch DG, Blakeslee B (1982) Visual acuity and spatial contrast sensitivity in tree squirrels. Behav Processes 7: 367-375
Jacobs GH, Blakeslee B, McCourt ME, Tootell RBH (1980) Visual sensitivity of ground squirrels to spatial and temporal luminance variations. J Comp Physiol
·~i
11
James AC, Maddess T, Rouhan K, Bedford S, Snowball M (1995) Evidence for My-cell involvement in the spatial frequency doubled illusion as revealed by a multiple region PERG for Glaucoma. J Opt Soc Am VSIA Tech Dig 1: 314-317 Kolb H, Wang HH ( 1985) The distribution of photoreceptors, dopaminergic amacrine
cells and ganglion cells in the retina of the North American opossum (Didelphis
virginiana). Vision Res 25: 1207-1221
Mark RF, James AC, Sheng XM (1993) Geometry of the representation of the visual field on the Superior Colliculus of the wallaby (Macropus eugenii). I. Normal Projection. J Comp Neurol 330: 303-314
McCullagh P, Nelder JA (1989) Generalized Linear models, 2nd ed. Chapman & Hall. London
Mitchell DE (1991) The long-term effectiveness of different regimens of occlusion on recovery from early monocular deprivation in kittens. Phil Trans R Soc Lond B 333: 51-79
Moulton LH, Zeger SL (1991) Bootstrapping generalized linear models. Comp Stat Data Ana 11: 53-63
Pak MA ( 1984) Ocular refraction and visual contrast sensitivity of the rabbit, determined by the VECP. Vision Res 24: 341-345
Petry HM, Fox R, Casagrande VA ( 1984) Spatial contrast sensitivity of the Tree Shrew. Vision Res 24: 1037-1042
Schafer D (1969) [Experiments on the physiology of the eye of the tree shrew Tupaia
glis (Diard, 1820)]. Z vergl Physiol 63: 204-226
Schmid KL, Schmid LM, Wildsoet CF, Pettigrew JD (1992) Retinal topography in the koala (Phascolarctos cinereus). Brain Behav Evol 39: 8-16
Shannon CE, Weaver W ( 1949) The Mathematical Theory of Communication. University of Illinois Press.
Silveira LCL, Picanco-Diniz CW, Oswaldo-Cruz E (1982) Contrast sensitivity function and visual acuity of the opossum. Vision Res 22: 1371-1377
Thibos LN, Cheney FE, Walsh DJ (1987) Retinal limits to the detection and
resolution of gratings. J Opt Soc Am A 4: 1524-1529
Van Hof MW ( 1966) Discrimination between striated patterns of different orientation
in the rabbit. Vision Res 6: 89-94
Yaney DI (1980) The grating acuity of the wild european rabbit. Vision Res 20:
87-89
Vidyasagar TR, Wye-Dvorak J, Henry GH, Mark RF (1992) Cytoarchitecture and
visual field representation in Area 17 of the tammar wallaby (Macropus
eugenii). J Comp Neurol 325: 291-300
Wahba G (1990) Spline models for observational data. CBMS-NSF Regional
Conference series in applied mathematics, V59. Philadelphia: Society for
Industrial and Applied Mathematics.
Westheimer G (1975) Visual acuity and hyperacuity. Investigative Ophthalmology
'
14: 570-572
Williams EJ ( 1949) Experimental designs balanced for the estimation of residual
effects of treatments. Austr J Sci Res A 2: 149-168
Wong ROL, Wye-Dvorak J, Henry GH (1986) Morphology and distribution of
neurons in the retinal ganglion cell layer of the adult tammar wallaby