2-1961
Reduction of niobium pentoxide by carbon
Ernest Roger StevensIowa State University H. A. Wilhelm Iowa State University
Follow this and additional works at:http://lib.dr.iastate.edu/ameslab_isreports Part of theMetallurgy Commons
This Report is brought to you for free and open access by the Ames Laboratory at Iowa State University Digital Repository. It has been accepted for inclusion in Ames Laboratory Technical Reports by an authorized administrator of Iowa State University Digital Repository. For more information, please contactdigirep@iastate.edu.
Recommended Citation
Stevens, Ernest Roger and Wilhelm, H. A., "Reduction of niobium pentoxide by carbon" (1961).Ames Laboratory Technical Reports. 45.
Abstract
The investigations of the reduction of niobium pentoxide by carbon showed that niobium metal could be prepared by a direct reduction. High temperatures in the region of 2000°C but below the melting point of niobium and dynamic vacuum of one micron or less were the principal experimental conditions employed throughout the course of this study. The reaction, which followed very closely the stoichiometry of the equation Nb2o5 +5C ---> 2Nb + 5CO, began at a temperature near 1200°C and was nearly completed at 1600°C. The data indicated that it might be possible to allow reduction to take place at approximately 1800°C. After the reaction is completed at this temperature, raising of the temperature of the reaction material to nearly 2000°C might eliminate residual oxygen as a result of volatilization of a lower oxide of niobium.
Disciplines Metallurgy
PHYSICAL SCIENCES READING ROOM
REDUCTION OF NIOBIUM PENTOXIDE BY CARBON
By
Ernest Roger Stevens H. A. Wilhelm
February 1961
LEGAL NOTICE
This report was prepared as an account of Government sponsored work. Neither Ule United States, nor the Commission, nor any person acting on behalf of the Commission:
A. Makes any warranty or representation, expressed or implied, with respect to the accu-racy, completeness, or usefulness of the information contained in this report, or that the use of any information, apparatus, method, or process disclosed in this report may not infringe privately owned rights; or
B. Assumes any Uab111ties with respect to the use of, or for damages resulting from the use of any information, apparatus, method, or process disclosed in this report.
As used in the above, "person acting on behalf of the Commission" includes any em-ployee or contractor of the Commission, or emem-ployee of such contractor, to the extent that such employee or contractor of the Commission, or employee of such contractor prepares, disseminates, or provides access to, any Information pursuant to his employment or contract with the Commission, or his employment with such contractor.
This report has been reproduced directly from the best available copy.
CHEMISTRY
REDUCTION OF NIOBIUM PENTOXIDE BY CARBON
Ernest Roger Stevens H. A. Wilhelm
February, 1961
Ames Laboratory
ABSTRACT
I. INTRODUCTION
II •
.
EXPERIMENTAL
A. Materials
B. Preparation of the Charge
c.
ReductionD. Examination of the Metal Product
E. Analytical Methods
III. RESULTS
~~DDISCUSSIONS
IV. BIBLIOGRAPHY
Page
iv 1 6
6
8
9 12
14
16
REDUCTION OF NIOBIUM PENTOXIDE BY CARBON*
by
Ernest Roger Stevens and H. A. Wilhelm
ABSTRACT
The investigations of the reduction of niobium pentoxide
by carbon showed that niobium metal could be prepared by a
direct reduction. High temperatures in the region of 2000°C
but below the melting point of niobium and dynamic vacuum
of one micron or less were the principal experimental
condi-tions employed throughout the course of this study. The
reaction, which followed very closely the stoichiometry of
the equation
Nb2
o
5
~;c
---i 2Nb +;co,
began at a temperature near 1200°C and was nearly completed
at 1600°C. The data indicated that it might be possible to
allow reduction to take place at approximately 1800°C. After
the reaction is completed at this temperature, raising of
the temperature of the reaction material to nearly 2000°C
might eliminate residual oxygen as a result of volatilization
of a lower oxide of niobium.
*This report is based on an M.S. thesis by Ernest Roger Stevens, submitted February, 1961, to Iowa State University, Ames, Iowa. This work was done under contract with the Atomic Energy
If, then a larger scale preparation could be derived
from this work, such a process would eliminate various
inter-mediate steps in the usual industrial production of niobium
metal. A simple direct reduction below the melting point
of niobium and subsequent arc melting of the metal to give
a massive, good quality product might prove to be an
I. INTRODUCTION
A demand for greater efficiency in the production of
power has created considerable interest in the development of
materials with superior properties at elevated temperatures.
The thermodynamic efficiency of a heat engine is a function
only of the two temperature levels involved and is directly
related to the difference between the higher and the lower
operating temperatures. Since there is little to be gained
by lowering this lower temperature, increasing the efficiency
is essentially dependent on raising the higher operating
temperature. Present materials are being used at their upper
temperature limits and, therefore, they are inadequate for
use at the proposed operating temperatures. As a result, a
number of the less common refractory metals, their compounds
and their alloys, are being investigated in an effort to
develop satisfactory materials for use at higher temperatures.
A study on a method for the preparation of niobium, which is
one of these refractory metals, is the subject of this report.
Niobium metal has much to offer for possible
applica-tions in the field of high temperature technology. Niobium
melts at 2468°C (1) and has good strength at high
tempera-tures. Although it has poor resistance to oxidation above a
few hundred degrees Centigrade, progress is being made to
overcome this unsatisfactory property. Niobium can be
that it can also be protected by developing a more resistant
surface. Considerable effort is being expended in the
development of alloys of niobium to improve the corrosion
resistance of the metal. The mechanical properties of
niobium are affected by very srnall additions of interstitial
impurities such as carbon, oxygen, hydrogen and nitrogen, and
for this reason hot working of the metal in air is generally
avoided. Since niobium can be easily cold worked, fabrication
is usually carried at or near room temperature. Niobium has
a thermal neutron capture cross-section of 1.1 barns which,
in combination with its high temper~ture strength, favors its
use in components of some reactors for nuclear power. The
combination of high temperature strength and medium density
mru~es the metal potentially useful as a structural material
in the aircraft industry. The increasing demand for niobium
metal has led to the renewed interest in the development of
the methods for its preparation. The specific purpose of
this work was to investigate the preparation of niobium by
the direct reduction of the pentoxide by carbon.
The relatively high cost of good quality niobium has
been a factor in limiting its use. The cost has been due,
in part, to a number of processing steps in the usual
commercial production of the metal by the carbide reduction
of niobium pentoxide. At present, niobium is produced in
Balke (2). This method is based on the fact that when a
mixture of niobium pentoxide and niobium carbide is heated
in a vacuum, carbon monoxide is evolved and niobium metal is
produced. The carbide is first made by heating high purity
niobium pentoxide with carbon in an inert atmosphere. After
analyzing the carbide for its carbon content, it is mixed
with the pentoxide in proportion corresponding to
Nb20 5 + 5NbC --~) 7Nb + 5CO (1)
and the mixture is compacted under a pressure of 50 tons per
square inch. These co~pacts are supported within a graphite
resistor tube of a vacuum furnace and heated above 1600°C
vrhere the reaction proceeds. The vacuum is employed to
re-move the carbon monoxide gas and thus promote the reaction.
As a result of this \heating, the compacts become metallic and
porous. They are removed from the furnace and converted
into powder by a ball mill. The powder is pressed into bars
which are then heated in a vacuum by their resistance to an
electrical current. This heating, which generally reaches a
higher temperature, reduces the gas content to a low value.
The bars, which now are sintered metal and still porous, are
compacted by working with a heavy hrur@er. The wrought metal
is heated again in a vacuum by self resistance. During this
last heating, the pores seal and the resulting solid metal
bars are then ready for fabrication into desired shapes.
described by von Bolton (3) and by Moissan (4). In 190% von
Bolton reported that he prepared ductile niobium. Niobium
pentoxide was mixed with paraffin wax and extruded into a
wire of
0.5
mm. diameter. The wire was bent into a U-shapedfilament and heated to a white heat while immersed in carbon
powder. From this, von Bolton claimed the preparation of
brown niobium tetroxide. The tetroxide was placed into a
vacuum and a direct current was passed through the brown
filament until the filament reached a white heat. Von Bolton
expected that niobium would be produced by electrolysis, but
after an hour of heating, no metal resulted from this
treat-ment except for a small amount at the positive pole. HovTever,
when alternating current instead of direct current was used,
a quarter of an hour of heating at a white heat transformed
the whole filament into niobium metal. Von Bolton claimed
that elemental oxygen was evolved during this heating. With
this method of producing niobium metal, only small quantities
could be obtained.
Moissan
(4)
described his work of the reduction ofniobium pentoxide by carbon. Oxide and sugar charcoal were
pressed together in the presence of "essence of terebine" and
heated on a bed of carbon in an electric furnace. The
metal-lic appearing product contained about
2.3
to3.4
per centcarbono Undoubtedly, some oxide remained unreducedo
exaQination of the reduction of niobium pentoxide by carbon
in a vacuum. A mixture of oxide (52.9 gm.) and carbon (9.6
gm.) was briquetted and heated for 36 hours at 1300°C in a
partial vacuum containing some hydrogen. The pressure at the
end of the heating was 20 microns. The product, containing
about 9.9 per cent carbon, was crushed and mixed with
sufficient oxide to remove the carbon as carbon monoxide
when heated in a carbon resistor furnace. This heating was
carried out in a vacuum at 1920°C. The product of this
latter heating was crushed, briquetted and then heated in a
vacuum at 2400°C in a high frequency furnace. The fused
metal had a Rockwell B hardness of 80. Kroll and Schlechten
concluded that niobium could be prepared by this method;
however, this product, because of its hardness, evidently
II. EXPERJ}IENTAL
It was evident from earlier reports that to promote the
reaction between niobium pentoxide and carbon, high
tempera-tures and vacuum conditions would be required. The
experi-ments were designed to be carried out at temperatures of
1600°C and above and at pressures of a micron or less as
finishing conditions. To attain the relatively high
tempera-tures which were necessary for this reaction, high-frequency
induction heating was used. The vacuum pumping equipment
consisted of an oil-diffusion pump which was backed by a
mechanical pump. The metallic sponge which was obtained in
each experiment was subsequently arc melted in an inert
atmosphere to give a massive metal button. This arc-melted
metal product was examined for hardness and workability. To
test the workability characteristics, part of the arc-melted
product was cold rolled at room temperature.
A. Materials
High-purity niobium pentoxide and carbon black were used
in the course of this investigation. The oxide was obtained
from Fansteel Metallurgical Corporation and was described
as high-purity grade. According to the manufacturer, certain
metal oxide impurities in this material came within the
maximum limits shown in Table 1. A qualitative spectrographic
of aluminum, calcium, magnesium and silicon were also present.
The carbon employed was designated as 100 per cent compressed
Sha'.vinigan Black. The specifications from the producer show
that this carbon had an apparent density of 12.5 pounds per
cubic foot; its analysis is shown in Table 2.
Table 1. Maximum limits of oxide impurities in Fansteel niobium pentoxide expressed as percentages
Oxide of
Fe Ti Ta
zr
Niw
0.05 0.08 0.10 0.02
Table 2. Analysis of carbon expressed as percentages
Carbon Moisture Volatile Ash Ether extract
99-5+ 0.04 0.06
o.o4
0.03Results of some experiments at this laboratory indicated that
the total volatiles of this carbon were slightly higher than
reported in Table 2; however, the low value for the ash
[image:15.566.73.516.247.373.2]B. Preparation of the Charge
The experiments were conducted on a relatively small
scale employing one-tenth of a gram mole of niobium
pentoxide per charge. Weighed amounts of the oxide and
carbon were mixed dry in a beaker. At this point the charge
lacked homogeneity since there was a tendency for the loose
particles to separate. To develop a better degree of
homogeneity, the mixture vTas wetted with acetone and blended
into a pasty consistency. The acetone was removed in a 100°C
drying oven. The dried charge was mixed and pulverized for
about one hour in a ball mill which consisted of a glass jar
containing a few ceramic stones. After removing the ceramic
stones, the charge was wetted again with acetone to give a
paste which was then formed into shape by compacting into a
glass cylinder whose dimensions were about 2.5 em. inside
diameter and 8.5 em. high. Drying of the formed charge was
accomplished in a 100°C oven; during the drying period,the
charge shrank in size. The cylinder and its dry contents
were weighed and then placed into a tantal~ crucible whose
dimensions were 3.8 em. inside diameter and 10 em. in height
,.,ith a wall thickness of 10-15 mils. The crucible was left
open at the top. The glass cylinder was carefully removed
without destroying the shape of the dried charge. The empty
glass cylinder was weighed to determine the weight of the
placed into a graphite heater which was thermally insulated
by carbon powder contained in a Pyrex jar. This
charge-heater assembly is illustrated in the sketch of Figure 1
which represents the complete vacuum induction heating set-up.
It is to be observed in the figure that the heater
assembly was centrally positioned in a 4-inch diameter
upright quartz cylinder. In making the complete set-up,
the lower end of the cylinder was connected to a vacuum
system and the upper end of the cylinder was closed by a
metal plate provided with a sight glass through which the
contents of the reaction vessel could be observed. By means
of a mechanical pump and an oil-diffusion pump, the system
could be evac¥ated to a pressure of less than one micron.
Power for the induction heating was supplied by a
six-kilowatt Ajax-Northrup high-frequency mercury-arc converter.
A photograph of the apparatus as employed is shown as
Figure 2.
Co Reduction
The system was evacuated prior to heating. During this
evacuation, pressures in the one millimeter to one micron
range were measured by a NRC Type
501
thermocouple gauge andpressures of one micron or less were measured with a NRC Type
507
ionization gauge. Temperature and pressure values wereobserved at one-minute intervals during the heating of the
H20 COOLANT (OUT)
0 GRAPHITE CHIMNS
··:.
:~. :, :· ~
0 0
0
PYREX JAR ---:=:04+-~ ...
>-'::.·:.
0 :::\;:~:\~ 0
0 0 ' '
TYPE 501 THERMOCOUPLE
VACUUM GUAGE
SIGHT GLASS GASKET SEAL
H 0 COOLANT
2 (IN)
WATER COOLED STEEL HEAD GASKET SEAL TUBE
0 CARBON BLACK
0
THERMAL INSULATION_o---GRAPHITE HEATER a---INDUCTION COIL
0
·~--++--~To CRUCIBLE
0
CHARGE
__.--PERFORATED METAL STAND
WATER COOLED BASE
H20 COOLANT
(IN)
TO VACUUM, OIL DIFFUSION PUMP AND MECHANICAL PUMP
[image:18.569.101.452.138.605.2]determine the temperature of the reacting charge. For most of
the reduction period, the gas pressures developed were within
the range of the thermocouple vacuum gauge. Near completion
of a reaction, pressures dropped to the range of the
ioniza-tion gauge. When a nearly constant temperature was to be
maintained during the course of a reduction, control \-ras
effected by manually operating the on-off switch of the
high-frequency converter. During a reduction,the evolution of gas
from the charge caused the gas pressure in the system to rise,
often to values of 700-900 microns. When a reduction was
carried out at a particular temperature, that temperature was
maintained until the pressure of the system returned to a lmv
value which was in the range of one micron or less.
After a run was completed, the product was allowed to
cool to room temperature in the vacuum. The system was then
opened and the product, a sintered metal sponge, was removed
from the heater and weighed. For evaluating the product of
each experiment, the metal sponge was subsequently arc melted
in a helium atmosphere on a water-cooled copper plate. The
resulting metal button v1as remelted three times with inversion.
between meltings to complete the preparation of the arc-melted
sample.
D. Examination of the Metal Product
The metal button, which was about 20 mm. in diameter ~d
parallel planes perpendicular to a diameter to give sections
approximately 3 mmo in thickness. Employing a "C" Brale
indenter and a 60 kilogram load, Rockwell A hardness values
v1ere determined on one of these sections. Five indentations
were made on each specimen and the average value was recorded
for the hardness number.
Another section of the arc-melted button was used for
testing the workability of the metal. Cold rolling of the
section was accomplished with a laboratory hand-operated
2-high Stanat rolling mill having 2-3/~ inch diameter rolls.
Before each pass, the mill was adjusted to reduce the
thickness of the section by about five mils. In all tests
the metal section was reduced in thickness until the metal
either fractured or its thickness reached the practical
limit of the mill.
Standard metallographic techniques were used to examine
the microstructure of each arc-melted button. A section of
the metal button was mounted in bakelite. Preliminary
grinding on a belt-type specimen grinder was performed to
expose the metal and to provide a flat surface for subsequent
grinding and polishing. Fine grinding was carried out on a
series of four mechanically driven rotating disks on which
were mounted emery papers of grit sizes 2~0, 320, 500 and
600. Final polishing was generally accomplished on a lapping
an aqueous soap solution of Linde A. Some samples required a
finish polishing on a lapping wheel which was covered with a
silk velvet cloth charged with an aqueous soap solution of
Linde B.
The polished metal surface was first examined
micro-scopically and then etched with a fresh solution of the
following composition:
9
ml. cone. HN03
3
ml. cone. HCl1 ml.
48%
HFA photomicrograph of each etched sample was prepared by
employing a Bausch and Lomb Research metallograph and
conventional photographic procedures.
E. Analytical Methods
Analyses for oxygen, carbon and nitrogen were obtained
on each sample. An emission spectrometric technique was used to determine the oxygen content (6). A D-C carbon-arc
discharge in an argon atmosphere was employed to extract the
oxygen from the metal as carbon monoxide, to dissociate the
carbon monoxide into atomic oxygen and to excite the oxygen
0
triplet at
7772
A with sufficient sensitivity to make theoxygen determination possible. Conventional spectrographic
0
techniques utilizing the argon emission line
7891
A as aninternal standard were used throughout the calibrations and
A Leco Conductometric Carbon Determinator was used in the
analysis for carbon. In brief, a weighed amount of niobium
metal was heated in a stream of oxygen to convert the carbon
to carbon dioxide which was collected and absorbed in a very
dilute standard sol~tion of barium hydroxide. The conductivity
of this solution was measured and comparison made with the
original solution to give the weight of carbon dioxide
absorbedo
Nitrogen in niobium was determined by a modified
Kjeldahl method. Approximately one-gram samples of niobium
were dissolved in an acid mixture
(5
ml. 1:1 H2so4,
2 ml.48%
HF
and 1 ml. 30% H2o
2 ) and the solutions were partiallyevaporated to lower the acid content. Sodium hydroxide
solution was added to the solutions of the metal samples and
ammonia was then steam-distilled into a boric acid solution
containing methyl purple indicator. The boric acid-indicator
solution was then titrated with standard hydrochloric acid to
The reaction between niobium pentoxide and carbon at
high temperatures in a vacuum follows, very closely, the
stoichiometry of the equation
---~) 2Nb + 5CO (2)
A preliminary investigation showed that small deviations from
the stoichiometry of Equation 2 yielded niobium containing
sufficient carbon or oxygen to affect noticeably the hardness
and ductility of the arc-melted metal.
The composition for a series of charges was calculated
to give a series of niobium metal samples with varying carbon
contents in the metal product, assuming the validity of
Equation 2. These metal samples were then arc melted before
testing. It was assumed that the fast cooling that follows
arc melting would tend to amplify the hardness effect due to
the presence of oxygen or carbon. Consequently, all of the
samples \vere tested in the as-arc-melted condition. The
results obtained for the products after reaction and arc
melting in this preliminary investigation are found in
Table
3o
The first column of the table is the calculated weight
percentage of carbon in the product as based on the charge
composition and the reaction according to Equation 2. In
describing the workability of the metal samples, "rolled"
Nominal Maximum
w/o of temperature
Hard-carbon of ness Workability Anal;y:sis { rmm}
in metal reduction RA (cold) Oxygen Carbon
product
oc.
3.00 1970 57 No Roll 470 28,600
2.00 1916 49 No Roll 305 12,324
1.50 1915 51 No Roll 260 14,000
loOO 2030 47 No Roll 415 8,328 I-'
--l
Oo50 1860
44
Rolled; Edge Cracked 335 3,0200.25 2000 48 No Roll 72 5,620
o.oo
1890 40 Rolled; Minor Edge-Cracks 350 1,873-0.25 2000 39 Rolled Nicely 160 452
-0.50 1910 69 No Roll 4,200 183
-1.00 1950 74 No Roll 3,000 123
-2.00 1975 70 No Roll
;>>
5, 000 103 [image:25.564.52.667.128.497.2]the mill. "No roll" means that the tested metal sample
fractured after a few passes through the mill. Other
self-evident terms are used to further specify the quality of the
workability. The negative percentages shown in the table
indicate a carbon deficiency in the product with respect to
the stoichiometry. The metal products actually, in these
cases, contained a nominal amount of oxygen corresponding
to the carbon deficiency. It should be noted from Table
3
that the nominal percentages of carbon were in fair agreement
with the carbon analysis on the carbon rich side of
stoichiometry. However, a similar agreement did not exist
with respect to residual oxygen in the metal on the carbon
deficient side of stoichiometry.
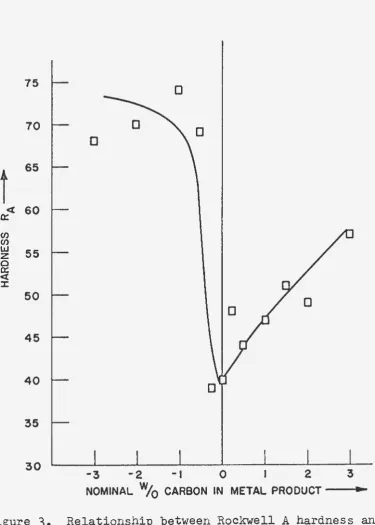
Figure 3~ prepared from the data of Table
3,
showsgraphically the relationship between Rockwell A hardness and
the nominal weight percentage of carbon for the arc-melted
samples. The results of this series of experiments indicated
that slight deviations from the stoichiometry would result in
metal of considerable hardness and poor workability. Good
quality niobium metal will have relatively low hardness and
good dutility and workability in the as-arc-melted condition.
It was evident from the results of this preliminary study that
carbon reduction of the oxide; however, the amounts of
carbon and oxide, which are to be mixed together for the
charge, appear to be very critical.
Photographs of microstructures of some representative
arc-melted samples from this series are shown in Figures
4
through 11 in order of decreasing nominal carbon percentage.
The structures in Figures
4
through7
were interpreted asshmving excess carbon as carbide; Nb2C. These microstructures
are in accord with the results of recent work on the
niobium-carbon system reported by Elliott (7) who prepared samples by
comelting of niobium and a 6 weight per cent carbon master
alloy. The phase diagram proposed by Elliott shows that
most of the niobium samples containing carbon within the
range of analysis referred to here would solidify by a
eutectic reaction between Nb2C and niobium metal solid
solution.
The solubility of carbon in solid niobium is 0.80 weight
per cent at the eutectic temperature of 2230°C and decreases
rapidly to about 0.10 weight per cent at 1800°C. The eutectic
composition is given by Elliott as
1.5
weight per cent carbonwhich corresponds closely in carbon content and in
micro-structure to the sample for Figure
4.
A charge which was prepared according to the
stoichio-metry of Equation 2 gave metal whose microstructure is
75
70
0
t
<t: 65 60 0:en en
w 55
z 0
a::
<t:
:E:
50
45
40
35
30
-3 -2 -I 0 I 2
[image:28.568.89.465.68.594.2]NOMINAL W/o CARBON IN METAL PRODUCT - - - t . . ..,
Figure
3.
Relationship between Rockwell A hardness andprecipitated within the grains of the niobium metal. The
srunple of Figure 8 contained about 0.05 weight per cent
carbon which gave rise to some carbide precipitation within
the grains of niobium. It should be noted that the
composi-tion of the metal product was not exactly vlhat was expected
from the stoichiometry of Equation 2; it was believed that
the deviation was due to factors connected with experimental
tecr~iques, conditions and/or materials.
The niobium-oxygen system established by Elliott
(8)
reveals that the first oxide formed is NbO which melts
congruently at 1945°C. There is a eutectic region between
niobium and NbO; ·this eutectic has a composition of 10.5
weight per cent oxygen and occurs at 1915°C. According to
the phase diagram, the solubility of oxygen in solid niobium
decreases from 0.72 weight per cent at the eutectic
tempera-ture to 0.25 weight per cent at 500°C. The microstructures
shown in Figures 9 through 11 are, then, what might be
expected of arc-melted samples of niobium containing small
amounts of oxygen. The microstructure of Figure 9 s.hov-1s
essentially one phase of solid solution. Figure 10 shows
the solid solution with precipitated NbO. Figure 11 shovTS
a dendritic pattern for the solid solution with eutectic.
It is to be noted in Table
3
that, during thispreliminary investigation, the reductions were not completed
recorded in the table,were of the order of a few microns but
not all of the same value. In view of possible variations in
the product due to these differences in finishing temperatures
and pressures, it was decided to treat a similar series of
charges uniformly. To meet the desired condition of uniform
maximum temperature and uniform pressure, these charges were
heated simultaneously in a vacuum induction system similar
to but much larger than that employed for the individual
charges described above.
This larger system accommodated a 16-inch diameter
induction coil which heated a 9-inch diameter graphite
crucible in which several small charges could be treated
simultru1eously. The results of a series of charges reduced
at a maximum temperature of 2000°C in this unit are
presented in Table
4.
The workability of the arc-meltedproducts of this series of samples turned out to be very
poor. A plot of Rockwell A hardness values versus nominal
percentage of carbon in the metal for this new series gave a
curve similar to that illustrated in Figure
3
but displacedto higher hardness values.
This new curve shown as a solid line in Figure 12
represents the data for the samples reduced simultaneously;
this curve should be compared with the dotted curve based
on the data for Figure
3·
The carbon and oxygen analyses----
-
---Nominal w/o of
carbon Hardness Workability Analysis (ppm)
in metal RA (cold) Oxygen Carbon
product
--3
78
No Roll>
5,000
237
-2
79
No Roll>5,000
169
-1
77
No Roll>5,000
150
0
58
No Roll360
999
1\)-..J
1
57
No Roll110
9,150
2
57
No Roll85
16,700
[image:35.567.58.661.105.407.2]in fair agreement with those of the ~reliminary investigations
for corresponding charges. The differences in hardness might
then be caused by some other factor such as nitrogen
contami-nation. Later experiments showed that nitrogen in the final
metal was much greater for metal prepared in the large vacuum
induction system used for these simultaneous reductions than
for metal prepared by the smaller unit of Figure 2.
Another series of reductions was run simultaneously in
the large system which had the 16-inch diameter induction
coil. The charges for these reductions were prepared
according to the following charge composition:
Nb205 + (5 + Z)C
where Z represents the fraction of a mole deviation from the
stoichiometry represented by Equation 2. The results of this
series of reductions presented in Table
5
correspond closel~to those of the previous simultaneous reductions (see Table
4).
The reductions giving the data recorded in Table5
werecarried out at 2000°C and for a time which was necessary for
the pressure of the vacuum system to return to a low value.
The nitrogen content of each of these metal samples, as
suspected from earlier results, was found to be high.
It should be noted that for the samples prepared by the
simultaneous reductions at uniform temperatures (see Tables
4
and5),
the charges rich in carbon yielded metal products85 80 75
--
... ...'
70
-
0'
'\n
0 \
\
t
65 \
\
\< 60 \
a:: \ /
(J) \
/6
(J)
'
l.IJ'
/z 55 /
C)
\
a:: /
<
\
/X
0//
\
50 / 0
\ 0 /
\
p'
45
\
/\
9'
\ I
40
-0
35
30
~--~----~----~----~--~----~----~---3 -2 -1 0 2 3
NOMINAL Wjo CARBON IN METAL PRODUCT_....
Figure 12. Relationship between Rockwell A hardness and nominal weight percentage of carbon in arc-melted samples of simultaneous reductions. Dotted line based on data of individual
z
Hardness Workability Analysis {l2Pm}value RA (cold) Oxygen Carbon
-0.4
84
No Roll4,590
159
-0.3
80
No Roll3,450
173
-0.2
76
No Roll3,500
170
-0.1
68
No Roll2,825
93
0
59
Rolled; Edge Cracked570
251
+0.1
58
No Roll215
4,153
+0.2
58
Rolled; ConsiderableEdge Cracking
185
11,825
+0.3
57
No Roll250
18,500
+0.4
60
No Roll210
23,500
Nitrogen
3,064
2,055
2,850
4,099
5, 562
VJ0
6,910
6,598
[image:38.569.57.659.107.427.2]percentages, a relationship noted also from the data for the
individual reductions recorded in Table
3.
However, in thesesame series, the charges which were deficient in carbon
according to the stoichiometry of Equation 2 yielded metal
products containing approximately the same oxygen content.
It appears then that the volatility of the oxide is such that
under the conditions of these experiments the residual oxygen
content of the metal approaches some equilibrium valueo
A stoichiometric reduction generally resulted in metal
which was relatively low in both carbon and oxygen but of
these two residual impurities, the one in slight excess could
not be predetermined. This uncertainty might be associated
with a number of factors such as variation in composition of
starting materials, lack of uniformity in the mixed charge,
variations in the reaction behavior of the charge associated
with the development of different fracture patterns in the
compact during heating and lack of complete reproducibility
in the pressure and temperature patterns during heating to
and at the maximum temperature.
In an effort to determine the lowest finishing
tempera-ture at which the reduction of niobium pentoxide by carbon
in a stoichiometric charge would give good quality metal, an
experiment was conducted whereby separate charges were heated
to various maximum temperatures and finished at pressures of
this series of charges, a bulk mixture of this desired
composition was prepared and an appropriate amount was taken
for each individual reduction. The charges for this
investigation were heated by the. vacuum induction system
which was used for the preliminary investigation and is
shown in the photograph of Figure 2. The reductions in this
series of experiments were all run with about the same rate
of power input up to the pre-selected maximum temperatures
which were held for a period of time until the pressure of
the vacuum system returned to a value of less than one micron.
After this condition was maintained for some time, the
reaction was assumed to be essentially completed under the
conditions imposed and heating was discontinued.
Results of this experiment are found in Table 6. It
should be noted from the table that the reaction was nearly
completed at 1600°C. For reactions performed at maximum
temperatures of 1700°C and 1800°CJ the carbon in the metal
product was found to be very low; however, the oxygen content
was much higher than expected. Although the reduction which
was carried out at 1900°C gave a metal product which had
good workability, the oxygen content was also high but
considerably lower than the oxygen content of the products
prepared at 1700°C and 1800°C. Metal prepared at 2000°C
showed low oxygen which might have been expected but the
··
-
-
- - -
·
-
··
Maximum Final pressure
tempera- (mm. Hg)
Hard-ture o:f at ness Workability Analysis (ppm)
reduction maximum RA (cold) Oxygen Carbon Nitrogen
oc.
temperature2000 0.15 X 10⁻³ 48 Rolled; Edge Cracked 30 5,761 241
1900 0.16 x lo-3 57 Rolled 1,ooo 178 264
1800 0.26 X 10⁻³ 73 No Roll fV 6, 000 111 229
0.31 x lo-3 lAl
1700 68 No Roll 3,300 137 441 lAl
1600 o.5o x lo-3 55 Rolled; Edge Cracked 730 6,575 194
[image:41.568.58.677.147.388.2]on the basis of data at lower temperatures. This high carbon
in this higher temperature treatment product might have been
the result of carbon vaporization from the graphite heater
which contained the reaction charge. However, the volatility
of oxide from the charge at this temperature might be such
that sufficient oxygen escaped without reacting to leave a
high residual carbon content.
A duplicate series of charges was run in an attempt to
determine the reproducibility of the data in Table
6.
Theresults of this re-run are found in Table
7.
Aside from thefact that corresponding s~aples in Tables 6 and
7
showconsiderable disagreement in the analytical data, similar
trends can be noted in both series. High carbon with high
oxygen characterires the samples run at 1600°C; the lowest
carbon content in both series is obtained with the 1800°C
treatment while the lower residual oxygen is found in samples
given the higher temperature treatments.
The relationships between the carbon content and the
oxygen content and the temperature of treatment for the
samples of Table
7
are shown graphically in Figure13.
Theincrease in carbon content above 1800°C is clearly shovm
here accompanied by a general lowering of residual oxygen;
while below 1800°C, both carbon and oxYgen are high. The
graph in Figure
13
shows also the relationship between theMaximum Final pressure
tempera- (mm. Hg)
Hard-ture of at ness Workability Anal;:tsis 'm~m} (cold)
reduction maximum RA Oxygen Carbon Nitrogen
oc.
temperature2000 o.l4 x lo-3 53 Rolled; Edge Cracked 195 775 93
1900 0.20 X 10⁻³ 52 Rolled; Edge Cracked 185 614 432
1800 0.20 X 10⁻³ 55 Rolled Nicely 680 289 222
1700 o.4o x lo-3 68 No Roll 2,520 1,157 425
1600 0.70 X 10⁻³ 73 No Roll 2,095 2,013 136
w
X
:!:
a.. a..
2
-o-
OXYGEN --0·- CARBON16 17 18 19 20
[image:44.566.75.488.196.609.2]TEMPERATURE °C X Jo-2
and oxygen contents.
Since the data of Table
7
did not duplicate those ofTable 6 but did shovr a similar over-all trend, it was evident
that the final compositions of the metal samples did not
appear to represent true equilibrium conditions for the
chemical reaction in all of the reductions. It was suggested
then that the preparation of good quality niobium by a direct
carbon reduction of the pentoxide might be influenced by a
number of factors which '\vere not critic ally evaluated in
these investigations. Further consideration of such
influ-encing factors could possibly lead to future work in
connection with this problem. A critical examination of
the reactants and products associated with this reaction at
high temperatures might lead to a better understanding of
the conditions prevailing at or near the finishing
tempera-ture. The oxide and carbide activities in the system at the
temperatures referred to here are important factors in
determining the course of the reaction. These activities
could be influenced by solid solution formation, by
vaporization and by the degree of reaction under temperature
and pressure variables. The effects of the volatility of
carbon from the graphite heater to the charge and of oxide
from the charge on the carbon and oxygen contents of the
metal products were discussed earlier.
to be noted from the phase diagrams of the niobium-carbon
(7)
and the niobium-oxygen(8)
systems that both carbon, asNb2
c,
and oxygen, as NbO, shovr some solid solubility inniobium metal at temperatures around 2000°C. The completion
of the reaction, then, at this temperature will require
reaction between components that are continuously decreasing
in their activities. The lovier solid solubility of the
carbide at a temperature of 1800°C would allow the carbon
to retain a constant activity to a greater degree of
completion of the reaction.
These investigations of the reduction of niobium
pentoxide by carbon showed that niobium metal could be
prepared by a direct reduction. High temperatures in the
region of 2000°C but below the melting point of niobium and
dynamic vacuum of one micron or less were the principal
experimental conditions employed throughout the course of
this study. The reaction, which followed very closely
the stoichiometry of Equation 2, began at a temperature near
1200°C and was nearly completed at 1600°C. The data
indi-cated that it might be possible to allow reduction to take
place at approximately 1800°C. After the reaction is
com-pleted at this temperature, raising of the temperature of the
oxygen as a result of volatilization of a lower oxide of
niobium.
If, then, a larger scale preparation could be derived
from this work, such a process would eliminate various
intermediate steps in the usual industrial production of
niobium metal. A simple direct reduction below the melting
point of niobium and subsequent arc melting of the metal to
give a massive, good quality product might prove to be an
IV. BIBLIOGRAPHY
1. Schofield, T. H., l.!_ Inst. Hetals
.§.2,
372 ( 19 57).2. Balke,
c.
w.,
Trans. Electrochem. ~§2,
89 (1944).3. von Bolton,
w., z.
Elektrochem. ~' 145 (1907).4. Moissan, H., Compt. rend. acad. sci.
133,
20 (1901).(Original available but not translated; cited in Niller, G. L., Hetallurgy of the Rarer Ivletals-6,
Tantalum and Niobium. p. 183. New York, New York,
Academic Press, Inc. 1959).
5. Kroll,
w.
J. and Schlechten, A.w.,
J. Electrochem. Soc •.2.3'
247 ( l948) •6. Evens, F. M., Emission Spectrometric Determination of
Oxygen in Niobium Metal. Unpublished M. S. Thesis.
Ames, Iowa, Library, Iowa State University of Science
and Technology. (1959).
7. Elliott, R. P., Columbium-Carbon System. ~~Metals
Preprint No.