11-1958
Pulse column design
Lawrence E. Burkhart
Iowa State College
R. W. Fahien
Iowa State CollegeFollow this and additional works at:
http://lib.dr.iastate.edu/ameslab_iscreports
Part of the
Chemistry Commons, and the
Engineering Commons
This Report is brought to you for free and open access by the Ames Laboratory at Iowa State University Digital Repository. It has been accepted for inclusion in Ames Laboratory ISC Technical Reports by an authorized administrator of Iowa State University Digital Repository. For more information, please [email protected].
Recommended Citation
Disciplines
Chemistry | Engineering
I
sc.
!+L.
rsc.-JO'!S
PULSE
COLUMN DESIGN
By
Lawrence E. Burkhart R.W. Fahien
November 1958
Ames Laboratory Iowa State College Ames, Iowa
UNITED STATES ATOMIC ENERGY COMMISSION Technical Information Service
of any Information, apparatus, method, or process disclosed In this report may not infringe privately owned rights; or
B. Assumes any liabilities with respect to the use of, or for damages resulting from the use of any Information, apparatus, method, or process disclosed in this report.
As used In the above, "person acting on behalf of the Commission" Includes any em-ployee or contractor of the Commission, or employee of such contractor, to the extent that such employee or contractor of the Commission, or employee of such contractor prepares, disseminates, or provides access to, any Information pursuant to his employment or contract with the Commission, or his employment with such contractor.
This report has been reproduced directly from the best available copy.
Printed in USA. Price $2. 75. Available from the Office of Technical Services, Department of Commerce, Washington 25, D. C.
AEC Techmcal Information Servace Extension
..
•
TABLE OF CONrENTS
ABSTRACT • • •
.
.
.
. . . .
.
.
. . . .
. .
INrRODUCI'ION • •
. . . .
.
.
. .
.
LITERATURE REVlEtl
.
.
. .
.
.
. . .
.
.
.
. .
SCOPE OF THE INVESTIGATION •
.
?ROPOSED THEORY
.
.
.
.
.
. .
Mixer-Settler Region
Basis of theory • •
End sections • • •
Recycle • • • •
Stage efficiencies
.
.
.
.
. .
.
.
.
The Emulsion Region • •
.
.
• •.
. .
.
.
. .
EQUIPMENl' AND EXPERIMEl-n'AL TECHNIQUES
. .
.
.
. .
. .
. .
EXPER.1MEN1' AL RESUI.!rS
.
.
.
. . .
.
Hold-up Studies
.
.
.
.
.
.
.
.
The
iso~lalcohol-water system •
The methyl isobutyl ketone-water system
Discussion of Hold-up Data
Extraction Studies • • • • • • • •
Discussion of Extraction studies • •
Sampling techniques • • • • •
stage efficiencies and recycle
.
. .
.
.
.
. .
.
. . .
.
. .
. .
.
CO~CLUSIONS
AND
RECOMMENDATIONS
NOMENCLATURE • • •
.
.
. . . .
.
.
LITERATURE CITED • •
. .
.
.
.
.
.
.
APPENDIX • • • • • •
. .
.
. . . .
A theoretical analysis of the pulse column was made using a stag
e-wise approach to the problem. The column was assumed to be divided into
discrete stages, each stage having been defined as that part of the column
between two adjacent perforated plates. · The cyclic reversal of flm-r which
is characteristic of the pulse column permitted more material balance
equations to be written than for a simple countercurrent extractor.
The operation of the pulse column was described mathematically using
material balance equations and, from the theory developed, a design method
was derived which used two "stage" lines and two "operating" lines, one
set for the upstroke and one set for the downstroke of the pulse generator.
The stages could be stepped off between ~ach of these sets of lines in
much tne same manner as is done on a McCabe-Thiele diagram. Assuming
equilibrium contact, the effect of recycle in a pulse column was shown to
cause a large decrease in the separation obtained as the pulse frequency
was increased. To account for non-equilibrium contact,two stage
efficien-cies were defined; one for the upstroke and one for the downstroke
half-cycle.
Hold-up studie~ were made using two systems, isoamyl alcohol - water
and methyl isobutyl ketone - water. Under proper operating conditions the
hold-up, per cycle, of the dispersed phase for both systems was shown to be
*
This report is based on a Ph. D. thesis by ~awrence E. Burkhart submittedNovember 1958, to Iowa State College, Ames, Iowa. Thi8 work was done under
contract with the U. S. Atomic Energy Commission •
equal to the interstage flow, per cycle, of the dispersed phase. Also for
both systems the stagevdse hol~up per cycle first decreased then increased
as the pulse frequency was increased. This hold-up behavior had been
pre-dieted qualitatively by the theory. With the uater phase discontinuous, a sharp increase in the dispersed phase hold-up was observed at critical
pulse frequencies for the isoan~l alcohol - water system. The critical
frequency was a function of the superficial flow rate of the dispersed
phase. This break in the hold-up curve was attributed to a hindered
set-tling effect due primarily to the high viscosity of the continuous isoamyl
alcohol phase. Hold.-up behavior at high frequencies was quite different
for the two systems.
Extraction runs were made using the system methyl isobutyl ketone
-acetic acid - water. It was shown both theoretically and experimenta~
that even though the stage efficiencies may increase, the over-all
sepa-ration performed by the column may decrease with increased pulse frequency
because of the effect of recycle. The stage efficiencies were lm-rer for
that half-cycle in which the wetting fluid passed through the plates. The
over-all operating line shifted closer to the equilibrium line as the pulse
frequency was increased, and this was explained by the theory to be due to
the unequal effect of recycle on the end-sections of the column as compared
with the recycle effect in the stages.
On the basis of the theory presented for a pulse column operating in
the emulsion region it was found to be theoretically possible for a column
to be operating in a pinched-in region even though this is not apparent by
an examination of the superficial flow rate ratio of the two streams being
fed to the column. The change in the phase con~osition would chanee the
plates. Removal of the sample from the column during the desired part
of the pulse cycle was controlled by microswitches located on the pulse
generator. The microswitches operated specially constructed solenoid
INI'RDDUCI'ION
The pulse column, as we know it now, developed from an extractor
patented by Van Dijck
(19)
in 193.5. Van Dijck's patent concerned acolumn in which perforated plates were oscillated up and down to
dis-perse the two liquid phases. Also mentioned in this patent was the possibility of dispersing the phases by pulsing the liquid instead of moving the plates. This latter method of agitation is the basis of what
has come
to be called a "pulse column".
Serious interest in the pulse column probab~ started in about
1949
when
c.
Groot used it at Hanford for the processing of uranium(1.5).
Atthat time it was used because it offered approximately a two-fold reduc-tion in height from the heights of convenreduc-tional packed colwnns to obtain a given uranium separation. This reduction in height was, and still is. very important when problems of shielding and criticality for reactor fuel
processing equipment are considered.
A functional diagram of the pulse colwnn is shown in Figure 1.
Per-forated plates are spaced at intervals up the column. Heavy liquid enters from the top of the column and light liquid enters from the bottom of the column. Ordinarily the size of the holes in the perforated plates is
small
enough that no countercurrent flow occurs through the plates due to gravity alone. The pulse generator at the bottom serves to disperse ormix the two liquid phases and also to pump the liquids through the column.
PRINCIPAL INTERFACE
PERFORATED PLATES
LIGHT LIQUID DISPERSED
ON UPSTROKE
PULSE GENERATOR
the principal interface is located in the top end-section of the column.
If the heavy phase were the discontinuous phase then heavy phase would be
present in the smaller quantity and the principal interface would be in the
bottom end-section of the column.
Figure
2 shm-ts the operating characteristics of a pulse column. The
curve was presented by Sage and Woodfield (15) to illustrate the various
types of dispersion in a pulse column as a function of the flow rates
andthe pulse frequency. The curve only shows general trends and has no
numeri-cal values along its axes.
Choose an arbitrary total flow rate and follow a horizontal line across
the Figure. Region A is a flooding region in which the column w:i.ll not
operate because the amount of pulsation is too small to pump liquid through
the column as fast as it is fed at each end. At a point on the line marked
"Pulse Volume Velocity", the pulsation applied to the column is just enough
to maintain a net flow equal to the superficial flow rates, or the rates at
which the two liquids are being fed to the column. This point is called the
lower flooding limit or the point of incipient flooding due to insufficient
pulsation.
When the pulse frequency is increased so that the column operates
inarea B, mixer-settler operation is obtained. The two phases settle out
completely between pulses; thus there is an alternating sequence of mixing
and settling
ineach portion of the column between two adjacent perforated
plates. When a pulse column is operated
inRegion C, the two phases in
the colunm give the appearance of a homogeneous "emulsion" at all times
and so the area is called the "emulsion region". Increasing the pulse
en
w
en
r
i
~ :1: ::> ~ Q. 0
x m
C> lL
::> 0
0
0:: ~
:t: ::>
... (/)
C>
z
(/) t-=
lL
~
0
0::: (/)
0 :::::
z
0::
I
-
..._j
<{ C>
A
AMPLITUDE
=
CONSTANT
TYPICAL FLOODING CURVE
I
B
CYCLES
IHR
INCREASING
FREQUENCY--E
[image:12.547.15.525.28.695.2]non-unifonn. Large globules of liquid begin to appear and local flooding,
or reversal of the dispersion, may occur. This unstable region is indicated
by area D in Figure 2. The transitions between regions B and C, and regions
C and D are not well defined.
The flooding curve which separates regions D and E represents the
locus of points at which the net flow of liquids through the colunm is
again just equal to the superficial flow rates. This time the trouble is
not too little pulsation but too much pulsation.
reduced the net flow of liquid through the column.
Hindered settling has
A point on this line
is often referred to as the upper flooding point or the point of incipient
flooding due to excessive pulsation.
The pulse column has two flooding points. Both points are s:b~rply
defined and the permissible operating range of the column is sandwiched
between these two flooding points. The extraction efficiency varies
throughout this range and the resulting degree of separation obtained
depends on the net effect of two opposing phenomena. Idea~. increasing
the pulsation applied to the extractor produces better dispersion of the
phases and creates more interfacial area for mass transfer. Turbulence
within the column is increased, tendine to improve the rate of extraction.
On the other hand, back mixing, or recycle, is present throughout the
operating range of the column, decreasing as the pulsation rate decreases,
and reaching zero at the lower flooding limit. This recycle can be seen
intuitively by noting that, at steady-state, the net flow of liquids
through the extractor must be equal to the superficial flow rates. But
the amount of liquid moved up and dovm the column by the pulse generator
LITERATURE REVIEW
Because of the
high
extraction efficiencies which have been obtained with pulse columns, they have been the subject of considerable research inrecent years. Goundry and Romero (
9),
in a senior research project at Cornell used a 11-in. diameter column packed with ~-in. Raschig rings to observe the effect o~ pulsing a packed column. Pulsing the column resulted in a three- fold decrease in the over-all H. T. U. Some time later, \-Jiegandt and Von Berg (20) published the results of further work on the same column and the same system, methyl isobutyl ketone-acetic acid-water, reporting a change of 7.8 in. to 1.6 in. for the H.E.T.S. between the non-pulsed colwnn and the column pulsed at an amplitude ofi
in. and a frequency of 74 'Cycles/ min. This was about a five-fold change.flow rates. The plates were removed and the column operated as a spr~ column. The sol vent to water ratio was l.
57
and the H. T. U. varied from 1.1 in. to 24 in. between the pulse and the spray column at low total flow rates. At high total flow rates the change was from 34 in. to57
in. A change from 2 in. to 1 in. in the plate spacing resulted in an increase in the efficiency of the pulse column. The pulse column flooded easier than the spray column, ho\-rever, the difference being955
gal./hr./sq.rt. as compared with 1820 gal./hr./sq.rt. for a 2-in. diameter column. These authors first commented on the reasons, mentioned earlier, for the appear-ance of the two flooding points which are characteristic of the pulse column.Belaga and Bigelow (2) also using the column at Oak Ridge, studied the effects of pulse amplitude and pulse frequency on extraction efficien-cy. The over-all H.T.U. was plotted against the amplitude-frequency
product in an attempt to obtain a correlation. The authors indicated that this correlation was dependent on the system employed. Amplitude was varied from 1/8 in. to 2 in. and frequency was varied from 20 to 80 cycles per minute. The H.T .U. change was from 2.63 to
6.25
in. for the system, methyl isobutyl ketone-acetic acid-water.At Iowa State College, Cohen and Beyer ( 5) investigated flow rates
Later, Edwards and Beyer ( 6) put the phenomenon of recycle on a
mathe-matical basis in an equation designed primarily to predict the lower
flooding point of the pulse column for any liquid system.
In 19.54, Sege and Woodfield (15) published a compilation of work
done at Hanford where the pulse column was first introduced for production
work. Most of the pulse column variables were discussed and the general
trends of their effects indicated. The discussion was illustrated with
data on the solvent extraction of uranyl nitrate with tributyl phosphate.
A relation am, where a is the amplitude, f is the frequency and n is an
exponent dependent upon the system was suggested as a better correlating
factor than the simple amplitude-frequency product.
The work described so far has dealt mainly with over-all trends in
pulse column operation. Probably the most significant study which has
yet been reported is the work of Li and Newton (12). The work was
pub-lished in 1957 although it was submitted by Li as a doctoral dissertation
at Georgia Tech in 1951. Li used the system toluene-benzoic aci~water
in a 2-in. pulse column. The approach used was the classical attack on
liquid-liquid extraction based on Colburn' s H. T. U. method of correlation
(17), a procedure which has been used by several other authors (1, 14, 18)
to correlate their data on liquid-liquid extraction in perforated plate
columns.
Considering the pulse column essentially as a perforated plate
column with a superimposed pulse, Li used a Reynolds'number based on
the pL~te perforations, taking the arithmetic average of the velocity
through the plates and the physical properties of a two-phase mixture of
With the toluene phase dispersed, the over-all mass transfer
co-efficient,~~· was found to increase with increasing Reynolds' number
and to exhibit a sharp break at a critical Reynolds; number (Re)c~ 1200.
The slope of the curve was 0.175 below (Re)c and 1.07 above (Re)c,
show-ing a much faster increase of
Kwa
with Re above the critical point.Pressure drop across the column also increased sharp~ at the critical
I
Reynolds number of 1200.
Runs were made at constant values of the Reynolds' number to
deter-mine the effect of flow rates. vlith either phase dispersed, the over-all
mass transfer coefficient was affected main~ by the flow rate of the
dispersed phase and only slightly by the flow rate of the continuous
phase.
The hold-up increased with increasing flow rate of the
discon-tinuous phase and was independent of the flow rate of the condiscon-tinuous
phase. Hi th constant flow rates, hold.-up increased exponent ia~ with
an increase in the Reynolds number.
At the British Atomic Energy H.esearch Establishment in Harwell,
England, the pulse column has been under stuqy for several years as
part of a larger program of research in liquid.-liquid extraction. A
comprehensive paper on the pulse column work at Harv.rell was published by
Thornton (16) in 1958. A method of design, based on model tests, was
presented which was reported to permit the various design parameters to
tests were made.
In
the absence of interfacial effects due to solute transfer, the
droplet size range was found to be small for any
gi~en set of operatingconditions. A statistical mean droplet size and its associated
charac-teristic mean velocity was used in the design equation for flooding and
for H.T.U. The effect of solute transfer on interfacial effects was
added as an "enhancement factor" •
A program to determine individual
filmH. T. U. 's and to study flooding
in the pulse column literature. Consequently the project was planned with
the object of obtaining infomation which could be used for design. An
orderly approach to how the pulse column operates was the first objective.
To achieve this end the operation of the pulse colurnn was described in
terms of equations. The simplest possible cases were considered first
and additional refinements were added as the theory was developed.
Among column-type extractors the cyclic reversal of flow
character-istic of the pulse column is unique. This feature of the pulse column
increases the number of material balance equations which can be written~
and much of the theory developed so far is an extensive use of the
material bala.nce. The pulse column cannot be truly represented as either
a differential or a stagewise type of extractor. Nor is it truly
counter-current or cocounter-current, since the presence of recycled liquid imposes a
co-current stream upon the intended counterco-current
now.
It will be shownlater that this cocurrent stream does in fact become larger than the
countercurrent stream under conditions of high pulsation.
Most previous investigators have used a differential approach to the
pulse column, employing the H. T • U. Ho1..rever, in the present work a
PROPOSED THEORY
Mixer-Settler Region
Basis of theory
Assume that a pulse column is divided into discrete stages,
a stage
being defined as that part of the column between two adjacent perforated
plates. Consider that only equilibrium contacts are obtained and that
the column
is
operating at the point of incipient flooding due to
insuf-ficient pulsation. At this point of incipient flooding, mixer-settler
type operation occurs. The two phases settle out completely
andthere
is no recycle, or back-mixing between stages.
The following assumptions hold for this analysis:
(1) equilibrium contact
(2) mixer-settler type operation
(J)
zero recycle
(4)
(5)
(6)
(7)
no volume changes
straight equilibrium line
constant and eCIU3rl hold-up in all stages
an element of fluid passes through only one stage per
half-cycle of the pulse generator.
The following nomenclature will be used:
E
=organic phase hold-up per stage (liters)
R
=
aqueous phase hold-up per stage (liters)
G
=
organic
phase
interstage flow rate (liters/cycle)
L
=
aqueous
phase
interstage flow rate (liters/cycle)
trations which are not primed refer to conditions at the end of a do~
stroke but before the beginning of an upstroke.
A hypothetical extraction problem will serve as a numerical illus-tration of the design of a pulse column, subject to the assumptions
listed above. The end sections of the column have not been considered. Aqueous phase containing 100 gm./liter of solute is to be reduced to a concentration of
34
gm./liter by solvent extraction in a 3-in. dia. pulse colunm. The entering solvent contains 0.5 grams of solute per liter. The colunm has a 3-in. plate spacing and is to be operated at the lower flooding point, with at-in.
pulse amplitude. The flow rates to the colwnn will be 0.8 liter/min. for each phase. Assume that the organic to aqueous phase hold-up ratio is 1/3 for each stage. The equation of the equilibrium line for the system is y=
0. 75x. How many stages are necessar,y to perform the separation?A diagram of the extractor is shown in Figure 3. By an over-all material balance, YN is found to be 66.5 g;n./llter. The total volume of each stage is 0.)48 liter. Since the organic to aqueous phase hold-up ratio is 1/3. the volume of organic phase, E, in each stage is 0.116 liter and the volume of aqueous phase, R, in each stage is 0.232 liter.
X'= 100 gm
I
liter
F
N
N -I
1
-2
1---
---
-YJ 66.5 gml liter
xt
a:34
gm
I
I iter
y
8=0
.
5 gmlliter
a
=
pulse amplitude (em.)f
=
pulse frequency (cycles/min.)A
=
cross-sectional area of column (em?)Gs
=
superficial now rate of organic phase (em) /min.)Ls = superficial now rate of aqueous phase
(em)
/min.) ..This equation assumes that the raffinate leaves the column only during an
upstroke of the pulse generator. By trial and error calculations the
pulse frequency is found to be 20.2 cycles/min. The interstage now
rates for each phase are.
0.8
=
0.0396 liters20.2 cycle
Begin at the bottom of the column. On the upstroke of the pulse
generator, organic phase flows into the bottom of stage one. Consider
that the upstroke takes place in two steps as shown in Figure 4a. First,
G liters of organic phase of concentration YB mix with R liters of aqueous
phase of concentration x1 • according to the equation:
_,
/qy-B
+
Rx1=
Gyl+
Rx1 'The concentration
Y{
is a transient concentration within the column atthe end of the first step of this two-step process. Since equilibrium
contact is assumed, the point
(yl•
xi)
lies on the equilibrium line.Second, the G liters of organic phase of concentration
y{
mix with thePLATE
-,
y,
@ @
R
0
R
R
(f)
~ f/)x,
QJx'
®
x'
I I
PLATE
- - -
-r-
---
---Gyo
R
x'
IR
_--__...__"-ATE
(E-G) liters of organic phase of concentration Yl remaining at the top of stage one to give E liters of organic phase of concentration y{ or:
_ / ( ) I
0Y1
+ E-G Yl=
Eyl ,The downstroke may also be assumed to occur in two steps as shOlm in Figure 4b. The equations are:
LX1
+
(R-L)xl = Rx1 •Equation 1 may be rearranged to give:
which is the equation of a straight line through the points (yB,
x
1 )(- ' ') R
6
and y1 , x1 . The slope is
1f
=-5.8 .
This line, drawn through the point(y{,
xi_)
on Figure5
intersects the line y=
yB at the point {yB,x
1 ). From Figure5,
x
1=
)8.4 gm./liter. Sincex{
andx
1 areknown,
x
1 can be calculated from Equation 4:The value of y1 may be read from Figure
5
since (yl, xl) lies on theI
_,
equilibrium line. Hence y1 = 44.8 grn. liter. With Yl and Yl known,
I
y1 can be determined from Equation 2:
y{
=
~ y~
+ ( 1 -~)
y1=
)8.2 grn. /liter •Equation ) may be rearranged to give:
(2)
(J)
{4)
(5)
(6)
[image:27.546.13.524.24.681.2].._ .! ... E "' IU If) <[ it (.)
z
<[ C)5
~ ~ 1-- <[ 1!5 z (.)""
z 0 (.)""
1-- :;) .J 0 II)80
-
--
-+---+---~--~~---+---~----+---~----~---~
r---t---~
---~
--~
-
--
~----+---+--~---~----~--t--~
20 10~--~,~~-4---+---+
lo
20
30
40
50
60
70
eo
90
100
110
S
0
LUTE
CONCENTRATION
IN
AQUEOUS
PHASE
(gm('
liter
1
Figure
5.
Solution
to
problem
by
stage-to-stage
Yl
~
-
~
xl
+ [
~
x2
+
.v:i]
which is the equation of a straight line through the points (yl• x1}
and
(y{.
x2>·
The slope is -!!
=
-0.)41. The intersection of thisE
line with the line y =
y{
determines the point(y{.
xz}
and hence thevalue of
~
can be read from Figure3
as x2,=
79
gm. /liter.(8}
The procedure can novr be repeated starting with the point ("y~. ~} on the equilibrium line. This point is analogous to the point
(y{,
xi.}of the preceding calculation. The calculations are continued until the
desired separation has been reached. In this case, comparing Figures
1
and
3
it is seen that:Y2
=
YN=
71.8 gm./literxJ
=
xF
= 106.2 gm. /liter .Slight~ less than two stages are needed.
Notice, as shown in Figure
6,
that by drawing a straight linethrough each of the following series of points,
(1)
Xn•
Yn
(2)
~·
Y{..
(3) xn+l'
Yn
(4} I
Xh+l•
y~it is possible to step off the stages in much the same manner as is done
on a HcCabe-Thiele diagram. However, there are two sets of lines; one
set 1s for the upstroke of the pulse generator and one set is for the
~
•
-
... e 0 lol <I)"'
~ (,)i
~ 0 ~ ~ .... IX"'
.... z ~ z 0 (,) ~ :::> .J 0 Cl) 80 /~
(y2x2)p
~
~
/
1
//
/
~2 13)~-~
v
v--~,
.... ,
UPSTROKE STAGE~ ~/
/
DOWNSTROKE STAG ~/v
~
LINE/~
//
(y~/Y
/
v
/
/
v
/
( 11 xz)/
~
e
~ ,, •21/
l
/
/~
v·
<Vi •' t )v
~
u'mo<E Ofe<ATING LIN DOWNS T ROKE OPERATING U E / /v
v
lj/
/
I /I
/
~LISRIUM
J
'i
v
ILIN~
<Ya 1t l70 60 50 40 30 20 10 0
equilibrium line as in a McCabe-Thiele diagram, nor is the bottom line a
McCabe-Thiele operating line. For convenience, the lower line in each
set will be called an "operating line" since it serves the same purpose
on the diagram as a conventional operating line. On the other hand, the
upper lines cannot very well be called equilibrium lines. These upper
lines will be called "stage lines" since they represent the locus of
points corresponding to stage concentrations of aqueous and organic
phases at the end of each half-cycle of the pulse generator.
The diagram in Figure 6 shows clearly the stagewise nature of pulse
column operation. The dotted lines show the change in concentration in
each stage when the col~~ is operating at steady-state. The
concen-tration values oscillate back and forth between the points at each end
of these lines.
The problem may also be solved by use of an 11over-all stage line"
and an "over-all operating line11 • The first is a relation between Yn
ahd
X:.,.
The second is a relation betHeen Yn and x~ 1· The necessaryequations are derived from Equations 1 through 4, the two equilibrium
relations, and a material balance over one end of the column. A material
balance over the bottom of the column, including stage n as shown in
Figure
7
is:The resulting equations are:
over-all stage line.
(9)
L ' [ L ' ]
Lx'
ILa~+•
n
~-
1---2
End sections
A diagram of the top end-section is shown in Figure 8a. Aqueous
feed enters the top end section continuously. Notice that only that portion of the erd section where the two phases may come into contact is
of aqy importance from the standpoint of extraction. Consider a do~
stroke of the pulse generator, shown in Figure Sa. L/2 liters of aqueous
phase of concentration xA enter and L liters of aqueous phase of
concan-tration xF leave the section. The following equations may be written:
or:
Next consider an upstroke of the pulse generator, as shown in
Figure 8b. G liters of organic phase of concentration YN enter the top end section. Since aqueous phase enters the top end section
con-tinuously, ~ liters of aqueous phase of concentration xA. also enter on
the upstroke. G liters of organic phase of concentration YA leave during this period. Thus, at the end of the upstroke, the top end section
con-tains
Rr
liters of aqueous phase. Assuming that the two phases reachequilibrium on the upstroke, then:
Values of xA_, YA•
Rr·
G and L will probably be known for mostproblems. So YN and xF must be determined from the above equations.
[image:33.544.21.519.17.685.2]-
INTERFACE.._____.
Rr
_ _ Jx·F
t
Lx'
FFigure 8a. Top e:rrl-section; downstroke.
INTERFACE
be found since YA is known. Then:
=
[2(Rr-L)
J
~
2R.r-L
(11)and:
[image:35.549.33.528.24.680.2](12)
Figure
9a
shows the bottom end-section of a pulse column during anupstroke of the pulse generator. G/2 liters of organic phase of
concen-tration YB mix with
Ra
liters of aqueous phase of concentrationx
8accord-ing to the equations
Similarly, the following equations may be written for the bottom
end-section
during
a downstroke of the pulse generator:I ( G) I G
-Lxl
+
E13-2
YB+
~ Ys = LXB+
EaY'B- ( I
LxB
+
Ii3-L) xB = 11rB ',
Values for YB and x1 must be detennined from these equations. The point
(y~,
x:B) lies on the equilibrium line. A line through this point and thepoint (ys, xg) has a slope equal to -(2RB)/G. Thus the value of x8 may
be found since YS will probably be knolm from the conditions of the
problem. Then:
- RB RB I
XB
= -
XB+
(1 - - ) XBEa
Ye
,....-
Ra X a
---..
l
)
L Xe
G
2Ys
Figure
9a.
Bottom end-section; upstroke.L
x;
G
2
YsThe point (~, yB) lies on the equilibrium line, so yB can be detennined.
Next:
(14)
To illustrate a complete column design using this analysis,
con-sider the following problem.
A 3-in. diameter pulse column has ten stages, each 3-in. high. Organic solvent is available which has a concentration of one gram of solute per liter. The flow rates to the column are to be 1.08.5 liters/min. for the organic phase and 0.800 liters/min. for the aqueous phase. When the column operates at the lower flooding point with a t-in. pulse ampli-tude, the pulse frequency is 22.3 cycles/min. The organic phase hold-up in each stage may be taken as 0.0486 liters/stage. The equilibrium curve for the system is y
=
0.75x.
What must be the concentration of aqueous feed if the raffinate from the column is to have a solute concentration not greater than5
g;.n./liter7The solution of this problem is shown in Figure 10. The
concen-tration of aqueous feed, xJ., must be 98 f!JB./liter. The organic extract leaves the column at a concentration of
70
f!JB./liter.Recycle
\'/.hen a pulse column is operated above the lower fiooding point, the recycle rate is no longer zero. In effect, the presence of recycled liquid means that some of the fiuid which leaves a stage on one
i"
81i . <::---+
~
---
1----r---~----~---r-zvt~)
I/V77
I"-
§
701---..
so
""t>v
PL
:
~.
V:V
71/
IT 11l
~
.//VV
I /V?[/ :5::?
~
LV
/
1/V
I I I 1~
4oI
/l-'/'[/
I
~
1/
/
1
7
<?_/V
V 1 / I~
~
/ ,'[7[7 I I I1
w/~~v
1~
L /T/ 1 1 1 u/VIZ'/1
I I /_/ 7 I~
20 /7 71/1 I =>~~
[7[7~
g
/Y
/1/
I
I
I
I
l
10 L'LII7
1(XaY~l::
L'. LI
I~~~[//
~~Yw<·>
0
010 20 30 40 50 60 70 80 90 I SJLUTE CONCENTRATION IN AQUEOUS PHASE ( gm / liter) I
I
I
I
100during the time it is gone from the stage. vlhen it returns as recycle, this fluid causes a decrease in the over-all concentration gradient available for mass transfer. Hence the effect of recycle in a pulse column is opposite to that of reflux in a distillation column. The potential importm1ce of recycle with increasing pulsation can be seen
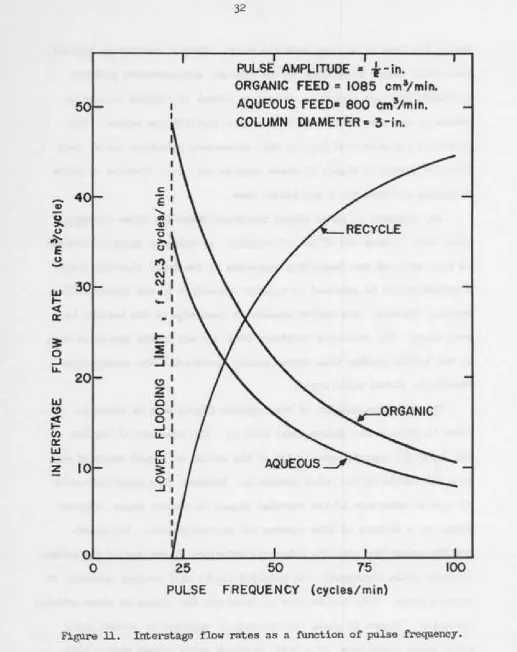
from the curves in Figure l l where recycle rate as a function of pulse frequency is shown for a particular case.
Any analysis of pulse column operation above the lmter flooding limit must include the effect of recycle. By using an approach similar to that employed for describing operation at the lower flooding limit, a mechanism can be proposed to explain extraction in the mixer-settler region. Hmtever, this method requires a knowledge of the hold-up in each stage. The following relations hold for any liquid system so long as the column follows true mixer-settler operation. The assumptions previously listed still apply.
The phase composition of the recycled liquid must be
known
inorder to predict the steady-state hold-up. The equation of Edwards and Beyer ( 6) permits calculation of the amount of liquid recycled on each half-cycle of the pulse generator. However, this equation cannot be used to determine if the recycled liquid is aqueous phase, organic phase, or a mixture of both aqueous and organic phases. For
-
Q)u
~ 0 ~ E 0-w
...
<( ll: ~ 0 ...J u... LLJ C)~
en ll: IJJ ~z
4
30
20
10
I I c le'
'-I
:.
0 ~ u,
.
t\1 N..
-
..
1
-~-
..J C)z
-
0 0 0 ..J LL. 0:: IJJ ~ 0 ...JCOLUMN DIAMETER
c3-in.
0~---~~---._---~---~
0
25
50
75
100
PULSE
FREQUENCY (cycles/min)
[image:40.546.12.529.36.688.2]o ... I I
0 0
0.7!5~ 0 0 0 0 0 0 0 0 0
0.70~ 0 0
0 0
-0.6~ 0 0
"'
II: 00
~o.eo
-::; 0 0
0.55 0 0
-~ 0 0 TOP END SECTION
::. 0.!501 ) 0 0 J
0
:z: 0.45
040~~~~~-~·~~~~~~-~·--!-·~·~~~-~·--L---L-_J • 0 2 3 4 !I 6 7 8 9 10 II 12 13
TIME (cycles)
0.20'r-~--.,---~.~.---~l~r-~--~.r--r-,~---r-,~----~
Vi 0.15
II:
s
0.10 0 0 0 0 0 0 0 0 0 0 0 0 0 0 STAGE 2CL
:::> 0 0
I 0.05
0
J 0 0
~ o.o~~--~~-~·--~·~·~~·~~---!-·~·~~~~~-o-~o
1 __o_~~o
__o~o_J
o 2 3 4 5 6 ., 8 9 ro 11 12 13
TIME (cycle')
;;; 0.20'y-,---r--r---.---r---r-..,....__;_:,;l :...::...:..,;...:..--.----r--r--....--r----,
0::
~ 0.15
:J
oooooo
~ 0.10 0 0
0
6 0.05
STAGE
0 0
:z: ooooooooooooo
o.o,!;-~---!----!---!L--~-~o-o-~~~--..,L-__,L...-L-...L____.l 0 2 3 4 5 6 8 9 10 II 12 13
oo
Tl ME {cy c •••·)
0.20r-~--.,--,.----.,r----r-,~,r-....;r-,--,--~-.... - -... --....-, ... _
"'
0:: ~ 0.15::.
Q. 0.10
:::>
0
<3 0.05
J:
:'IOTTOM END SECTION
[image:41.543.19.521.16.679.2]shown schematically in Figure 1). The hold-up of organic phase becomes
equal to the organic phase interstage flow per cycle.
The volumes of the two phases in the top end-section in Figure
13
will depend on the height of the principal interface. According to the
theory, then, if the position of the jack-leg which balances the pressure
drop across the column is changed, the corresponding adjustment of the
aqueous-to-organic phase ratio must appear only in the top end-section
atter the column reaches steady-state again. The aqueous-to-organic
phase ratio elsewhere in the column will only be temporarily affected
b.Y
varying the position of the jack-leg.
Refer to Figure 1). If the same assumptions are made as in the
previous analysis, then the following equations may be written:
(A) Top end-section
L I I ( ) I ( L)
z
xA+
Rtrx.r -
VR+
LJt.r
=
R_r-VR-2
JGr
downstroke (15)upstroke
(16)
(B) Bottom end-section
(v R
+
L) ,
xl+
2
G '
Y'B+
2
G
Ys=
(V
R+
L)-
xa+
Gy B(17)
L X~
T
G
YA
T
LYA
TOP
YA
Rr
END - SECTION
-Rt-VR-
j-Xy
XT
•
(VR+L)
X~
v.
G
Y'
GYN
R X'
HR
XN
(VR+L) XN'
G
y
N-It
'
~
RXN-1
G
.f
tvR
G
y'
G
y,
R
xf
R
x.
~
(VR+L)
X'
IG
Ya
VR
G/2
Y's
G
Ya
G
R
8+
yBOTTOM
RB
X
a
END- SECTION
X
a
~
8
2
'Is
2
e
y
s
v
RX~
[image:43.546.15.530.30.669.2]VR+L
xn
= (
R-~R
)~
+ (&; )
(y~-Yn-1)
- (:~R
)
Xn-1 (21)- -(;R )x
c~-VR-L)
I (22)Xn -
V +L n - V +L XnR R
Yn =
I11Xn
(23)-,
/(24) Yn =
IDXn
'
Consider the example problem shovm in Figure 10 except that in this case the pulse frequency is increased to
50
cpm. Assume that, at thisfrequency, the column still operates in the mixer-settler region. Since equilibrium contact is assumed in both cases, the degree of separation
obtained at the higher frequency should be less because of the effect
of recycle. Figure 14 sh~1s the solution of this problem. The separation
obtained is drastically reduced. The required concentration of the
aqueous feed stream is now 26.3 f!fll./liter as compared with 98 f!JJ1./liter
for the same column operating at a pulse frequency of 22.) cpm. which is
the lo-r1er flooding point where recycle rate is zero. This change in x~
as the pulse frequency is increased above the lo-v1er flooding limit is
shown in Figure 15.
Thus far equilibrium contact has been assumed. The actual efficiency
20~---r---~---~---,---,---,
-
... E ~ 1M~
!:2 z 0"'
a: 0 !.
z 0
I
I
1/~
I
I
I
I=
I
"'
a: 1- z ~ z 0 (,) 1&.1
5
1- :::1 ..J 0 (/)
10
15
20
25
SOLUTE
CONCENTRATION
IN
AQUEOUS
PHASE
!om/liter)
Figure
14.
Solution
to
pulse
column
design
problem
in
which
the
effect
of
recycle
is
considered.
0 t-<t
Q:
t-z
LLJ 0z
0 0
a
LLJ LLJ LL.
(/)
::> 0 LLJ ::>
a
<t
50
PULSE AMPLITUDE
=t
-ln.
COLUMN DIAMETER =3-in.
NO. OF STAGES= 10
25
PLATE SPACING = 3- in.
AQUEOUS FEED= 800
cm~min.
ORGANIC FEED
=
1085
cm~min.
RAFFINATE
=
5 om /liter
SOLVENT= I gm/liter
0
0
10
20
30
40
50
PULSE
·
FREQUENCY (cycles/min)
[image:46.543.17.532.29.674.2]contact assumption in all cases it is possible to investigate, from
theoretical relationships, the effects of recycle alone on the operation
of the pulse column. In addition, the theoretical model having 100 per
cent efficiency provides a standard with which to compare experimental
data. Other applications exist for the model. Relative effects of flolof
rates, plate spacing, and other variables can be studied.
Stage efficiencies
For an actual column operating in the mixer-settler region,
equilib-rium contact would not be expected. Hence, from a design standpoint, it
is necessary to introduce the concept of stage efficiency. Figure
16
shows a typical stage n for a pulse column operating in the mixer-settler
region. The following material balance equations can be written around
this stage:
Upstroke:
(G
+
~)Yn-1
+
(P-ARu)xn+
ARuXn-1 = (G+
~)y~
+
~
(25)Downstroke:
(L
+
AR)~1
+
(E-Oa)y~
+
0rt
Y~l
= (L+
AR)Xo
+
Eynd d d d (26)
(27)
For the case of equilibrium contact, these equations become:
Upstroke:
(G
+
~)Yn-1
+
(R-ARu)Xn+
ARu_Xn-1= [m(G+
~)
+
RJ
I
(G
+
0Ru)
Yn
"
E
Yn
E Y
0 IRxn
RXn'
1
ARu
Xn-1(G+ORu) Yn-
1(29)
DO\mstroke:
+ E] Yn* • (JO)
Now, for the case of non-equilibrium contact, stage efficiencies can be
used. For a pulse column, two stage efficiencies may be defined, one
for the upstroke and one for the downstroke. There is no reason to
suppose that the two should be equal. Tht;- upstroke stage efficiency
will be defined as:
- /
y -Y
n n-1 I*
Yn -Yn-1 (31)
-~ I
where, Yn*
=
mxn_,
Substituting for Yn in equations 28 and 29 gives,
&un(G +
~)Yn-1
+
(R-ARu_)Xn+
ARuXn-1=
[mt~(G
+ ' )
+
R]
~
(G
+ ' ) [
mCunXn+
(1- Cun>Yn-11 + (E-G-,)yn =Ey~
•Similarly, the do~mstroke stage efficiency will be defined as:
-*
where Yn = mxn
/
x
-x
[ _ n+-1 n
dn-
x'
n+l-X:*
~n
so:
"n
= ( [::)
Yn+
(1-[<\,)
X~l
,+
(R-L-AR)~
=~
•d
Certain tenus in Equations 26, 27, 28 and 30 will drop out,
depending on which phase is discontinuous. If the light phase is
dis-continuous there will be no Cad tenus. If the heavy phase is
discon-tiruous there will be no ' tenus.
The Emulsion Region
The analysis of the pulse column vThich has been postulated for
operation in the mixer-settler region was based on the assumption that
each half-cycle of operation could be divided into two steps. First
the dispersine of two unlike phases with the resulting interphase mass
transfer and second, the mixing of two like phases of different
concan-trations. This assumption seemed plausible because of the separation of
phases which occurs at the end of each half-cycle of the pulse generator.
\men a pulse colwnn operates in the emulsion region, this separation
of phases between pulses does not occur and therefore the concept of a
two-step process does not appear to fit the physical situation. For
this reason a different mechanism must be postulated for emulsion
operation. In the emulsion region each half-cycle can be assumed to
occur in a single step and equations to describe the operation of the
of aqueous and organic phases. The total amount of liquid recycled on
each half-cycle is VR liters, of which AR liters is aqueous phase and
%
liters is organic phase. Hence AR
+
<>a,
=
VR. By a material balanceover stage n:
Upstroke:
AaXn,..1
+
(R-~)Xn
+
(G+
0a)Yn-l+
(E-G-%)Yn=
Ey~
+
~
Downstroke:
(L
+
Aa)x~l
+
~~1
+
(E-Qa)y~
+
(R-L-AR)~
=
Eyn+
Rxn tBy a material balance over the bottom of the column from the contacting
portion of the lower end section through stage n:
Similar~. material balances may be written around the top and bottom
end-sections. By combining the material balance equations with the
equilibrium relations y
=
mx
and y'=
mx'
(assuming equilibrium contact)the following two equations can be derived:
where,
,
Yn
=
L+
~
+
m<>a, (
~
)
,
+ (
Gys ..
Lxa ) (~
)R
+
mE o< Xn+l R+
mE o(Yn
= (
1-mo< )~
- (~-:
) xBo{
=
m(G+ %) +
ARE Yn
R
XnLxe
I
E
·
yn
R
X~~
(l+~+f)Xe
OR Ye
~
Ysf
Ys [image:52.542.18.514.22.702.2]Gys -
LxB
mG
These equations may be used for stage-to-stage calculations starting
from the bottom of the column. If these two equations are combined to
fo:nn a finite difference equation, the solution of the equation with the
I I
boundar,y condition
xn
=
xF when n=
N + 1 yields a relation which can beused to determine the number of theoretical stages necessary to perform
a given separation:
I I
-N
'
-N
xF
=
x1 a
+
K(l-a )
(JJ)where,
. a=
(
1~
) ( L+
R A:~
me>a )
2 I
0( xB(R +mE) + (1-o<){<qs-
Lxa)
•
'""'
,-..._' I "'
K=
o( (R + mE) - (1 - O()(L + AR +
me>a)
I . I .
The v~lues of x1 and xA nru.st be determined from material balances over
the end sections of the column.
Although equilibrium contapt h~s been assumed in this analysis. the
equation can be used to show the effect of the phase composition of the
recycled liquid on the operation of the pulse column. Consider the
following problem.
The equation of the equilibrium line is y
=
0.291x in terms of millimols/liter. Pulse amplitude will be 1. in. and pulse frequency will be .50 cpm.
Assume that the organic phase hold-up is 0.100 liter/stage for all stages.
What must be the concentration of the aqueous feed if the raffinate from
the column is to contain not more than 2.5 millimols of boric acid per
liter and if:
(1) recycle is all aqueous phase
(2) recycle is 7.5% aqueous and 25% organic
(3) recycle is
5o%
aqueous and50'/>
organic(4) recycle is 2.5% aqueous and
7.5%
organic(5) recycle is all organic phase?
The solution to the problem is shown in Figure 18, where the
neces-sar,y feed concentration is given as a function of the per cent of organic
phase in the recycled liquid. The presence of recycle causes a decrease
in the separation which would be possible it" no recycle existed. However,
this recycling of liquid cannot be avoided in the pulse column unless it
is operated at the lower flooding point.
If the two phases in each stage separated completely between pulses
then, assuming the principal interface to be at the top of the column,
all of the recycle would consist of aqueous phase. In the emulsion region,
the organic phase does not rise to the top of the stage at the end of an
upstroke, nor does all the aqueous phase settle to the bottom of the stage
l.J...
2 0
0 2
84
~0
< {
-a:::~ ~<{
zo::
w~
u z
~ ~
82
u5
ou
w
w
l.J...Figure 18. Change
inrequired feed concentration as a
From the results shown in Figure 18, organic phase recycle appears
to be more harmful than aqueous phase recycle. The variation in aqueous
phase concentration through the column for each case is shown in Figure
19. Graphical solutions for parts 1 and
5
are shown in Figures. 20 and21. Although the equilibrium line obtained from shake-up data for the
system is used in deriving the equations which have been developed, its
role in the graphical solution of the problem is completely differ~nt
from the role which the equilibrium line plays in the graphical solution
of a problen1 involving either a simple cocurrent or countercurrent
extractor.
If the problems shown in Figures 20 and 21 had been solved for the
number of theoretical stages using only the end compositions and the
method which applies to a countercurrent extractor, then the stages would
have been stepped off between the over-all operating line ~nd the
eqUilibri-um line. This latter method of calculation would have given considerably
different answers.
The graphical solutions given in Figures 20 and 21 show that it i.s
theoretically possible for a pulse column to be operating in a pinched-in
region even though this is not indicated by the ratio of the superficial
flow rates to the column. The phase composition of the recycled liquid
in the column alters the actual flow rate ratio which exists within the
column and hence a change in this ratio would cause a change in the slope
0
g:
85
en
z
~
0
z
0
75
[image:57.549.22.527.25.673.2]-_J ...
en
0
65
E
E
-w
en
55
<!
I a_
en
:::> 0
~
45
0
<!
lL.
0
z
35
0
~
a::
~z
I
2
3
4
5
0
°/o
25
°/o
50
°/o
75
°/o
I 00
°/o
~ 25~,--~-,----._,--~~. --~-,----._,--~~.---.
~ Xe
x,
x2
x3
x4
x!S
Xe XAu
Figure 19.
AQUEOUS PHASE
BY
STAGE NUMBER
Chan~e
in aqueous phase concentration through the column
50~----~----~---~----~---~----~----~~--~
La.1 (/') <t:
40
J: a.. (.)
z
<t: c:>- a:'-30 0 ~ z:.J
'
1/)z- o
0-E
~ ::: 2 <t ::: 0a:
E
~
z
w (.)PART (1). NO ORGANIC PHASE IN RECYCLE OVERALL STAGE LINE
.
~
z
0 (.)I 0
I-EQUILIBRIUM
LINE
II
50r---.---~---,---~---~----,---,----~
lLI en
40
<t :X: Q.. u
z-
~
~30
a::
·-0
....J ...
z
II) 0
z
.
§
Q::20
I-E
<!
a::
1-z
lLI ~10
0 u II
sampling techniques which were developed to carry out the experimental
phase of the program. An over-all now diagram of the equipment is
shown in fieure 22. A photograph of the equipment is shown in Figure
23. The specifications of the pulse column are:
diameter -
3
inchesplate spacing -
3
inchesplate materials - aluminum and type 304 stainless steel
hole diameters - 0. 0625 in. and 0. 040 in.
number of stages - variable, up to 14
frequency range -
13
to 120 cycles per minute amplitude range - 0 to 4 inches/cycle :The column was constructed of short glass sections. The perforated plates
were sandwiched between polyethylene gaskets and the entire assembly was
held together in compression by four tie rods extending the length of the
column.
Aqueous and organic phases were fed to the column by Eastern Model
D-11 centrifugal purnps and metered by rotameters. The principal interface
was controlled by a valve in the aqueous effluent line unless the pulse
generator caused excessive pulsation of the raffinate stream. In the
latter case the raffinate was drawn from the column by a centrifUgal pump
and metered by a rotameter in the raffinate line. The pulse generator
consisted of a 6-in. dia. stainless steel bellm~s driven by a variable
AOUEOOS
FEED
TANK FOR
EXTRACTION
COLUMN
~
..!.,....+~--,1
~
~
ORGANIC FEEDl
J
i
~~1tth
IEJ
,..
i
"
EX::~:lON
I
r
'
!
c~t-
li-.
rn
C~rA
~~
gmru=r'rLJ
AQUEoUS FEED PUMP ORGANIC FHD PUMP PULSE GENERATOR EXTRACTION COLUMN FRES / WATER_l
AQUEOUSFEED
TANK FOR
STR I PP I NG COL U MN
I?~
ORGANICFEED TAN K FOR STR I PP I NG
I
I 1
L.~ II
COLUMN u
v
3l ~LJ
~~~
l
r+-!..1
'r- i=. r-- l:::::
~ ORGAN I C FEED AQUEOUS FEED PUMP PUMP S T RIPPING COLUMN
,..
Figure 22. Flow diagram of the pulse column and associated equipiOOnt.ORGANIC STORAGE