ST U D IE S OF V A C U U M M A G N E T IC
SU R FA C ES IN H -l U S IN G T O M O G R A P H Y
by
Roy Bienes Tumlos
December 1994
A thesis submitted for the degree of
Doctor of Philosophy
This thesis represents my own original research. All authorities and sources con sulted have been acknowledged.
C o n t r i b u t i o n s
Prof. S. M. Hamberger, Dr. L. E. Sharp, Eng. D. B. Shenton and Dr. B. D. Blackwell were responsible for the scientific design of H-l. Fabrication of H-l was done in the School’s Mechanical Workshop. The concept of using tomographic techniques were jointly developed by Dr. Blackwell, Dr. J. Howard and the author. The design of the multi-wire grid detector in H-l was jointly developed by Mr. N. Trama, Mr. J. Wach, Mr. E. Wedhorn, Dr. Blackwell, Dr Howard and the author and fabricated in the School’s Mechanical Workshop by Mr. H. Zeilinger. The tomographic code was developed by Dr. Howard. The signal handling electronics was jointly designed by Dr. Blackwell, Mr. G. Hoecherl and the author, tested and fabricated by the author. The electron gun was designed and fabricated by Dr. M. Shats, Mr D. Rudakov and Mr Wedhorn. The data from the fluorescent mapping were provided by Dr. Shats and Mr. Rudakov.
A c k n o w le d g m e n ts
I wish to thank all the staff and my fellow students of Plasm a Research Laboratory
in the Research School of Physical Sciences and Engineering, the Filipino student
com m unity here in ANU, the staff of the N ational In stitu te of Physics in the
University of the Philippines and the staff of the AIDAB Regional Office of the
ACT.
I would like to express my deepest gratitu d e to my supervisors, Dr. Boyd
Blackwell and Dr John Howard for their patience and tireless support during my
stay here. Their talents and able academ ic guidance had led me out of difficult
situations countless tim es and provided me with the chance to gain from their
knowledge and experience. Their dedication has served as an inspiration for
struggling students like me. I am grateful to Prof. Sydney H am berger and Dr.
Les Sharp for giving me the chance to do a Ph.D degree in this dep artm en t and
for their valuable support.
I would like to thank Dr. Misha Shats for the helpful discussions he provided
and Mr. D im itri Rudakov for helping me set up the electron gun and for giving
me some tips on its m aintenance. The fluorescent m apping experim ent they did
w ith Dr. Sharp and Dr. Blackwell gave us a head start in our experim ent.
I would like to thank Dr. Henry G ardner for some useful discussions and for
proof reading p arts of this thesis.
I would like to thank the technicians for their efforts to keep H -l ticking. I
am grateful to John Wach for m aintaining the vacuum system in H -l, Rob Davies
for the help he gave during the experim ent and Gerry McCluskey for m aintaining
th e power system in H -l. I am very grateful for th e assistance given by Mr Neil
T ram a whose design efforts m ade it possible for this experim ent to be realized.
They seem to be always there when I needed them the m ost and their occasional
jabs at hum our is always a welcome relief from the routine. I would also like to
th an k Ray Kimlin for lending us the H-l Control System and for doing a good
staff also been helpful, especially Ms. Helen Hawes and Mrs. B renda Newham. I
also thank the staff of School C om puter Unit.
I would like to thank my fellow students Mr. Beichao Zhang, Mr. George
W arr and Mr. D arryn Schneider and Dr. Peter Loewenhardt and Dr. X uehua
Shi and their families for their moral support and hospitality. I would like to
th an k all the Filipino students, especially M yrna, Melanie, Luisa, Ray, Rachel
and Sonny, Menjo, Roland, Cleofe and Lau for the w arm th of their friendship and
com panionship. I would like to thank M elinda and Ben K erkviet, the Sazegar
family, Chris, Sittipong, Mali, and Pauline for their friendship and hospitality.
I am grateful for the financial support awarded by AIDAB. I would also like
to thank the student liaison officers of the ACT Regional Office, especially, Mr.
P eter Nichols and Miss Jo Hodges for the com passionate support they have given
me during the m ost difficult tim e of my stay here.
I would also like to thank the NIP staff especially Dr. Roger Posadas, Dr.
Jose M agpantay, and Dr. Henry Ramos for their valuable support and under
standing. I am also grateful to the NIP office staff m em bers, Lina, Aling Flor
and Aling C haring for taking care of the paper work.
I would also thank my brothers and sisters and their families for the m oral
support they have given me and the care th a t they have given our parents while
I am here.
Not the least of all, I would like to thank my father, Leodegario and my
A u t h o r ’s P u b l i c a t i o n s
Refereed Publications:
Tomographic Wire-Grid Imaging of Magnetic Surfaces Blackwell, B.D., Howard, J.,
Tumlos, R.B., Rev. Sei. Instr. 63 (1992) 4725-4727.
Experimental Investigation of the Magnetic Structure on the H-l 7/e/zacShats, M.G.,
Rudakov, D.L., Blackwell, B.D., Sharp, L.E., Tumlos. R.B.. Hamberger, S.M. and O.I. Fedyanin, Nucl. Fusion 3 4, (1994) 1653-.
Conference papers, unpublished or abstract only published:
Blackwell,B.D., Borg, G.G., Dewar, R.L., Gardner,H.J., Hamberger,S.M., Howard, J., Painter,S.L., Sharp, L.E., Tumlos. R.. Warr, G., Zhang,B. The ANU Heliac
Programme: Status and Results Bulletin of Ameri can Physical Society 36 2294
(1991)
First Operation of H -f
S. M. Hamberger, B. D. Blackwell, G. G. Borg, H. J. Gardner, J. Howard, S. L., Painter, L. E. Sharp, M. Shats, R. Tumlos. B. Zhang,
Bulletin of the American Physical Society, America, Vol. 37, No. 6, Nov, 1992.
B.D. Blackwell, J. Howard and R.B. Tumlos. Tomographic Wire-Grid Imaging of
Magnetic Surfaces, A.I.N.S.E. Plasma Science and Technology Conference, 12-15
First Experimental Results and Recent MHD Studies for the H-l Heliac\
B.D. Blackwell, G.G. Borg, R.L. Dewar, H.J. Gardner, S. M. Hamberger, H. Howard, D. Rudakov, L.E. Sharp, M. Shats, R. B. Tumlos, G. Warr, B.C. Zhang, W.A. Cooper, P.R. Garabedian, T. Hayashi,
A b s t r a c t
In this thesis, a novel approach of m apping vacuum m agnetic surfaces th a t uses
techniques developed in tom ography is presented. The construction of a m u lti
wire grid detector system and the electronics designed specifically for th e exper
iment in H -l will be described. The reconstruction technique adopted to process
the projection d a ta from the experim ent, Algebraic R econstruction Technique
( “A RT” ) will be discussed together w ith the concepts im portant to u n d erstan d
ing it.
The results of studies to sim ulate the tom ographic surface m apping will also
be presented. The sim ulation provides insight into some aspects of the
experim ent, e.g. noise in d ata, effect of m apping geometry, etc., and it also aided
in determ ining the optim um values of the param eters involve in the reconstruction
process, e.g. relaxation param eters, constraints, term ination of the processing,
etc., imposed on the projection data.
The scheme of investigating th e sources of error fields in H -l using th e HELIAC
code will be described, and can be found in the general discussion of error field
analysis and outlined using m apped surfaces from both the tom ographic and
fluorescent technique. It will be seen in the results of the error field analysis
in H -l th a t both techniques gave a consistent value (w ithin 1mm) for th e ring
conductor displacem ent, a nom inal displacem ent of 2.5 m m is predicted from th e
fluorescent technique while th e the tom ographic technique predicted 1.6 m m . T he
consistency of the two techniques is again dem onstrated in the m apping done on
the 5/4 resonance island where the current-crossovers of the poloidal field coil is
the resonant error field source.
The results presented in this thesis will show th a t this novel approach in m apping
vacuum m agnetic surfaces can be a more effective and accurate altern ativ e to th e
fluorescent technique, m ainly because it can operate w ith lower beam energies,
the detector position can be accurately calibrated against the m achine centre
and the images it produces are free of the optical distortion characteristic of the
C o n te n ts
1 In tr o d u c tio n
2 H - l , V a cu u m M a g n e tic C o n fig u ra tio n s, and th e H E L IA C C o d e
2.1 H-l ...
2.1.1 Coil Configurations ...
2.1.2 Vacuum S y stem ...
2.1.3 Electrical Circuit and Power Supply...
2.1.4 Control S y s te m ...
2.2 Vacuum Magnetic C onfigurations...
2.2.1 Magnetic Surface and Magnetic A x i s ...
2.2.2 Rotational Transform and Magnetic S h e a r ...
2.2.3 Magnetic W ell...
2.2.4 Magnetic I s l a n d s ...
2.3 HELIAC C ode...
2.3.1 Description of the Code ...
2.3.2 Error Field Analysis Using the Heliac C o d e ...
3 D ia g n o s tic s and D a ta -h a n d lin g S y s te m
3.1 Electron G u n ...
1
7
7
11
12
13
14
14
15
15
16
17
17
24
30
3.2 Wire-Grid Detector 33
3.3 Signal Processing Electronics... 38
3.3.1 Preamplifier Stage ... 40
3.3.2 Filter S t a g e ... 42
3.3.3 Multiplexer Stage and Control B o a r d ... 44
3.4 Data Control S y s te m ... 44
4 M a p p in g V a cu u m M a g n e tic S u rfaces and T o m o g ra p h y 47 4.1 Basic concepts... 47
4.1.1 Sampling and A lia s in g ... 48
4.1.2 Reconstruction of D a t a ... 50
4.2 Simulation E x p e rim e n ts ... 58
4.2.1 Test Picture and Simulation of the Projection Data . . . . 58
4.2.2 Reconstruction of the D a ta ... 62
4.2.3 Discussion of the R e su lts... 66
5 R e su lts 72 5.1 General ... 72
5.1.1 Acceleration V o lta g e ... 72
5.1.2 Grid Biassing Voltage ... 76
5.1.3 Effects of Background P r e s s u r e ... 77
5.1.4 Noise M easu rem en ts... 79
5.2 Mapping the Magnetic S u rfa c e s... 83
5.2.1 S e t- u p ... 83
5.2.2 Mapping R e s u l t s ... 84
5.2.4 Resolution ol the Reconstruction T e c h n iq u e ...104
5.2.5 Image of the Ih = 0 C onfiguration... 105
6 Summary and Conclusion 108
6.1 Comparisons Between the Multi-wire Tomography and Fluorescent Techniques... 108
6.2 Error-field Analysis in HI ...110
6.3 Conclusion... I ll
7 Appendix 112
7.1 Simulation of the Magnetic Surface and the projection Data . . . 112
7.2 Reconstruction C o d e ... 121
7.3 Sinogram ... 131
C h a p te r 1
I n tr o d u c tio n
The 1980’s saw a renewed interest in stellarators as a viable alternative to toka- maks as nuclear fusion devices. This revival was sparked by a combination of the advances in theoretical and computational plasma physics of the time [4, 31, 45, 46] as well as a recognition of the recurrent problems encountered in tokamak experiments due to their large induced plasma currents. Various stellarator facilities are now in operation, for example: the Advanced Toroidal Facility(ATF) [41], Heliotron-E [59], Compact Helical System(CHS) [44], Wendel- stein VII-AS^[51], TJ-II [1], SHEILA [6] and H-l [25]. The magnetic coil design of each of these stellarators has been optimized to address various issues concerning the equilibrium, stability and transport properties of their plasma configurations. They can be grouped into two classes depending on the shear of the magnetic field: 1) the high shear “conventional’’ stellarators such as Heliotron-E, CHS and ATF and 2) the low-shear, magnetic-well-stabilised devices such as W7-AS,
TJ-Laroyt UeAic*^ V6'J\(ts
The H -l, T J-II, and SHEILA devices belongs to the class of helical axis stellara-
tors or Heliac. The prototype SHEILA heliac was the first device of its kind in
operation in the world. H-l is presently in its second year of operation, and th e
sim ilarly sized T J-II is presently under construction by the European C om m unity
in Spain. The concept behind the Heliac is sim ilar to th e stan d ard “figure-eight”
stellarator concept proposed by Spitzer in 1958 [57]. In the figure-eight, th e ro
tatio n al transform in the m agnetic configuration can be produced by eith er a
solenoidal field w ith the figure-eight shape or by adding a “transverse m u ltip o
lar helical field with helical sym m etry” . In a Heliac, the rotational transform
is achieved by th e helical displacem ent of the centre of the toroidal coils w ith
respect to the central conductor. An aspect H -l shares with SHEILA and T J-II
is th e incorporation of a / = 1 helical winding around the central conductor which
allows control of the rotational transform and m agnetic shear. This additional
winding, greatly increases the range of vacuum m agnetic configurations th a t can
be studied, thus, they are called “flexible heliacs” [26]. Figure 1.1 shows a ty p i
cal H -l configuration in 3-D surface representation and table 1.2 com pares th e
param eters of H -l, SHEILA and TJ-II.
Before meaningful plasm a experim ents can be perform ed on a stellarator, th e
vacuum m agnetic field needs to be m apped to confirm th a t th e desired configura
tions are achieved.To varying degrees, the idealised configurations are not realised
because of the effects of error fields. These error fields may originate from the
presence of m agnetised iron structures close to the device, leakage fields from th e
current feeders of the coils, faults in the assembly of th e coils or m is-alignm ent of
th e coils. They can modify th e configuration and degrade its confinement prop
erties: whenever a m agnetic surface in the configuration resonates w ith th e error
field, large m agnetic islands m ay arise, deforming th e configuration and form ing
ergodic regions. It is im p o rtan t, therefore, to identify and m easure th e error
fields and determ ine their sources so th a t they can be controlled. If, for exam ple,
the source of the error field is a m isalignm ent of the coils, th en the alignm ent
could be corrected, or if the error field comes from an unavoidable source, then
ef-Figure 1.1: The typical configuration of H -1(N = 3 helical axis stellarator). (Note that only half the number of the toroidal field coils are illustrated.)
S H E I L A H I T J - I I
n u m b e r o f fie ld D eriods 3 3 4
n u m b e r o f to r o id a l co ils 2 4 3 6 3 2
Mean ra d iu s o f to to id a l c o ils (m ) 0 . 0 6 5 0 . 3 8 3 0 . 4 2 5
sw ing ra d iu s o f to r o id a l c o ils (m ) 0 . 1 9 ) o . z z
0 . 2 8 5
M a io r ra d iu s (m ) 0 . 1 9 1.0 1.5
T y p ic a l m ean m in o r Dlasma ra d iu s (m ) 0 . 0 3 0 . 2 0 0 . 1 - 0 . 2 5
Plasm a v o lu m e (m ) 0 . 0 0 4 0 . 9 1
a ve ra g e fie ld (T )
1.0
M axim um fie ld (T ) 0 . 4 0 . 2 5 / 1 . 0
D u ra tio n (s ) 0 . 0 4 o o / l
M axim um rin g c u rre n t(k ftt) 2 8 5 0 0 - 2 8 0
Mean ra d iu s o f c o n tr o l h e lix (m m ) 1 . 4 9 6 7 0
D ia m e te r o f v a c u u m e n c lo s u re (m ) 0 .6 3 . 9
r f h e a tin g p o w e r(k W ) 0 . 4 2 0 0
[image:14.560.25.539.15.812.2]fects [9, 14, 29, 36, 37, 61]. In H -l, because of its low shear, a configuration can
be avoided altogether if an error field is known to produce destructive resonant
islands by using the helical coil to change the rotational transform .
The traditional m ethods of m apping m agnetic flux surfaces use either a directed
low-energy electron beam [13, 18, 23, 27, 29, 35, 52, 58, 56] or a bare emissive
filam ent [20, 40] em itting in all directions.
In the directed electron beam m ethod, a beam of electrons is launched parallel
to th e held lines of the m agnetic surface and a detector intercepts its p ath to
produce the poloidal m ap of the surface. An advantage of this m ethod over
the bare-em issive filament m ethod is th a t, since th e electron beam is practically
confined to th e held line tracing the surface it is m apping, th e rotational transform
can also be m easured. It is im p o rtan t, however, to note th a t the m easured m ap
of the surface using the electron beam m ethod is the electron drift surface which,
if we assume th a t the electron has only a parallel velocity(v||) to the m agnetic
held(B ), is shifted from the hux surface by an am ount approxim ately given by
— (±V ||m e/eB7) [27]. The (± ) sign is determ ined by the relative direction of the
electron velocity w ith th e held lines, 1 is th e rotational transform of th e hux
surface and m e and e are the mass and charge of the electron, respectively. To
m inim ize the effect of this drift in th e m apping, the best possible conditons m ust
be adopted by using a low-enegy electron beam and highest possible m agnetic
held.
The conventional detectors used in th e directed electron beam m ethod are either
a huorescent-coated mesh or rod, or an electric collector-probe. The use of the
fluorescent probe is by far the m ost popular because it allows an accurate and
com plete imaging of the hux surfaces. In this technique, light spots are em itted
whenever the electron beam hits the detector and are recorded w ith a CCD
cam era. The image is stored either by using a video recorder or, in digitized-
form, directly in a com puter. Typical beam energies required for the light spots
to be bright enough for analysis ranges from 40 eV to 300 eV. In th e lower regime
special CCD cam eras [13] or specially designed rod detectors [58].
In th e emissive-filament technique, a heated and bare filam ent is used to scan
the m agnetic surfaces. The current collected by the vacuum vessel wall (diode
m ethod) a n d /o r a tran sp aren t grid (triode m ethod) is m easured and analyzed.
Assuming th a t the surface has constant effective resistance (also a m easure of
confinement of th e electrons) th a t is different from other surfaces, then the em is
sion current plotted against the position of the probe will give a m ap of th e flux
surfaces.
Tim s dbe4i<. describe5a novel alternative to the existing surface m apping
schemes which is m otivated by the success of the slice-imaging techniques (to
mography) developed in the fields of medical imaging and astronom y [30]. The
new technique involves the use of a directed e-beam and m ulti-w ire grid detector
to produce projections of th e surface. The image of the surface is reconstructed
from th e projection d ata using discrete back-projection and a well known algo
rith m to enhance the image called ART (Algebraic R econstruction Technique).
This technique was first perform ed in SHEILA [5] in a very lim ited fashion but
w ith convincing results. Some modifications have been added since th a t tim e
and a higher resolution detector was designed for the m apping experim ent in
H -l. The system has a very high absolute positional accuracy, characteristic of
precision rotating mechanism s, uses low-current, low energy beam , and does not
suffer from optical distortions or cam era pixel resolution lim its.
C hapter 2 contains the discussion of the design principles and construction of
th e H -l device, definitions of the param eters th a t describe vacuum m agnetic
configuration and other concepts related to it, and a discussion of the field-line
tracing code, HELIAC and its use in the error field analysis in H -l.
C hapter 3 will discuss the im p o rtan t aspects of the m ulti-w ire grid detector and
the data-handling system .
C hapter 4 deals w ith concepts related to the reconstruction technique and de
sim ulation of the m apping experim ent and its results.
C h ap ter 5 describes the results of the m apping experim ent perform ed on H-
1. Also included are the m ap-fitting procedure for H-l and the identification
of th e error field sources based on the m ap-fitting. Some observations of the
reconstruction of the projection d ata will also be presented.
C h a p te r 2
H - l , V a cu u m M a g n e tic
C o n fig u r a tio n s, an d th e
H E L IA C C o d e
This chapter will be discussing the design of H-l and the relevant concepts to characterize the magnetic configurations. Also, results from the magnetic field line tracing code for H-l will be presented and discussed.
2.1
H - l
2.1.1
C oil C onfigurations
A view of the coil system of the H-l device is shown in figure 2.1.
The coil system consists of 36 toroidal field coils(TFC) with their centres arranged on the 3-period helix around the central ring (poloidal field coihPFC) according to the general law
R — R0 -f pscos3</> (2.1)
INNER VERTICAL FIELO COIL
VACUUM VESSEL TOROIDAL FIELO COILS 1361 HELICAL WINOINC CENTRAL RINC
OUTER VERTICAL FIELO COIL
0
[image:19.560.134.478.43.620.2]where R0 = 1.003 m(major radius of the ring), ps = 0.22 m(swing radius) and the toroidal angle, (f>j, gives the azimuthal spacing of the TFC and obeys the law,
<j>j = — O.O97sin30j (2.3)
/ 2 7r 1
(t>\ = (j ~ ö )» J = 1 7 2,..., 36 . (2.4)
A helical conductor(HC) is wound around the PFC, in phase with the TFC, for more flexible control of the poloidal field component, in particular the rotational transform and the magnetic well. The helical coil follows the winding law,
R = Ro + phCos3</> (2.5)
z = phsin30 (2-6)
where p\x = 0.095 m is the helical swing radius.
Two sets of vertical field coils are also added to compensate for toroidal effects, the outer vertical field coils(OVC) and the inner vertical field coils(IVC). Except for the OVC, the coil system is inside the vacuum tank and the necessary access ports are provided for the diagnostics, electrical feedthroughs and coil-cooling system. This arrangement was adopted to suit the local facilities and available resources.
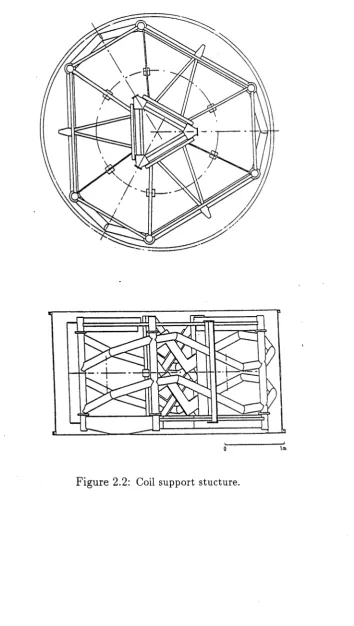
The TFC coils are made out of a 29.2 mm square-section copper with a 6 mm diameter hole for cooling. Each TFC coil consists of two 5-turn spiral pancakes with RF butt-brazed current-carrying connections. The pair is encapsulated in a 1.2 mm thick welded stainless-steel jacket and filled with Sylgard 170 silicone- basecl potting compound which provides insulation and vacuum-sealing. Each complete TFC coil is mounted to the structural space frame by clamps which also allow for small adjustments to accommodate magnetic axis corrections if
necessary (figure 2.2).
phase with the helical period. The HC winding consists of 4 turns of the same conductor as the PFC, with centres poloidally spaced 12.5° apart and encircles the ring threes times in phase with the TFC. The mean helical pitch angle is 16° and the mean helix radius ph = 0.094m.
The vertical field coil system, both IVC and OVC, are wound using the same square-section conductor as the TFC. The OVC, creating the main vertical field(Bv), has 12 turns located outside the vacuum tank in an approximate Helmholtz pair arrangement. The IVC has 16 turns (in 2 double pancakes) encapsulated simi larly to the TFCs and mounted on the coil support structure. The IVCs control the variation of the Bv with the major radius: i.e. the index 7 where Bv oc R~V The Bv can be made constant(within 1%) over the whole plasma volume(7 = 0) or to approximate the law 7 = 1 to help reduce the | B | ripple.
2 .1 .2 V a c u u m S y s te m
The vacuum tank is fabricated from 304 stainless steel and is 3.9 m in diameter and 3.4 m high. The two ends of the cylinder (both ends have dish-shaped lids), are provided with Viton O-ring seals. The interior surface is polished to a 0.6
p m finish by hand-grinding. The internal surface is designed to be outgassed by circulating pressurized hot water (around 120° C) through water channels that are in contact with the outside of the walls. The same method can be used for the coil jackets by using the coolant circuit built-in to the coils. (Another way of slowly outgassing the coils is by using the coil current lor heating them without running the cooling system heat exchanger.)
OVC IVC HC
3 . 1 4 mQ 2 . 3 mD
r—/ÖÖÖ^—/ » - / ö ö ö f r
Helical Shunt
0- 1 2 . 5 mD.
Change-over Switch
Mercury Arc Rectifier (MAR) 0-1 3kA Motor Generator S e t (5 0 0 V) 0 - 2 0 0 0 Amp
1 9 . 4 mQ 1 9 . 5 mH
Figure 2.3: Basic circuit diagram of the Il-i coil-system,
during surface mapping experiments.
2 .1 .3 E le c tr ic a l C ir c u it an d P o w e r S u p p ly
A simplified circuit diagram of the H-l magnetic coil system is shown in fig ure 2.3. The coils are connected in series, as shown, to ensure the invariance of the magnetic geometry with field strength. A shunt is connected parallel with the HC to enable control of the helical current and can introduce a small frequency dependence in the current ratio. The vertical field coils (both the inner and the outer), can be tapped to change the number of the coils that will be used. These allow ease of change-over between different magnetic configurations.
C o i l S e t 1 - T P u l s e M o d e M W
R e c r i f i e r
0 . 2 5 - T C o m . M o d e k W
M o t o r - e e n e r a t o r 0 . 1 5 - T C o n t . M o d e j
k W
T F C 3 . 6 8 2 3 0 81
j
P F C 3 . 8 4 2 4 0
j
S-H e l i c a l 0 . 4 3 27 10
V F C 1.41 8 8 3 0
T o t a l 9 . 3 6 5 8 5 2 0 5
Figure 2.4: Typical coil power requirements in H-l.
c**3
supply. The steady-state operation of H-l is limited to a 0.25 T field by thermal stress in the PFC. Table 2.4 shows some typical coil power requirements for H-l.
2 .1 .4 C o n tr o l S y s te m
2 .2
V a c u u m M a g n e t ic C o n f ig u r a t io n s
It has been mentioned in Chapter I that, unlike in tokornaks, the confinement properties of a stellarator device is produced entirely by external field coils. The field geometry, in the absence of plasma, is called a vacuum magnetic
configuration. The geometry should be identical to the plasma magnetic geom
etry as ß (plasma pressure/magnetic pressure) approaches zero. In this section, the quantities and concepts that describe a vacuum magnetic configuration will be defined and discussed.
2 .2 .1 M a g n e tic S u r fa c e an d M a g n e tic A x is
A surface on which all lines of magnetic force lying on it encloses a constant toroidal magnetic flux(^(r) = const) is called a magnetic surface or a flux surface.
It satisfies the condition that (V ^(r)) • B = 0.
A vacuum magnetic configuration with good confinement geometry has nested magnetic surfaces. Individual surfaces can be described by their effective mean radii(f) or by their flux('0) values. The total volume enclosed by the confining vacuum configuration is defined by the volume enclosed by the biggest mag netic surface just inside the last plasma closed surface. The configuration can be bounded by a separatrix, ergodic region or (most likely) by a field line or set of field lines that makes only a few toroidal transits before reaching either the TFCs or other parts of the structure. This defines the plasma boundary in the device. A magnetic surface which has a single field line which closes on itself only after an infinite number of toroidal transits is called an irrational surface. A field line on a rational surface (7 = 7^ both m and n are integral, see equation 2.7) closes on itself after n toroidal transits(m poloidal transits), and so to “cover” a rational surface, an infinite number of closed field lines are required, starting at different
phases.
2 .2 .2 R o t a t i o n a l T r a n s f o r m a n d M a g n e t i c S h e a r
The rotational transform of a magnetic surface measures the average ’twist’ per toroidal turn of the held lines lying on the surface about the magnetic axis. It is calculated as,
.. 1 /' dO ,
h $ d*-
( 2 - 7 ) Here k is the number of toroidal transits of the field line, 0 is the poloidal angle and(j) is the toroidal angle. The ’safety factor’ q used for tokamaks is the reciprocal of the rotational transform. In terms of the toroidal frame of reference, the rotational transform per period is given by
= — , (2.8 )
mi,
where nih is the number of helical periods, and in the helical frame (a frame rotating with the “bean”-shape) as
q, = 1 - h ■ (2.9)
The values of the rotational transform in these I,wo reference frames are used for various purposes, e.g. to calculate the beta limits of the device resulting from the helical and toroidal shifts due to Pfirsch-Schluter currents.[8]
Magnetic shear is the variation of the rotational transform with the magnetic surface. The shear is positive when the t increases away from the magnetic axis. The existence of a large shear has been found to have stabilizing effects on ballooning mode and drift instabilities. It also limits the size of magnetic islands that arise from resonant held perturbations on the configuration.
2 .2 .3 M a g n e t i c W e l l
volume, U, of the magnetic surface is defined as [47],
which can be expressed as
For rational surfaces, the specific volume can be written as,
U
l y d 1
k 4k B
(2.10)
(2.11)
(2.12)
and for irrational surfaces, it is written as
U lim —
k—t-oo k (2.13)
Whenever the specific volume decreases monotonically, going outward from the magnetic axis, the quantity,
^ U ( U l a s t surface F 'a x i s )
U U axis
(2.14)
is negative, i.e., the field increases in an average sense going outward from the magnetic axis. The quantity — is called the magnetic well depth. The existence of a magnetic well in the vacuum configuration favours MHD stability at low plasma pressures.
2 .2 .4 M a g n e tic Isla n d s
An example of how a magnetic island destroys an otherwise good configuration is shown in figure 2.5 . It shows the evolution of the l = 1.5 island with respect to the helical current, from ^ = 12.5% to L- = 17%( see definition of ^ after equation 2.17). Here, the computations are made using the known coil alignments and
■G; .
the PFC current crossovers. In r2.5a, the configuration is fairly good and the resonant surface is about 5mm from the magnetic axis. The bifurcation of the configuration is noticeable af*>.5b and at 2.5c, the higher order resonance, t = | , is seen to manifest from the outer surfaces. At the final stage, the two islands coalesce and a distinct ergodic region is formed between the islands.
An appropriate choice of the rotational transform and magnetic shear of a vacuum configuration can minimize the undesirable effects of resonant magnetic islands. In the case of H-l, this is done by changing the helical current and vertical field. H-l has a good range of configurations; useful studies can be made even of the configurations that are not considered desirable.
2 .3
H E L IA C C o d e
2 .3 .1 D e s c r ip t io n o f th e C o d e
The program HELIAC is used to study the vacuum magnetic field of H-l. It is a field line tracing code that uses filamentary coils to create a model of the magnetic field configurations in H-l [17]. This program can calculate the location of the magnetic axis and the magnetic surfaces, and gives the rotational transform, well depth, toroidal flux, enclosed area, shear, and provides estimates of stability limits. The code is run on the ANU Supercomputer Facility using the Fujitsu
VP2200.
All the coils in H-l are modeled by filamentary elements in HELIAC. The helical coil is described as a piecewise linear filamentary conductor whose nodes follow
the law:
. ' ; 1.
: 1 \
l i ) § •
ä
. m
[image:29.560.76.506.85.681.2]r = R0 -f p s x c o s ( 6 )
z = p s x sin(0)
(2.16)
(2.17)
where 0O = 0 °,h i = h3 = 3 ,h 2 = 0, R0 = 1.003m, and p s = 0.094m.
As m entioned in section 2.1.3 , the coils are connected in series bu t since the
coils have different num ber of windings, the current assigned in th e code will
Wi+R
vary accordingly. The OVC can be tapped to operate^up to 12 coil turns, the
IVCs have 16 coil turns or by ad u stin jth e HC shunt, th e HC current can be
changed as easily. In the input files these are given their actual physical val
ues bu t in this thesis the currents are norm alized to the PFC current. For
exam ple the am p-turn ratio for the standard case where there are 16 turns of
IVC, 8 turns of OVC and the HC current is zero is expressed in th e order TFC
I PFC I HC I IVC I OVC as 10 I 1 I 0 I 0.444 | 0.222[54]. Figure 2.6 shows typical
com puted vacuum m agnetic surfaces using the coil positions m easured after as
sembly of H -l. The configuration has no HC current and 16 turns of the IVC
and 8 tu rn s of th e OVC are connected. The PFC current is also w ritten as Ir and
the helical current as R. The ratio Ih /Ir is usually quoted to identify the helical
current utilized for a particular m agnetic configuration. A negative value means
th a t th e helical current is opposed to the direction of the PFC current. During
1994, when the e-beam tom ography results were obatained, the stan d ard case
was unavailable because of a failure in the IVC. A sim ilar case to th e stan d ard
a b
- 0. 2
1.00 1.10 1.20 AZIMUTHAL ANGLE = 0 . 0 0 ,
1 . 3 0 1 .4 0 PUNCTURE PLOT.
0 .0 0
- 0 .1 0
-0. 2 0
- 0 . 3 0 - 0 . 4 0
0 . 8 0 0 . 9 0 1 . 0 0 1 . 1 0 1 . 2 0 AZIMUTHAL ANGLE = 8 5 . 0 0 , PUNCTURE PLOT.
C
-0. 2
1 . 3 0 1 .4 0 PUNCTURE PLOT. 1.00 1 .1 0 1.20
AZIMUTHAL ANGLE = 1 2 0 . 0 0 ,
d
o 1.20
1 . 2 2 1 . 2 4 1 . 2 6 1 . 2 8 1 . 3 0 1 . 3 2 1 . 3 4 1 . 3 6
radial position of the surface(m)
Figure 2.6: A typical puncture plot of the magnetic surfaces from the HELIAC code. The helical current in this case is zero and the IVF/OVF turns is 16/8. This condition is the standard case in H-l. a-c shows the flux surfaces at (/> = 0°, 85°, and 120°, respectively. The rotational transform is shown in d.
[image:31.560.72.458.65.425.2]Z
O
)
f. magnetic axis
1.2194 1.2186 1.2188 1.2190
R(m)
1.2192
Figure 2.7: (a-e) The puncture plot of the magnetic surfaces with the same conditions(Ih = 0,12 turns of IVC and OVC) except using different
number of filamentary coils in the model to describe the PFC. (f) Scatter
ro
ta
tio
n
a
l
tr
a
n
s
fo
rm
1.25
1.20
1.15
I i i i i i I i i i I i i i | i i i I i i i I i i i I i r
D ... 1-turn PFC
x ... 9-turn
x ... 36-turn
m
m
B
m
m
m
M
. M
m r
-. - -. - W
1.20 1.22 1.24 1.26 1.28 1.30 1.32 1.34 1.36
R(m)
2 .3 .2 E rror F ie ld A n a ly s is U s in g t h e H e lia c C o d e
T here are various quantities th a t are m easured experim entally to identify error
held sources for a stellarator. Aside from m apping the m agnetic surfaces, m ea
surem ent can be made of the m agnetic axis position, the position and size of an
island, and the rotational transform . All of these quantities are then com pared
w ith the HELIAC code calculations and the differences are then a ttrib u te d to the
error fields unaccounted for in the model. Different sources of error often have
different signatures as explained below and in C hapter 5 Section 2.2.
One of the sources of error held in H-l is the positional error of the PFC with
respect to the TFC , particularly a planar displacem ent of the PFC centre from
the machine centre (See hgure 5.13 for a description). Since the HC is wound
around the PFC , any positional error on the PFC will also bear on the HC.
An im p o rtan t effect of this error is the shift of the m agnetic axis from an ideal
configuration. In hgure 2.9a, this is exam ined for two helical currents cases -3%
and -11%. The graph shows how the m agnetic axis at <f> = 0° would shift if the
PFC or HC is independently displaced along the y-axis by up to 5mm. The cases
exhibit the effect of this error on the up-down sym m etry of the configuration.
Looking at the error on the PFC position, at -11% the axis shift is upward while
th a t of the -3% case is downward. The axis shift due to th e accom panying error
on th e HC position is calculated separately as shown in the graph. Notice th a t
the axis due to HC positional error is sm aller and has an opposite effect for th a t
of the PFC positional error. This is im p o rtan t because axis shift contribution
from the HC error would actually com pensate for the axis shift due to the PFC
alone to about 30%. In the standard case, when the Ih = 0, the axis shift th a t
will be observed will be from the PFC error only.
In figure 2.9b, the graph is simplified to straight lines (using the PFC position
error alone) by plotting A axis(f0 - 1) showing th a t the axis sh ift(A axis) due to the
displacem ent(A y) of the poloidal field coil is known to follow,
A a ^ o c A q . (2.18)
M
A
G
N
E
a
2 3 4
ERROR along y-axis(mm)
Figure 2.9: a. Magnetic axis shift for Ih/Ir = —3% and -11% when the coils are displaced by Ay . The axis shifts are measured at d> = 0°. b. A axis (^o — 1) vs. Ay for the cases Ih/Ir = —3% and -11%. The rotational
If the displacem ent of the central conductor(P F C + H C ) described above occurs,
then a configuration near a 1/1 resonance case will result in axis shifts th a t are
easier to observe.
Identifying and m apping the different m agnetic islands is also an effective m ethod
to identify the error field sources. Traditionally, a m agnetic island can be de
scribed by its w idth defined in cylindrical geom etry [35, 3] as,
or in sim pler form as,
wmn = 4
wmn oc
T) B mr
Bo m Iji I dr
Lx 1 / 2
\ )
(2.19)
( Bmn\
d f h
1 / 2
5 (2.20)
is the local shear and Bmn(r) is the radial dependence of
B(r, 0, (f>) = Bmn(r)cos(m0 - n</> + <amn) (2.21)
where Bmn(r), is the Fourier com ponent of the radial p art of the perturbing field.
0 and 4> are the poloidal and toroidal angles, a m n is the phase angle. Replacing
r w ith the effective radius of the m agnetic surface (r), equations 2.21 and 2.20
will facilitate the investigations of m agnetic islands due to error fields.
To illu strate the apllication of equation 2.19, values of th e island w idth are ob
tained from a series of HELIAC code calculations as the 5/4 island is moved
across the configuration by varying Ih /Ir. We define the w idth of th e island,
w = rQ - rj , (2.22)
to be th e difference between the effective radii of the two m agnetic surfaces(outer
and inner) th a t envelops the resonant island. An island envelope is shown in
figure 2.10 for the case of the 5/4 resonance island. The code is used to calculate
th e m agnetic flux of the island envelope for different rotational transform values
of the m agnetic axis of the configurations, the ratio Ih /Ir is varied from 3% to
3.7%, as shown in figure 2.11a. This is the range in which a sizable 5/4 island
is present in the configurations. At less th an 3% helical current, the island is
inner envelop___ /
- 0 .0 5
o u te r envelop
-0.10
HI 2 y -1 .5 x 3.7% 1 6 /8
Figure 2.10: A puncture plot of the 5/4 island envelope for lh/Ir = 3.7%.
out of the area of interest. The steep transition or drop in the calculated flux in going from the inner side of the envelope to the outer indicates the presence of the island and the step in this transition corresponds to the flux of the island as shown in 2.11b. The island width and its local shear dependence is shown in 2.11c and d. The linear behaviour in 2.1 Id is evidence that the island width depends mainly on the shear. This implies that the radial dependence of the Bmn is weak, or in this case, has been overshadowed by the large variation in 1/shear in the vicinity of zero shear. Apart from this, the island just moves radially with the change in the rotational transform profile.
Going back to ecpiation 2.20, it is usually a very complicated task to identify the pertubing field Bmn(r). It is instructive, however, to use the result for the expansion of Bmn(r) around the magnetic axis,
Bm„(r) oc rm_l (2.23)
0 .0 7 0 ^ 0 .0 6 0 >7 3 0 .0 5 0
p 0 .0 4 0 L ü
z
^ 0 .0 3 0 ^ 0 .0 2 0
0 2 4 6 8 10 12
a. MAGNETIC SU RFACE(arb. u n it s )
a b
0 .0 0 5 0
-e 0 .0 0 4 5
0 .0 0 4 0
0 .0 0 3 5
0 .0 0 3 0
2.8 3.0 3.2 3.4 3.6 3.8 4.0
I h / l r
1 / ( l o c a l s h e a r )
Figure 2.11: (a) The calculated magnetic flux of the 5/4 island envelop for
different Ih/Ir - (b) The magnetic island flux, (c) The island width, w. (d)
with the radius of the magnetic field coils. Equation 2.20 can now be written as
/ r m —i \ 1 / 2
Wmn(r) OC ^-|d7T"J (2.24)
which gives a simple scaling law for the radial dependence of the island size.
C h a p te r 3
D ia g n o s tic s a n d D a ta - h a n d lin g
S y s te m
This chapter will discuss the m ulti-w ire detector system and th e electronics devel
oped specifically for the experim ent. The challenge in handling the 64 channels
of low-current signals, from at least 200 angular views of th e detector, was m et
by designing the data-handling electronics w ith high perform ance, high density
CMOS ICs, interfaced to a fast responding com puter. The system is tem p o rar
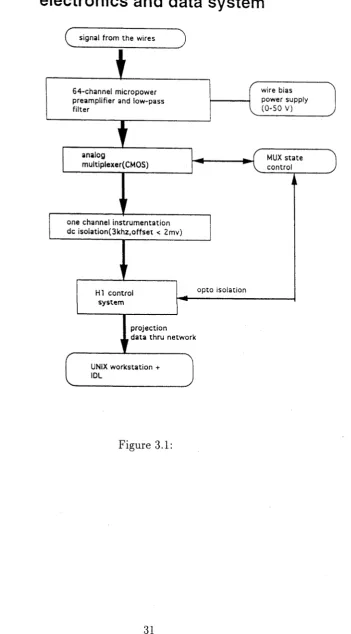
ily attach ed to th e H -l control system to facilitate initial operation (figure 3.1).
Figure 3.2 shows the toroidal positions of the detector and the electron gun.
3 .1
E le c t r o n G u n
The electron gun is a thorium -coated tungsten filam ent (0.3 m m dia) housed in
a stainless steel tube(6m m OD) w ith a beam exit hole of 0.7m m ^,Thick tinned-
copper wire(0.75 m m dia) is crim ped to hold the filam ent and is supported by
a 2-hole alum ina tube (figure 3.3). The tip of the filam ent is aligned w ith
th e beam hole for more efficient extraction of the beam during operation. The
filam ent voltage is around 1.5V and the corresponding filam ent current is 1.4A.
Block diagram of the detector
electronics and data system
c
signal from the wiresopto isolation
projection data thru network
MUX state control wire bias power supply
(0-50 V)
analog
multiplexer(CMOS)
HI control system
UNIX workstation + IDL
one channel instrumentation dc isolation(3khz,offset < 2mv)
64-channel micropower preamplifier and low-pass filter
[image:42.560.131.483.129.764.2]E-Beam Multiwire
Collector large and small
Rogowski Coils
Thomson Scattering
Langmuir Probe Visible Spectroscopy
rf b probe
Electron Gun
Visible Light
RF Antennae 8mm
Interferometer
DC and RF Rogowski
Inner
PFC+HFC
Diamagnetic Loop FIR Interteromete
2mm Microwave Polarimeter rf b probe
Figure 3.2: Top view of H-l showing the locations of different diagnostic systems. The multi-wire grid detector is at 0 = 85° and the electron gun is at 0 = 120°.
6 omm
trias
stainless steel tube
*
M
5.0 mm cross-section
thoriated tugsten
tinned copper wire
a^K
alumina tube
Gun
Wall filament
Gun wall bias ^
supply"'^
0 - 1 5 0 V
■ = - 0 - 5 V
detector
filament power
supply
Figure 3.4: Circuit connection for the electron gun.
shows the the electron gun circuit. The emission current (collected by the tube) is monitored with a, DVM during scans and held constant at values between 5 and
30 i i A and the electron beam energy is around 30 eV. At 8 /iA emission current,
the current escaping from the the exit hole ( “beam current") is estimated (from the total current in the wire-grid, adding all the wire currents, for a particular detector orientation) to be around 1.1/r A when B0 = 0.1T and the background pressure is lxlO-6 tone Under these conditions, deterioration of the filament is
a few
reduced and filament life is ~ weeks of operation.
3.2
W i r e - G r i d D e t e c t o r
The wire-grid assembly is designed to stay permanently inside the vacuum tank. It is installed in a port at (f> = 85° where the greater TFC coil spacing and clear
region and will not perturb the results, and the support frame does not act as a plasma limiter. To protect the wires from any RF induced fields, the park posi tion is shielded with stainless steel plates and the wires are connected to ground. Both the support frame and the grid frame are machined from inch-thick stainless steel. A segment, held in place by dowel pins and screws, can be removed from
f n/i-V^ \
both to allow them to be assembled,Uinking the PFC.JFigure 3.5 shows an overall view of the the detector assembly.
CD C
JZ
x
j-CD
" O
CD CD
C L_ □ D O " O
>
>— —'
Cross-sectional View
frame stainless steel
cheesehead screw molybdenum wire
teflon-coated
teflon gold-plated
inserts feedthrough
Figure 3.7: The wires are mounted by twisting it around a steel screw inside teflon inserts.
There are 64 molybdenum wires(0.15 mm-dia) in the grid used as the beam collector. These are mounted onto the grid frame using 2mm x 10 mm stainless steel screws and insulated by teflon inserts (see figure 3.7). Holes are provided in the screws to hold the molybdenum wire and the gold-plated pins that connect to teflon-insulated wires. The teflon-insulated wires are gathered and formed into a cable, shielded with a copper braid. The complete cable wraps around a series of teflon pulleys on the support frame as the grid turns.
The wires are designed to be tensioned so that small (< 1 mm) changes in their length, or in the dimensions of the grid frame as it turns, will not result in any appreciable sagging under gravity, or limpness. The latter was a significant problem in the SHEILA prototype experiment[5], producing uncertainties of up to 1 mm (3% of the plasma radius) in the wire positions caused by fractional millimetre changes in the roundness of the wire frame as it turned.
the grid is rotating or caused by other sources, and to produce a known tension in the wire. This tension causes an elastic elongation of the wire in the order of 1 mm for the longest wires, which is adequate to avoid sagging. The shorter wires are subject to smaller length changes, and therefore require less elastic elongation, keeping their resonant frequency approximately constant. To ensure that vibrational motion of the wire will not degrade the quality of the data, the grid is rotated at intervals of one second or more.
3 .3
S ig n a l P r o c e s s in g E le c tr o n ic s
The signal processing electronics includes a 64-channel multiplexer designed specif ically for the conditions of the experiment. In the SHEILA experiment, signals from each wire were handled separately with the advantage of time-resolved anal ysis which made it possible to study the time evolution of the magnetic surface during pulsed operation. In H-l, the experiment is performed in steady-state operation, therefore, there is no need to use a similar approach. Also, the larger H-l power system requires more safety precautions, and the multiplexer allowed the use of only one instrumentation-quality isolation amplifier.
There are two main requirements in processing the signal from the detector, first it must be able to amplify very low current signals and second, it should minimize unwanted noise pickup from surrounding electrical systems and from the microphonic effects resulting from the vibration of wire.
CMOS (complementary-symmetry metal oxide semiconductor) ICs are the pre ferred choice for the circuit. CMOS has the advantage over other logic devices in that it has a very low quiescent current and low power requirements. Further more, it has wide range of operating voltages(3-15V) and a very good noise immu nity so that it can tolerate input spikes up to 50% of the supply voltage without upsetting the IC [43]. Both the pre-amplifier and the low-pass filter stages of the
+he.
offset voltage (~ 6m V m ax). See figure 3.8 for the basic components of the the
a . P r e a n p l i f i e r
Input R A
1 0 0 K
o u t p u t
b . S e c o n d - o r d e r l o w
p a s s f i l t e r
C 3 leap R 1 ins Input R 2 1 M 5 'V'S/V
-X'
I
_ J T p l
if
L n C b b B C N ->8---t
•4-C 1
O U t P II t
Figure 3.8: The two basic stages in the signal processing electronics using the LMC660 IC.
3 .3 .1 P r e a m p lifie r S ta g e
The preamplifier stage is a conventional active current to voltage converter, as shown in figure 3.8a. Because of the low input impedance of this configuration, stray capacitance at the input (wire-wire, wire-shield) does not significantly affect performance. The customary compensation capacitor across R is unnecessary because of the small input shunt capacitance. An 8m long twisted-pair cable (~220pf) connected to the preamplifier input was tested and found to cause no problem. The diodes (D1,D2) are added for protection against high input voltages. Figure 3.9 shows the frequency response for three different R values; 1,
10 and 100
MCI.
It also shows the different 3db point.1
^cs
£
3 Hz 3 0 H z 3 0 0 H z
C1 4 7 nf 4 .7 nf 4 7 0 Df
C 2 33 nf 3 .3 nf 3 3 0 D f
3 df? D oint (H z) 25 2 7 5 "
d e la y tim e (m s) 130 13 1.2
Figure 3.10: List of capacitor values needed for the cut-off frequency re quired for the low-pass filter.
of 5 .6 xl0 -13 A /V H z . The datasheet shows a typical value of 2 x l0 “ lb A /(^ /H z ).
The m axim um input bias current is measured as lOOpA. Both the measured
input bias and the input noise are worse compared to their data sheet values by a
factor of 102. These big discrepancies between the data sheet and measured values
are a ttrib u te d to leakage voltage resulting from using an ordinary breadboard-
mounted circuit and inadequate shielding during the tests. Mounted in the PC
board and in actual operating conditions, the m axim um input bias current is
measured at 50pA, or an improvement of only 50%.
3.3.2
F ilter Stage
A second-order active low pass filte r, shown in figure 3.8b, is used to obtain a
40dB/decade rolloff. The Bessel filte r design is chosen for better overshoot sup
pression. The gain of the filte r is set at unity. Table 3.10 shows the different
PirwM DHz com ponooi values
247kHz
« VJÜÜM, 1*TJC Itrv^g - SAAPMN1I1A8SN jvrprrtrw I Filter: DO Hz com pooem values
25 Hz
247kHz
Fitter DOOHz component va)ues
275 Hz
500kHz
iMjrnpnL* * I S toqBtcp» l#7 d l » >
140 »Wing . BAAPI1N1l1AftSW»/*A.d**rTprT*rwl*.Sfr»Q*i»W 1*1 frvqBtcp-1#7 dMO.-Z Htm»- I » I ^
Ik Ifcfc ICrOlC (
-ft^ojU eK C tj (V i 2,^
Figure 3.11: The frequency response of the filter stage.
3 .3 .3 M u lt ip le x e r S ta g e an d C o n tr o l B o a r d
A E u ro c a rd system is used in the final PC board layout of the electronics. Eight
boards each carry 8 channels of d ata input and contain one 8-input m ultiplexer
IC, CD4051B. The m ultiplexer has three binary control inputs, A, B, and C and
an inhibit input. The inhibit input is used to select the appropriate input board.
See figure 3.12.
The control board contains the decoder(CD4556B) for board select. A binary
counter(CD4040BM ) is included and together w ith a single shot and continuous
trigger allows for independent operation checks. A ctual control is done externally
using 6 binary outp u ts from the H-l d a ta control system . (See figure 3.13.) The
control board also carries the power supply isolated to about lkV .
3.4
D a ta C o n tro l S y ste m
The d a ta acquisition system was adapted to the H -l control system to facilitate
the initial run of the experim ent but in the longer term , a real-tim e signal pro
cessor with much greater throughput will be used for control and data-handling.
The m ultiplexer used 6 binary outputs from this control system and the m u lti
plexed o u tp u t is recorded using an ADC input m odule . The d a ta sam pling rate
during the experim ent is ~ 100Hz or 64 sam ples/600 ms.
The m otor used to tu rn the grid is run by the o u tp u t from 4 channels of the
DAC m odule and through a simple circuit composed of power transistors. Micro
stepping the m otor is achieved by applying sinusoidally-varying signals to the
m otor coils in qu ad ratu re phase. The power supply delivers around Imax = 3A to
each coil. By using the signal from the DAC m odule, m icro-stepping is achieved
at 1500 step s/rev of the m otor or in 0.24° steps. The m otor step ^enojachieved is
5ms. This arrangem ent was adopted to solve the problem of the jarring effect of
the m otor drive on the wire-grid frame if a conventional four phase “square-w ave'
mdwi 3a
• 3 3 3 3 i
i ' i * t • t
; : i i ■
L Oi X a .
<• i ---1 33« 2 J3« •--- o a w > sC v N ' » ‘ £ * s s ;
N * < U H H "
— ji" 3 H H "
; s ■£ i s * < u i <■u
H H " H H 1'
— ( N n ^ ki ^ i r ' ( L
o o o o o o o o 1 3 E
? 1 ? i Si 2
'• y \ b * i sj/ \J/'i
Q
K
o <r
z o
0 CQ ♦j
k
a, u j x w D J
1 Q.
H
CO J N 3
V E
5 5
* !
V ▼
-5f N
^7 \gs=HSsJ
^ z\5f4= s-<: 55
ix?*5f N( V
»«! »l| H H " . i f =5
_ H i— li"
I 5 , J 5|4=2s| 55:i
H H "
= f N I (_ ° ® NU> < J
n r/ u
M J 5 H m c / u x . ,
O) 1 ff' ui { u
2 5 * S 5 <
" £ /
“5 <■ 2 ^
to 10
2 5 /
P
'U<« =p <5 <J * 5 j
ü T * < n » J
i t = 5 A
* 2 <! : s <;
i “71
+V-i ___m — ; rsM H" ~H»J S w r
s i i
°g :
u T « H S !
u*_iA ,
Att-AAt-J
I 3psu__
' IN
IS "■■"aW • ~
2
i
i C i
H si
\ \ \' i
I c*-f* ' !Skl It
H “ j I
vÄ X < N ® /
X © ■
1* - ♦ „2 ~ - i
F igure 3.12: 4/8 circuit diagram of the the multiplexer board. Each chan nel consists of one preamplifier and low-pass-filter stage. One board carries a CD4051B multiplexer to handle the signals from the eight channels.
:> z>
in m
+ I
3 - o e i Q S p a e o g
a o x o i n U
N n f U 3 \ f l r - ( 5 ( > 0 - ' M
BQ ®
O O O O O O O
w e i s f i ' s
I O J >u o3 _ - [h w o a j
Figure 3.13: Circuit diagram of the control board showing the power sup ply and internal trigger system.
P
C
7
4
H
C
/H
C
T
1
3
[image:57.560.54.504.27.668.2]C h a p te r 4
M a p p in g V a cu u m M a g n e tic
S u rfa ces an d T o m o g ra p h y
This chapter will discuss the approach taken in the tom ographic inversion of
th e projection d a ta from m agnetic surface m apping using the rotating wire-grid.
Some concepts basic to understanding the technique are introduced. The recon
struction technique is outlined and described. The results of the inversion of
sim ulated d a ta will be analysed to assist the understanding of the properties and
lim itations of the technique.
4.1
B a s ic c o n c e p ts
The approach of sam pling the electron beam using a grid of thin conductors is
analogous to taking projections or line integrals along the wire ("fline of sight” ),
and has naturally led to the adoption of tom ographic techniques in analysing
th e m aps of th e vacuum m agnetic surfaces. In some ways, the images created
from this approach are not very different from those of th e fluorescent technique
because in the la tte r a CCD cam era is routinely used for acquiring images which
also digitizes the images^. The resolution is not only lim ited by the fluorescent
*1
r \ T
W i
Figure 4.1: The wire-grid detector is at three different orientations. The source S is shown and the shaded circle indicates the area wherein a signal is detected when the wire intersects it.
the tomographic technique is that the pixel size of the reconstruction grid can be made very small. In this section, some concepts developed in tomography (primarily in medical imaging and radio astronomy) relevant to the problems in this experiment will be introduced and discussed.