This is a repository copy of Rail Privatisation: The Practice – An Analysis of Seven Case Studies.
White Rose Research Online URL for this paper: http://eprints.whiterose.ac.uk/2158/
Monograph:
Shires, J.D., Preston, J.M., Nash, C.A. et al. (1 more author) (1994) Rail Privatisation: The Practice – An Analysis of Seven Case Studies. Working Paper. Institute of Transport Studies, University of Leeds , Leeds, UK.
Working Paper 420
[email protected] https://eprints.whiterose.ac.uk/
Reuse
See Attached
Takedown
If you consider content in White Rose Research Online to be in breach of UK law, please notify us by
White Rose Research Online http://eprints.whiterose.ac.uk/
Institute of Transport Studies
University of Leeds
This is an ITS Working Paper produced and published by the University of Leeds. ITS Working Papers are intended to provide information and encourage discussion on a topic in advance of formal publication. They represent only the views of the authors, and do not necessarily reflect the views or approval of the sponsors.
White Rose Repository URL for this paper: http://eprints.whiterose.ac.uk/2158/
Published paper
Shires, J.D., Preston, J.M., Nash, C.A., Wardman, M. (1994) Rail Privatisation: The Practice – An Analysis of Seven Case Studies. Institute of Transport Studies, University of Leeds. Working Paper 420
UNIVERSITY OF LEEDS
Institute for Transport Studies
ITS
Working Paper
420July
1994ISSN 0141-h'(l?l
RAIL PRIVATISATION: THE PRACTICE
-
AN ANALYSIS OF SEVEN CASE STUDIES
J
D Shires
J
M Preston
C A Nash
M Wardman
This paper was undertaken as part of an ESRC project on the effects of rail privntisrrtion.
CONTENTS
ABSTRACT
PAGE
1. INTRODUCTION 1
2.
THE
PROPOSALS CONTAINEDIN
TKE
RAILWAYSACT
1993 32.1
A
General Overview3. RAIL PRTVATISATION ELSEWHERE
3.1 Introduction
3.2 Argentina Railways
3.2.1 Introduction
3.2.2 Results
3.2.3 Summary
3.3 Germany
3.3.1 Introduction
3.3.2 The Restructuring Proposals
3.3.3
Main
Issues of The Restructuring3.3.4 Results
3.4 Japanese Railways
3.4.1 Introduction
3.4.2
The
JNR RestructuringAct
1986 3.4.3 Results3.4.4 Summary
3.5 Netherlands
3.6.1 Introduction
3.5.2
The
Government's Proposals3.5.3 Conclusions
3.6 New Zealand Railways
3.6.1 Introduction
3.6.2 New Zealand Railways Corporation
3.6.3 New Zealand Limited
3.6.4 Results
3.6.6 Summary
3.7 Swedish Railways
3.7.1 Introduction
3.7.2 The Transportation Act 1988 3.7.3 Financial Arrangements
3.7.4 Franchising
CONTENTS
3.8 Amtrack
3.8.1 Background 3.8.2 Amtrack 3.8.3 Results 3.8.4 Summary
4.
CONCLUSIONS
APPENDIX ONE
REFERENCES
ABSTRACT
After a brief description of the proposals for rail privatisation in Great Britain, this paper contrasts these with the proposals and experience in other countries around the world.
The proposals and experience in other countries contain some elements of the British proposals, however, the 'open access' element that features strongly in the British proposals has never been experienced on any significant scale elsewhere.
1.
INTRODUCTION
In July 1992, the British Government published a White Paper, 'New Opportunities for the Railways'. This outlined the government's proposals for the privatisation of and introduction of competition into British Rail (BR). Over a year later and after considerable discussion the Railways Act (1993) has been enacted and took effect from the 1st April, 1994.
The Railways Act (1993) can be viewed as the culmination of government policy, which during the past 10-15 years has sought to reduce its subsidy payments to BR through improvements in productive efficiency and placing emphasis on commercialisation within the BR organisation.
This policy resulted in a total reorganisation of BR from a regional basis t o a sector basis. From 1962 to 1982 BR was organised on a regional basis, with each region responsible for a variety of services. Some services that exhibited economies of scale, such as procurement and finance, were centralised. This organisational structure made allocating responsibility for revenue, subsidy and costs a very imprecise process. There was also a separation of the commercial and the operating roles of management, right up to the Chief Executive level.
In an aim to improve the accountability of services, and managers, BR was reorganised into five sectors, Intercity, Regional Railways, Network Southeast, Freight and Parcels (see Castles, 1993). Staff and assets were made sector specific, although operations were still carried out by the operating department. The two main advantages of this organisation (see Nash & Preston, 1993) were (i) i t made possible the definition of much clearer lines of managerial control and (ii) every manager had much tighter control over assets and so increased accountability for both his own and his sector's performance.
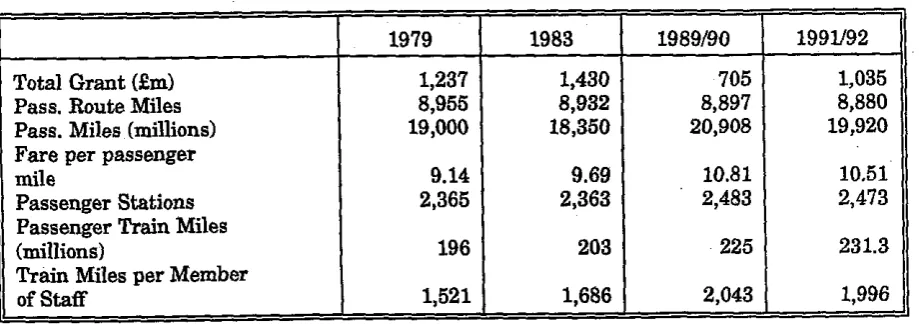
[image:7.622.94.554.560.722.2]This policy, coupled with government cuts in subsidy throughout the eighties, has resulted in a n impressive improvement in both BR's productive and commercial performance, as illustrated by Table 1.1.
Table 1.1: BR Performance 1979-1991192 (1991/92 prices)
Source: British Railways Board, AMual Reports and Accounts
199U92 1,035 8,880 19,920 10.51 2,473 231.3 1,996 1989190 705 8,897 20,908 10.81 2,483 225 2,043 Total Grant (Em)
Pass. Route Miles Pass. Miles (millions) Fare per passenger mile
Passenger Stations Passenger Train Miles (millions)
Train Miles per Member of Staff
Without wishing to dwell on Table 1.1, it can be seen that BR has succeeded in significantly reducing its total grantlsubsidy throughout the eighties with only a slight reduction in the passenger network. The main reason for BR's improvement in performance is rooted in staff productivity, which grew by 34% between 1979 and
1989190. The start of the recession in 199011 and the increased concern over safety reduced the gains achieved, but the overall performance was still impressive. Proponents of privatisation felt such an improvement gave an indication of potentially larger productivity gains from the full scale privatisation of BR.
This opinion was reflected by the government, who felt that BR could improve both productivity and financial performance. It ultimately envisaged BR, or a large part of BR, surviving on no subsidy and making a commercial rate of return on its assets, see Foster (1994). This, together with the European Commission directive 911440 and Council Regulation No 1893f91,
(1) Member states must establish separate accounts for infrastructure and for train operations.
(2) Operating companies providing international rail passenger transport are to have transit rights over Member States railway networks by the 1st January,
1993.
2.
THE
PROPOSALS
CONTAINED
INTHE
RAILWAYS
ACT
1993
This section presents a general overview of the proposals, for a comprehensive account of the proposals see Shires et a1 (1994).
2.1
A
GENERAL OVERMEW_
*Rather than privatise BR as a vertically integrated company, the government has split BR into two parts, infrastructure and operations. The provision and operation of rail infrastructure (track, simalling etc
...
) becoming the responsibility of Railtrack. Initially, Railtrack will rema& in the public sector, but is still expectkd t o act as a commercial organisation, recovering its full costs and earning a rate of return (5.6% initially, but e;entually 8%) from charges it levies on operators. It is envisaged that Railtrack will eventually be privatised. Railtrack's other responsibilities include arranging the maintenance of the infrastructure, monitoring ofon-track safety and the timetabling of all services across the network.By creating Railtrack the government has retained the infrastructure as a natural monopoly and eradicated the 'sunk cost' element it would otherwise represent for new entrants into the rail market. The government sees this reduction in an entrant's 'sunk costs' as a vital ingredient for allowing competition on the railways. Entrants' 'sunk costs' will be reduced even further with the creation of Rolling Stock companies (ROSCOs), that will offer a range of rolling stock for operators to lease.
On the operating side, both the Freight and Parcels divisions will be sold outright. Trainload Freight and Railfreight Distribution's Contract Services division will be formed into three new competing companies organised along geographical lines based around a North East, South East and WesffScotland division. Each division will have access to its own maintenance depots and rolling stock, and will not be local monopolies. The divisions will have t o negotiate with Railtrack for 'paths' and will immediately face 'open access' from other freight hauliers.
Railfreight Distribution's European business will be managed through the start-up phase by BR and privatised as soon as possible, once the key Channel Tunnel freight services are established. The government is also inviting proposals from the private sector to participate in the Freightliner network (existing losses prohibit outright privatisation). The Parcels sector will be privatised as two separate parts, Red Star and Rail Express Systems (an attempt to sell Red Star has already failed).
their franchises, whilst on loss-making routes the 'lowest subsidy offered' will be the criterion. However, the latest set of infrastructure charges published by Railtrack make all routes loss-making (with the possible exception of Gatwick). Any franchise not let will continue to be operated by the British Railways Board (BRB).
OPRAF will then have to negotiate a contract with Railtrack, for paths and the appropriate charges for the new franchisees. From April (1994) the TOCs have operated as independent subsidiaries of BR. By the end of 1995 the first franchises will come into existence. Rather than franchise the whole network together, the government has earmarked six 'shadow franchises' to form the first wave of
franchises. These comprise: 'Gatwick Express', 'London, Tilbury and Southend', 'South Western', 'Scotrail', 'East Coast Mainline' and the 'Great Western'. The new railway system will also incorporate an 'open access' policy. This will allow other operators (possibly other franchisees) to operate services on any section of the network, providing they satisfy all the regulations set down by the Regulator (including safety) and have negotiated 'access contracts' with Railtrack. However, it is envisaged that 'open access' will be delayed for two years to allow rail franchisees t o overcome initial stumbling blocks, a so-called 'honeymoon period'.
The final player in the government's Railways Act 1993 is the Regulator, whose general duties are outlined in section four of the Railways Act 1993. These duties include:
(I) Competition and Access
-
The Regulator must ensure that Railtrack does not abuse its monopoly position and does not discriminate between different train operators. As such all access agreements will be subject to his approval and constant monitoring.(2) Licensing and Closure -All operating licenses are issued by the Regulator who will have to be satisfied that the operators are 'safety validated' and properly insured. The Regulator will also have responsibility for the closure of lines, attaching conditions to closures in certain circumstances.
3.
RAIL
PRIVATISATION ELSEWHERE
3.1 INTRODUCTION
This section examines rail privatisation elsewhere in the world and tries to draw some parallels with the proposed rail privatisation in the UK. In all, six privatisatione and proposed privatisations are examined, namely Argentina, Germany, Japan, the Netherlands, New Zealand and Sweden. In addition, the experience of AMTRACK in the US, a s a publicly owned passenger operator using private infrastructure, is noted. The examples cover a wide range of railway types, so in many cases we are not comparing like with like. However, a number of lessons can be drawn from these examples which can be applied to rail privatisation in the UK.
3.2 ARGENTINA
RAILWAYS
3.2.1 Introduction
Until 1989, railways in Argentina operated as a nationalised industry (Ferrocariles Argentinos, FA) organised into six main divisions. This organisation was the result of a variety of government and business constructed railways, that in 1946147 were nationalised by the Argentine government.
Despite large reductions in route-kms and staff, from 45,000 km to 29,000 km and 210,000 staff to 85,000 staff, by 1989 the railways were reaching a crisis. Market share was around 8% of the freight and inter-city passenger market and government subsidy was £212 million (revenue contributions) and £150 million (capital expenditure). Over half the locomotive fleet was unserviceable, with 50% of the routes subject to speed and axle restrictions.
To arrest the decline in performance the government of President Carlos Menem, a t the instigation of the World Bank, decided in 1989, to offer franchises for the operation of freight services over large areas of the rail network. The infrastructure and rolling stock were to remain in the ownership of the government, whilst a government regulatory authority and a n independent safety authority were
to
be set up. The elements of the franchising are,(a) The franchisee rents both the infrastructure and rolling stock from the government during the franchise period, at the end of which the government retains possession. The franchises are for 30 years with 10 year renewal options.
(b) The only operating obligation on the franchisee is one of maximum charge level (still a high level). Also included in the bid is a proposal for investment over the franchise period
and
a n obligation to maintain infrastructure in operating condition.(d) If the franchisee rescinds on his contract he will lose a guaranteed amount, but will recover the current value of investment, minus a share of 40% to 50%, as unique indemnification.
(e) The franchisee must allow 'open access', for which they will receive a payment.
The franchise is awarded using a points system, which awards points after considering the previous experience of the franchisee, the proposed investment, the number of railwaymen to be absorbed
and
the amount bid for the franchise.There are no explicit subsidies being offered but low charges for both infrastructure and leasing mean a n implicit subsidy is on offer, which according to Muller (1992) is,
"..equivalent to more than 40% of annual revenue."
The overall franchise strategy was reached after consultation with the World Bank, who besides advice also gave US $300 million in loans towards restructuring the rail system. Apart from the franchising of freight services the other planks of the policy were.
(a) Separation of passenger services into commercial and socially necessary services.
(b) Creation of a Buenos Aires Metropolitan Transport Authority to coordinate commuter services to the region.
(c) Reducing staff levels and reforming working practices.
(d) The setting up of a property unit for the sale of excess assets.
3.2.2 Results
Of the six franchises on offer only one, the Belgrano line, has received no bids. The other five have either been franchised out or are having bids assessed. The majority of the franchiseeshidders are consortia with only limited experience of.large-scale rail operations. The exception to this rule being Canadian National and Conrail who form part of the consortium running the Roca system and the Urquiza line respectively.
As regards passenger services, only the Buenos Aires
-
Mar del Plata route is considered profitable, with four bids being considered. Routes outside of metropolitan areas will be offered to provincial gwernment to run. If the provincial government declines the service will be closed. The suburban services serving Buenos Aires will be franchised, with the key measure being the 'lowest subsidy' bid.3.2.3 Summary
must be questioned given the implementation time period of three years and the limited experience of the franchisees.
Both Muller (19921, and Ridley and Terry (1992) predict operational cost reductions because of a change in ownership. They also forecast a shift towards an American-
style trunk-haul operation and the resultant closure of unprofitable routes and reduction in staff.
The crucial element will be the level of investment by both the government and the franchisees. No doubt investment to maintain present operations and standards will take place, but whether the investment necessary to promote strong traffic increases will take place is a different matter. Given the state of the present track and the cost of upgrading it, a scenario of private railways continuing until great investment is unavoidable after which franchises are returned to the government, is not unforeseeable.
3.3 GERMANY
3.3.1 Introduction
Before January 1 1994, German railways came under two national organisations, Deutsche Bundesbahn (DB-former West German railway) and Deutsche Reichsbahn (DR-former East German railway), both operating in their former territories. They now operate under the same banner, Deutsche Bahn AG (German Rail plc), and have been split into a n entrepreneurial area (responsible for train operations) and a public
sector area (responsible for non train tasks), destined to be privatised.
This reform process is rooted in the final report of the governmental railway commission presented in December 1991. The commission, set up in July 1989, was initially intended to examine the future of DB, but was extended to include DR with the fall of the Berlin wall later that year. The commission noted two main points,
(1) DB's market share was 6% of the passenger market and 23% for the freight market. DR's market share was greater, but due to increased availability of lorry and car, was declining fast.
(2) Low investment in DR, the result of a weak economy, means that DM100 bn may have to be spent to restore the DR network to reasonable condition.
It concluded that if change were not implemented then government subsidy would reach unbearable levels within 10 years.
3.3.2 The Restructuring Proposals:
By January 1,1994, the two railways had merged into one Federal Railway Property, which itself was divided into two separate areas with responsibility for their own budgetary and accounts;
(1) An Entrepreneurial Area
-
consisting of all transport and related businessactivities, and infrastructure management, construction, operation and maintenance.
(2) A Public Area
-
consisting of all the state tasks formerly handled by DB and DR, the administration of the debts of the single Federal Railway Property, the administration of land holdings not required for rail operations and the administration of DB staff who remain civil servants.After January 1, 1994, the entrepreneurial area became DBAG, a public limited company with share capital, owned wholly by the Federal Government and divided up into three business sectors; passenger; business; infrastructure, a t regional level. That is to say that the 15 regional headquarters of DBAG will be organised on a
sector basis.
Another organisation will be created, a Federal Railway Office, to handle state tasks such as approving construction plans for a new railway line. The rest of the public area will remain in the Federal Railway Property.
By 1997, the government envisages the three business sectors of DBAG being transformed into public limited companies, allowing the participation of third parties. DBAG would therefore act as a holding company until 2002 when it is envisaged that the three sectors would become fully independent, with their shares offered for sale to the public.
3.3.3 Main Issues Of The Restructuring:
(i) Article 87
This article of the basic law required railways to be part of the federal administration, so preventing even a formal privatisation. This has since been modified to enable restructuring to commence.
(ii) Civil Servants
The result has been DBAG taking over only those employees necessary for its operations, with the remaining civil servants remaining with the Federal Railway Ofice and Property. Three remaining mechanisms will be used t o adapt the civil servants terms and conditions, see Railway Gazette International (July 1993). These are:
(a) Voluntary surrender of civil service status a t their request.
(b) Suspension of civil service status for a given time, in which there will be a normal employee relationship with DBAG.
(c) Secondment of the civil servant to DBAG, which would pay the Federal Railway Property only the salary of a normal employee under market conditions.
(iii) Debt B u r d e n And Investment
The historic debt of both DB and DR was forecast to reach DM70bn by the end of 1993. The Federal government recognised that DBAG could not sustain this level of debt for long and released both DB and DR not only from their historical debt, but from liabilities attributable to excessive staff, and from obligations arising from environmental responsibilities. In addition the government has also accepted responsibility for the DMlOObn worth of investment necessary to reconstruct DR. -
DBAG has been released from the restrictions imposed by public service and budget laws. The company's assets have been revalued a t around 22% of their present DBDR level, and DBAG was launched with no capital debts.
(iv) Regionalisation
This process removes the power to determine local rail services and the responsibility to finance them from a national to a regional level (to state governments known as Lander). This is a key feature of the restructuring process, see Ridley and Terry (1992). Previously, the Lander were a powerful lobby for the retention and improvement of rail services, payment for which came from Federal funds. Now the Lander have to set a service level and enter into a contract with a railway operator. Three scenarios have been discussed:
(a) The Lander arrange for DBAG to run local or regional train services, specified on a contract basis.
(b) The Lander establish their own rail operating subsidiary to operate on DBAG's lines.
(c) The Lander purchases lines from DBAG, and then lease them to third parties via municipal corporations.
plus the continuation of the Geimeindeverkehrsfmanzierungsgesetz (GVFG), around DM6bn a year, for joint Federamander investment in local and regional transport projects. This amount is seen as unacceptable, especially given Heinz Durr's (Chairman of DBAG) statement that the DM6bn paid to DB and DR in 1993 would be sufficient for DBAG to maintain regional services, given the expected cost reductions in DBAG's operations.
To placate the situation, the Federal government is to continue funding DBAG directly for regional rail services till a t least 1995, when regionalisation will be examined again.
(v) Open Access
In principle, any domestic rail operator or foreign operator (providing open access is reciprocated in their country of origin) can run trains over the German rail network. Access price charging is envisaged as adopting a market approach, with charges set according to 'revenue potential' on the line; the quality of service demanded; wear and tear inflicted upon the track; the relevant competitive position and the amount of excess capacity on the network.
The Lander have expressed their wish to see fxed infrastructure user charges. However, DBAG see this lack of charge flexibility as reducing the scope for efficient,
market led infrastructure management.
(vi) Paying for the Infrastructure
A decision made by the Federal Government on February 17 1993, established an obligation for the Federal Republic to contribute financially to investment in infrastructure. DBAG will pay back investments financed by the Federal government up to the amount of depreciation that both parties consider to be necessary, (Railway Gazette International July, 1993). For lines considered indispensable, DBAG will borrow in the capital markets.
The Lander feel that, over all responsibility for infrastructure investment should rest with the Federal government, preferring the government rather than DBAG to retain ownership of the infrastructure.
3.3.4 Results
3.4
JAPANESE
RAILWAYS3.4.1 Introduction:
Japanese railways were reorganised in 1949 with the creation of the state-owned corporation, Japanese National Railways (JNR) operating a nationwide network of about 21,000 km. In addition to JNR there are 15 major private railways and 161
smaller railway operators in Japan. The private railways are to be found in the A
metropolitan areas where high densities of commuter traffic make them quite profitable and non-rail opportunities such as property development exist.
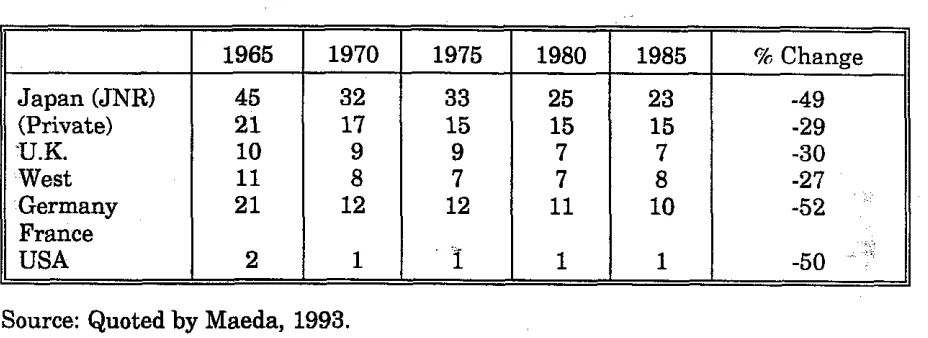
Railways have always played a n important role in Japan, more so than in other first world countries, see Table 3.1,
Table 3.1: International Comparison of Rail's Share of Passenger Market
Source: Quoted by Maeda, 1993.
Japan (JNR) (Private)
'U.K.
West Germany France USADespite suffering from a 42% fall in ridership, in absolute terms railways in Japan are still extremely important. The main reasons for such a strong use of railways by passengers have been identified as high population densities, the issuing of 'commuting passes' by Japanese firms, until recently a poor road network (due to the mountainous terrain) and low levels of car ownership. The development of the high speed Shinkansen network in the 1960's has also contributed to JNR maintaining relatively high passenger market shares e.g. the Shinkansen carries over 90% of passenger demand
in
the inter city urban market between Tokyo and Osaka (560km).
In contrast JNR's share of the freight market fell considerably from the 1960's
onwards, see Table 3.2.
1965
45 2 1
10 11
2 1
2 1970 32 17 9 8 12 1 1975 33 15 9 7 12
i
1980 25 15 7 7 11 1 1985 23 15 7 8 10 1r/, Change
[image:17.602.69.533.269.438.2]Table 3.2: International Comparison of Rail's Share of Freight Transport Market 96 in Tonne Kh4
1965 1970 1975 1980 1985 % Change
Japan (JNR) 30 18 13 8 5 -83
(Private) 1 - - -
-
-U.K. 21 19 15 12 12 -62
West 34 33 26 25 25 -26
Germany 44 37 35 32 3 1 -30
France 43 40 39 38 37 -14
USA
Source: Quoted by Maeda, 1993.
The main factor operating against rail in the freight market is the fact that being an island country, most raw materials are imported. The most efficient mode is therefore ship and as a result the majority of heavy industries are located on or near the coast.
Despite the favourable conditions for passenger traffic, by the 1980's JNR was reaching a financial crisis point. The result of which was to be the complete restructuring of JNR in 1986.
3.4.2
The
J N R Restructuring Act 1986:Background:
Table 3.3 sets out the financial performance of
JNR
from the 1960's (all figures in Billion of yen). From 1964, when JNR recorded its first deficit, JNR's financial position grew steadily worse. The annual deficit was 123 billion Yen in 1965 and by [image:18.599.67.572.79.271.2]Table 3.3: Financial Performance of JNR
Note :
,
Total of subsidy between 1949-67 : Numbers in 0 represent minus: All figures are expressed in money term of each year (in billions of Yen)
Source: Quoted in Maeda, 1993 Year Total Revenue Passenger Freight Miscellaneous Subsidy Total Cost Staff Material Interest Depreciation Other Net Profit Long Term Debt Total Subsidies
No. of Staff (000's)
Further financial pressure resulted from overstaffing, with staff levels of 469,693 in 1966 and 276,774 in 1985. This resulted in staff costs of some 2,300 billion Yen in 1985, or some 70 % of operating revenue. Together with a 'gold plated' pension scheme, labour costs were pushing JNR further and further into fmancial crisis.
Another factor increasingly blamed for the financial crisis was that of 'weak management'. After the first recorded deficit in 1964, JNR's management team tried to improve and recover its financial performance through a series of reconstruction plans. In total five reconstruction plans were followed, all of which were unsuccessful and abandoned on the way. The continuing theme of these plans was to aim for a balanced budget through a combination of increased fares and increased traffic, with a n element of government debt support in some of the plans. However a combination of adverse public opinion, weak government support and strong unions (failure of Productivity Improvement), ensured that these plans were never successful.
1970 1,146 846 254 33 12 1,297 573 374 152 202 (3) (152) 2,604 12 460 1965 634 412 198 238
-
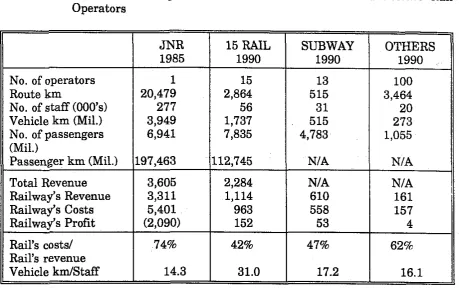
757 310 231 65 153 0 (123) 1,110 141 462The final factor that led to the reorganisation of JNR was the financial performance of the private railways, see Table 3.4.
Table 3.4: Financial and Operational Performance of JNR and Private Rail Operators
Note: 15 Rail represents the 15 biggest private railways. Revenue and costs are actual results.
Only JNR's results are for rail operations only, the others include non rail contributions.
No. of operators Route km
No. of staff (000's) Vehicle km (Mil.) No. of passengers (Mil.)
Passenger km (Mil.)
Total Revenue Railway's Revenue Railway's Costs Railway's Profit
Rail's costs/ Rail's revenue Vehicle km1Staff
Source: Quoted by Maeda, 1993.
The apparent financial viability of the private railways and higher labour productivity led for calls from the government and the public for increased productivity from JNR and financial viability via reorganisation of JNR. This opinion was slightly biased given that private railways gained over half of their profits from the hotels, department stores and real estates that they have developed around their railways (see Table 3.5).
JNR
was prohibited from these activities by law.JNR 1985 1 20,479 277 3,949 6,941 197,463 3,605 3,311 5,401 (2,090) 74% 14.3
15
RAIL
1990 15 2,864 56 1,737 7,835 112,745 2,284 1,114 963 152 42% 31.0 SUBWAY 1990 13 515 31 515 4,783
NI A
Table 3.5: Private Railways Revenue Breakdown
Source: Ridley and Terry, 1992
For a very detailed look a t the implications of the act and the reasons for the proposals contained in it see Maeda (1993). In this section I will present a more summarised version. The overall purpose of the act was to remove the special position of Japanese railways in law and government. Instead of having a n object to, 'improve the welfare of the general public' its new mission was to, 'respond to market needs and establish effective management'. As a direct result of this the JNR was separated from the civil service; government responsibility for the construction of new railways was taken away; no specific legislative approval was required for fare rises. JNR was fully capitalised by the government who will eventually list the stocks on the Tokyo Stock market. However, up to press only JR East has been sold, but for all practical purposes JNR has been privatised.
establishment of a truly freelindependent management (2) restructuring the railways into regions as opposed to the national organisation that existed a t that time.
Table 3.6: Traffic Forecasts
Source: Quoted by Maeda, 1993
."
The blue paper identified several reasons for managerial underperformance within JNR. Firstly the strict regulation of JNR and its image a s a 'public good' resulted in delayed fare changes and the construction of unprofitable lines, which went against management judgement. Secondly, lack of managerial independence in all aspects of operations including wage negotiations led to ambiguous management and low morale. Thirdly, the restriction placed on JNR as regards development of retail business and real estates severely restricted the opportunities open to JNR.
a) Forecast Total all ra~lway JNR Commuter Non Commuter ~ncludlng Shznkansen Pnvate rallways Cars
h r s Ship
b) Results
Total all rallway JNR Commuter Non commuter Including Shlnkansen Private rallways Car Air Ship
The nationwide organisation also received wide criticism in the blue paper. Problems it identified included diseconomies of management, excessive cross subsidy that distorted information on costs and revenues, a lack of incentive to compete with other transport modes and a lack of competition between JNR managers themselves. The blue paper suggested that a structure of regional privatisation would create more responsive operations. 1) 1990 Demand 921430 317833 185114 79879 55564 49671 132719 554737 43557 5303 1) 1975 Demand 710711 323800 215289 75985 85986 53318 108511 360868 19148 6895
Share %
34 20 9 6 5 14 60 5 1
Share %
46 30 11 12 8 15 51 3 1
% change
199011983 112 99 96 102 87 98 103 120 142 93 2) 2000 Demand 977688 308854 180289 75071 50198 55020 128565 609800 54307 4727 2) 1983 Demand 821963 321452 192906 78687 63799 50440 128546 464162 30627 5722
Share '2
32 18 8 5 6 13 62 6 0
Share %
39% 23% 10% 8% 6% 16% 56% 4% 1%
r;l change
The implementation of the JNR Restructuring act has followed the blue paper proposals very closely. JNR has been split up into six geographical operating passenger companies (Hokkaido, Shikoku, Kyusyu, East Japan, Central Japan and West Japan). These are vertically integrated companies and are known as JR's. Each area has been designed so that between 95-98% of traffic completes its journey within each area. A nationwide freight company has been set up, the Japan Freight Railway Company. This only owns 80 km of track and rents access space from passenger companies, the rental fee being calculated on the basis of avoidable costs. The freight structure is national rather than regional because the government felt greater co- ordination was required with other modes at both ends of the feeders and because some 60% of all freight traffic crosses the border of passenger companies.
Also hived off into separate companies have been research and development (RTRIF), Railway Telecommunications (RT) and Railway Information System (RIS).
A JNR Settlement Corporation (JNRSC) has been set up and is legally responsible for the re~avment of most of JNR's long term debt and the relocation of redundant staff. Out of &e 25.6 trillion Yen of long tern debt attributed to JNRSC, 2.9 trillion yen are assumed to be reimbursed from the Shinkansen Holding Corporation (SHC), 7.7 trillion from the sales of JNR owned non railway real estates and the 1.2 trillion Yen from the sale of JNR stocks. The remaining 13.8 trillion yen will be borne by the government.
The SHC, referred to above is a government agency which owns the infrastructure of the Shinkanson and leases out these lines to the three operating companies through which they run, for 5.7 trillion yen. It also is responsible for the JNRSC 2.9 trillion Yen of long term debt.
Onlv three of the JR's are ~rofitable. namelv JREast. JR-Central and JR-West. This is kainly due to their running throigh t h e k o s t densely populated areas and feeling the benefit of staff reductions and improved management. This improvement in profitability prompted the three companies to buy the; sections of shinkinsen, though a t a price that represents their commercial worth not their book values.
The other three JR's receive financial help from two sources, the Three Islands Companies Fund' and the Management Stabilising Funds (MSF). The former is specifically to help with investment and was set up by the government in a political deal termed 'consolation money'. The MSF is a direct subsidy to supplement the revenues of the three Islands. The fund is in the form of the debt of JNRSC to the three island companies, totalling some 1.3 trillion Yen: 682.8 billion Yen to JR Hokkaido, 208.2 billion Yen to JR Shikoku and 387.7 billion Yen to JR Kyusyu. The debt will be repaid
to
each company in 10 years a t an annual interest rate of 7.3%. Only the interest accruing from the fund will be used to supplement the revenue.For new stations the share is 50% 25% and 25%. Subsidy for other Inter city projects has to be negotiated on a case by case basis.
3.4.3
Results
A thorough breakdown of the results are presented in chapter four of Maeda, but a
summary of the main results can be found in Table 3.7.
Table 3.7: Key Financial and Operational Indices of J N R
- -
Source: Quoted in Maeda, 1993
The results are impressive for both freight and passenger traffic but especially for passenger. Revenues for passenger tr&c have risen 46.6% from 1984 t o 1991, whilst costs have fallen by 24.4% during the same period. Another significant figure is the number of staff, falling by 45.2% to 138,901. However, it is important to point out that strictly speaking we are not comparing like with like here. A change in the product mix and concentration on key corridors has resulted in some low profit lines being withdrawn and others opened up. When looking a t the number of staff, it should be borne in mind that these reductions in staff numbers have been brought about partly by sending staff to subsidiaries and affiliated companies. This 'making best use of redundancies' is common practice in Japan, and by no means is confined to the railway industry only.
Revenue Costs Traffic units Train km
No. of staff Staff costs
% change
46.6 -24.4 27.2 32.8 -45.2 -33.0 Passenger
1984 1991
Units: Revenue, costs --billion yen
Traffic units
--
passenger km and tonne km in millions Train kms -- in thousands2691 2988 194180 515522 253684 1799 Revenud Cost
? change
-3.9 -50.4 19.2 -10.3 -77.5 -63.0 3946 2257 247031 684368 138901 1206 Freight
1984 1991
202 386 22485 1017800 46600 240 0.90 195 191 26791 91329 10489 89
[image:24.599.66.549.173.566.2]3.4.4 Summary
The turn around in the performance of JNR is impressive, although it is tempered somewhat if one considers the size and availability of subsidy that still exists. This is a reflection of the political importance that railways still have and their importance in the nation's economic planning. The effect of physical factors in JNR's new found profitability should not be underestimated. As Ridley and Terry (1992) point out,
"In many areas there is extreme pressure on land, which makes new surface transport infrastructure expensive, slow and difficult to achieve
...
By the same token, the high value of land opens up the possibilities for deals with developers, farmers, and existing owners who might benefit from the new rail0 construction taking place." -
7
The main elements in the turn around of JNR can be summarised into several points. 4
(1) Separation of long term problems
-
The repayment of long term debt and the redeployment of redundant labour was made the responsibility of JNRSC, whilst the shinkansen infrastructure was handed over to SHC. This ensured a smooth transfer and established a sound basis of operation even during the reconstruction of JNR.
(2) Corporatisation and Privatisation
This brought a commercial attitude to both managers and staff.
(3) Deregulation
The separation from government control brought new freedom to managers and increased their accountability and freedom to develop other businesses, such as retail and property.
(4) Withdrawal of special local lines -
A
total of 3,160 kilometres of extremely unprofitable lines were withdrawn.3.5 NETHERLANDS
3.5.1 Introduction
At the moment railways in the Netherlands are subject to a high degree of government intervention a t every level. Netherlands Railways (NS) does not have the freedom to decide its
own
fares, levels of service or investment plans. Government influence does not end there, but extends to the operational aspects of NS too. As Huisman (1993) acknowledges,"The present arrangements between the government and Netherlands Railways include a mixture of responsibilities without, however, offering Netherlands Railways adequate incentives to serve its market in the best way."
This type of arrangement is a result of the Dutch government's concern for a national strategic transport plan. However, several recent events have initiated reform in public transport administration, resulting in a more market oriented, independent NS. These events include (1) the Wijffels Committee report (1992), that urged the government to afford NS the scope to function as an independent business and to create distinct organisational divisions within NS, (2) EC Directive No 911440 and Council Regulation No 1893191, whose main provisions are for the separation of rail operations and infrastructure, and 'open access' on rail networks, (3) the governments belief that the transport system underpins sustainable economic growth. This last point was recognised by the government and NS as early as 1988. NS put forward the RAIL 21 plan which aimed to double passenger traffic by the year 2005 with no increase in subsidy (see appendix three of Preston et al, 1994). The government in turn promised to introduce a number of measures to restrain car growth i.e. inter- urban road pricing. However, despite NS increasing passenger kilometres by 40% since then, the government has still to deliver its promises on car restraint.
3.5.2 The Government's Proposals
The gist of the government's proposals is that NS will retain full responsibility for the operation of rail services, with the freedom to set levels of service, fares and investment necessary for operations. All other aspects of rail provision such as infrastructure management will be managed by the government or the government via a third party. Some of the main elements of the proposals are set out below.
(1) Infrastructure
The Dutch government will have responsibility for the development, management and financing of the railway infrastructure. However, it will assign the management of
the infrastructure in the short and medium term to an administrative unit of NS, known as NS Infrastructure (NSI). The terms and conditions will be laid down in contracts between the government and NSI, and will contain incentives to encourage efficient performance by NSI. NSI will also have to tender work out.
The Dutch government will retain a long-term role in infrastructure planning, to complement its integrated planning policy. That is to say rail infrastmcture planning will be related to the planning of other transport modes, the environment and of land- use.
(2) Capacity Management
The government recognises that capacity management is a n integral part of NS's operations. As such it will leave it with NS but to ensure impartiality (to allow open access) will create a distinct organisation within NS to manage capacity; will set out
(3) Freight Services
At present NS Freight has complete commercial freedom, and is able to set freight rates as it choses. The Dutch goverment eventually wants NS Freight to operate as an independent business unit on the open market, with its own legal status.. One of the essential elements in freight's future is the ability to attract and handle new traffic. The RAIL 21 CARGO plan was submitted in 1990 for just this purpose. This plan included a new freight route between Rotterdam and Germany (since approved) and the development of international inter-modal services.
(4) Passenger Services
The Dutch government envisages a profitable and market oriented NS passenger division, responsible for its own fares, levels of service and investment plans. At the moment the government has a contract with NS, under which NS is promised a real level of support in return for a minimum level of service (maximum fares are also stipulated).
In future the government hopes to separate the commercial and the social aspect of NS rail operations through the contracting out of transport services which are not commercially viable for NS, but which nevertheless are socially desirable. This would then allow NS to concentrate on its commercial operations, aided and abetted by the government's Second Transport Structure Plan. The aim of this plan is tofcreate favourable conditions for public passenger transport through urban planning, car- parking policy and pricing differentials between car and public transport. .
To obtain a situation where government fmances are only required for infrastructure investment and the contract sector, with passenger services being profitable, the government has identified a six year program from 1994-2000. The program has three main components, (1) An improvement in NS's efficiency, (2) NS will have to increase fares in real terms, (3) NS will have to consider cutting unprofitable services.
(5)
Finance and InvestmentAt present the government subsidy to NS is equal to NLG 1,600m per year, consisting of over NLG 1,000 m for infrastructure maintenance, some NLG 450m for operations and another NLG 150m for infrastructure and capacity management etc
....
The portion of this subsidy that the government wishes to eradicate is the NLG 450m operating subsidy. The government feels that this could be achieved by its six year program e.g.(1) efficiency improvements of 2% per year would save NLG 40m per year, (2) a fare increase of 1% would improve NS results by NLG 15m, (3) network rationalisation of non-profitable services would save NLG 5m, resulting in savings 6f NLG 60 million
in the first year. By the sixth year these measures together could result in savings of around NLG 400 million.
700m per annum. In order to achieve a doubling of traffic by 2005 investment will have to rise to NLG 2500m per annum, expanding the intercity network from two to four tracks and rolling stock from 2250 passenger carrying vehicles (1988) to 3375 in 200012005. Given that half of the fleet will by then comprise of double decker vehicles (so the number of seats will have increased by 90%) only a small increase in vehicle utilisation will be necessary to acheive the doubling of trafic (see appendix three of
Preston et al, 1994)
3.5.3 Conclusions
The proposals of the Dutch government will clarify the division of responsibilities between the government and Netherlands Railways; give financial and commercial independence to NS; acheive the EC directive and council regulation; and allow the Dutch government to concentrate on the formulation of a n integrated transport policy, see Huisman (1993). However, without control over fares and service levels, quite how the Dutch government intends to achieve this last objective is open to question.
To be successful the government must ensure that it leaves NS as an independent organisation; continues to support and provide quality infrastructure and ensures a 'level playing field' between different transport modes.
3.6
NEW
ZEALANDRAILWAYS
3.6.1 Introduction
Railways in New Zealand have undergone a radical transformation over the past 11
years. They have developed from a highly protected, overstaffed and loss making
organisation into a privatised, commercial, profit making organisation, operating in F
a deregulated market. The evolution process resulted from, firstly, the establishment of New Zealand Railways a s a Corporation, secondly, the transformation of this corporation into a Limited Company (independent of the government) and thirdly the sale to a private consortium led by Wisconsin Central in July 1993.
3.6.2
New
Zealand Railways CorporationThe New Zealand Railways Corporation RJZRC) came into being with the New Zealand Railways Corporation
Act
1982. I t was given a commercial remit, a board of directors taken from private industry and perhaps most significant of all a well defmed objective:"To operate s o , that revenue exceeded costs, including interest and depreciation."
Source: Small (1993)
commercialisation and change. The realisation that the New Zealand government were serious in 'cutting off subsidy payments again acted as a spur to improve productivity and financial performance.
The whole emphasis during the eighties was on 'downsizing' and greater 'market led' operations. Outside transport management specialists, Booze-Allen and Hsmiliton were used to set the 'strategic direction' for the corporation.
Over 100 projects were set in motion, amongst them:
(a) The use of 'hub and spoke' networks (as in the airport industry) t o rationalise station and freight terminals. This resulted in a system of six hubs and 12
spokes and allowed the closure of over 300 smaller terminals.
d
P(b) Changes in working practices to facilitate one-man train operations and increasing average train size (20%).
(c) The introduction of higher capacity rolling stock.
(d) Improvements in maintenance regimes for both track and rolling stock. This resulted in a reduction of workshops from eight to two and of depots from 32 to 17.
(e) Introduction of information technology to improve productivity and marketing efforts e.g. AMICUS, a fully integrated system to manage marketing, sales, fleet disposition and train operations.
By 1990 the NZRC was achieving operating profit, but was still short of a net profit due to a substantial debt (the result of redundancy payments and the electrification of the North Island Main
Trunk).
In a n attempt to ease the transition of NZRC to a limited company and then to a PLC, the government transferred the debt to itself. The operating side of NZRC was set up as a limited liability company called New Zealand Rail Limited (NZRL). NZRC was left with the ownership of the land, road passenger business, Speedlink parcel service and other general assets. Land necessary for rail operations was rented to NZRL for a nominal rent.3.6.3 New Zealand Rail Limited
Organisation Structure:
New Zealand Rail's structure is now centred around three business groups who operate a s profit centres. These are Railfreight, Passenger and Operations, a resume of each follows.
Railfreight
commodities such as steel, coal, fertiliser and limestone; 'forestry' transports logs, pulp, paper and timber products; 'cargo flow' dealing with bulk primary products and export and import container traffic; 'distribution services' are responsible for freight forwarders and the transport of new and used vehicles; 'freight forwarding' functions as an internal freight forwarder, consolidating wagon loads of general freight. Through joint ventures and agreements with trucking firms, Railfreight is able to offer a full nationwide network and achieve door-to-door coverage.
Passenger
This is complementary to the Railfreight business, using the marginal network capacity to generate additional revenue for the company. Passenger Group serves the following markets, commuter, long distance rail passengers, interisland passengers and cars, and cross-strait commercial vehicle traffic. Commuter services aperate under contracts to respective Regional councils, whilst Intercity services operate over seven routes with no public funding.
Operations
This provides line haul services to Railfreight and Passenger Group. It manages most of the infrastructure and mobile assets of the company, for example rolling stock, ferries, track and signalling. Four divisions have been set up, each with its own responsibilities,
-
Network Operations, that has responsibility for the operation and maintenance of the company's fxed and mobile assets.-
Network Services, responsible for controlling train movements.-
Engineering, that designs and builds land-based assets.- Interisland Line, that operates three roll-on, roll-off ferries across Cook strait.
Track Access
NZRL see it as vital that they have control of their infrastructure, track standards and so costs. NZRL has thus remained a vertically integrated business. Control of access to the track is d e f i e d by the terms of the lease with New Zealand Rail Corporation for use of the land under the track. Under these terms, other operators have rights to use the track on any section for which tonnage or passenger levels fall below a specified threshold.
minimalised and definitely not encouraged. In part, this is a reflection of the government's belief that real and effective competition already exists between road and rail, and ships and rail.
3.6.4 Results ..,..
~ :.
t : ~ . ~
.?.
.
..Between 1982 and 1989, New Zealand Railways lost about 25% of its freight tonnage, however, only 40% of this decline was due to road substitution with 60% ofithe fall due to the recessionary climate. The current freight market share of inter-regional traffic is estimated to be 30%.
A look at performance indicators demonstrates that NZRL has improved its productive efficiency quite substantially from 1982. Staff productivity has increased by 200%,
average train size has increased by 21% and the wagon fleet has fallen by 69%. The emphasis has been on greater utilisation of rolling stock coupled with increases in staff productivity.
During the same period real rail freight rates have fallen by 50% which indicates that the savings generated through this period have been passed on to consumers, improvements in allocative efficiency as well as in productive efficiency have therefore taken place.
3.6.5 S u m m a r y % 7
The results enjoyed by NZRL have been accomplished over a 10 year period. The first eight years were spent 'commercialising' and 'downsizing' the rail operations. The government was committed to freeing not only the transport market but also the economy as a whole. It placed particular emphasis on freeing the railway's labour market, removing the Railways from the State's centralised wage fxing system, limiting the right to strike and giving a stronger legal emphasis to labour relations. This was accompanied by managements' pressure to change working practices e.g. two man trains. Similarly the British government has identified changes in both the labour market and in working practices as a key area for improving productivity in the rail industry (see Foster, 1994).
Commercialisation was further helped with the introduction of a market-orientated structure e.g. Freight, Passenger, Property etc
....
This meant that very clear business objectives could be set and accountability improved. As Small (1993) says,"The combination of accountability, individual responsibility and inter-group competition contributed to a new management ethos within the rail system."
Once again this is similar to events i n the UK. Here BR was introducing sedorisation in a n attempt to improve accountability for each of its business sectors and to improve information flows on costs, revenues and subsidy payments. BR enjoyed considerable productivity gains but unlike NZRC was unable to achieve a n operating profit.
privatised. The main difference between the privatisation of BR and that of XZRL is that NZRL has been privatised as a vertically integrated business. NZRL feel that an infrastructure company, a t least one step removed from the market, would be unable to judge and respond to market requirements thus leading to investment in areas which are not commercial priorities. Furthermore, the New Zealand government feels that there is sufficient competition between rail, road and air to encourage efficiency within the railway industry. The objective it set the NZRC in the eighties is proof of its belief in this.
3.7
SWEDISH
RAILWAYS
3.7.1 Introduction
The state railways original1 function was to connect private rail systems that served local regions, resulting in a national and regional network. Gradually. the state took over networks as they ran i n t o deficit. With road development and motorisation this trend increased until by 1965 privately-owned lines accounted for less than 5% of route kms and by 1991 for none.
Until 1979 the national network operated without subsidy, and the whole rail system was one of the most efficient and cost effective in Western Europe (BRB and The University of Leeds, 1979). However, in the eighties a combination of falling market share and unclear management objectives led to spiralling deficit payments and falling investment. Public and political concern about the lack of investment and growing levels of congestion within cities led to the 1988 Transportation Act.
3.7.2
The
Transportation Act 1988The act was based upon a 'road model', the main features of which are summarised i in appendix three of Preston et a1 (1994).
(i) The rail network was divided into a trunk system of main arteries and county lines.
(ii) Rail infrastructure became the responsibility of a new state agency Banverket
(BV),
who leased track access to train operators on a marginal social cost basis. BV has responsibility for new investment, maintenance and acts a s regulator over safety and scheduling matters.(iii) Statens Jarnvagar (SJ) became a train operator and marketing organisation, for both passenger and freight operations. It retained ownership of terminals and rolling stock, also maintaining operating rights over trunk routes for passenger traffic, and trunk and county routes for freight traffic (excluding iron ore).
(v) If SJ or the CTA's did not wish to exploit their transportation rights (not run a service) then the government (trunk lines) and BV (other lines) can award such rights to other operators.
(vi) Infrastructure charges paid by train operators would be consistent with the pricing regime employed by the road authority, namely marginal soc+al:cost.
." .
(vii) The state would provide grants for new investment. . . . . ~ . ~
BVs organisation is highly decentralised, being split into five regions and 21 districts. There is also an Industrial Division that deals with purchasing, production and storage of material, and an Independent Railway Inspectorate responsible for safety checks and accident investigations. SJ's organisation has moved from a regional to a product based set up, with the creation of four main divisions: passenger, freight, mechanical and real-estate.
Although BV and SJ are two separate organisations the distinction set out in the Transportation A d 1988 is sometimes blurred. Timetabling is currently carried out by SJ, traffic control is operated by SJ using BVs infrastructure whilst telecommunications are used jointly by both operators. The first two points put at risk the potential for introducing serious competition for the provision of
we dish
rail services. The latter has been resolved technicallv with assienment of exchanee installations and interconnecting cables to BV, whilst cables andfacilities to portabie equipment for dired use were taken by the user (either BV or SJ). .* -a3.7.3 Financial Arrangements
As outlined earlier all train operators pay an access charge equal
t o
the marginal social cost. The charge is in two parts (i) a f ~ e d element, expressed as a rate per rail vehicle axle (ii) a variable element, related to vehicle t o ~ e - k m , differentiated by type of vehicleto
reflect different amounts of wear and tear on the track structures. The charge is a marginal social cost charge, so the element also includes socio-economic costs e.g. diesel exhaust pollution.Both
SJ
and BV still receive quite substantial subsidies from the government. In SJ's case these are for the operation of 'socially necessary' passenger and freight services, a situation similar to the proposed 'franchise subsidies' in the UK. S J is still expected to make a profit after subsidy, and in 1990 achieved profits of SEK681 m of which rail accounted for SEK372m.
The subsidy payment for that year amounted toSEK1,348 m.
Table 3.5: Government Support To Bankervet
Year SEKm
1988 3275 1989 4035 1990 4300 1991 5250 1992 6500
Source: Preston et a1 (1994)
The government also pays subsidy to CTA's where they have taken over operating rights from SJ.
3.7.4 Franchising
Although franchising is confined to county routes, the results make interesting reading in terms of their implication for franchising in the UK. According to Ridley and Teny (1992):
"Since the reforms under the 1988 Ad, most CTA's have taken an active interest in the development of cost-effective rail services and have called tenders for the provision of railway services in accordance with a specification tailored to their view of 1ocaVregional needs."
So far two principal challenges have arisen to SJ's monopoly of provision, BK-Tag and Linjetag. Both already operate bus services under contract for CTAs in south and central Sweden and provide maintenance services for other bus companies. Although both firms bid for contracts, only BK-Tag was successful in winning contracts in (1)
Smaland and Halland (1990) and (2) Borlange (1992).
S J has responded to the competition by cutting its tender prices by an average of 30%.
It has since secured all contracts for CTA operations, and recently displaced BK-tag in its two franchise contracts. However, the initial success of BK-Tag is proof that competition can exist via a franchise despite the existence of barriers to entry such as, economies of experience and access to existing maintenance services.
BK-Tag combated these barriers through changing inflexible working practices, reducing maintenance costs and integrating their present road operations and maintenance facilities with those of rail. These policies resulted in BK-Tag's train crew of 43 operating the same services that previously used 250 employees of SJ; BK- Tag achieving higher vehicle utilisation than
SJ did and a n estimated labour
productivity gain of 10% via a renegotiated pay structure. BK-Tag's vehicle utilisation was 130,000k m
p.a. per car comparedto
SJ's 90,000k m
p.a. per car. Such results are indicative of the potential productivity and operating gains that could occur in a privatised BR.which a t the moment are the sole preserve of SJ. Whether the CTA results can be replicated is a question that has to be asked. For the CTA operations, the bulk of the rolling stock was provided by CTA, thus helping to reduce the barriers of entry for BK-Tag. CTA operations are also small and less complex in nature, which allowed savings in training costs and overnight allowances. As yet no such proposals have been put forward for the provision of rolling stock on other routes and a further worry must be the strategic role that S J has in timetabling.
3.7.5 Summary
The Swedish Transportation Act 1988 is in some ways similar to the proposals contained in the Railways Act 1993. The separation of infrastructure from operations, realistic charges for track access, the payment of subsidy for the operation of 'socially necessary' services and the use of a franchise system to reduce costs, improve productivity and services. However, overall the Swedish restructuring does not go 'as far' as that proposed by the Railways Act in terms of creating a competitive environment. The Act ensures that all of BR's services, both mainline and local, will be franchised and eventually opened up to further competition through 'open access'. Rolling Stock companies (ROSCOs) will reduce the barriers to entry formed by rolling
stock, whilst the timetable function of Railtrack and the presence of a n independent
regulator ensures strategic barriers to entry are minimalised.
Although the Swedish government envisages franchising the whole rail netwprk and has already scheduled 'open access' for the 1st January 1995, both these goals are still very long term. At this point the emphasis that Sweden places upon a national transport strategy should be noted. Transport is given a major role in the management of the national economy and the relationship between road and rail policy is continuously assessed for consistency of treatment. Great emphasis is therefore placed upon assessing both road and rail by the same socio-economic criteria, so creating a 'level playing field' for both subsidy and investment, and making the real cost of using both modes transparent to users.
3.8.1 Background
From 1970 onwards railroads in the USA have been undergoing a process of reorganisation and reform. The impetus for change was brought about by a financial crisis facing railroads in the north east of the USA. Between 1947 and 1970, freight train miles had dropped by 31%, from 616 billion to 427 billion. During the same period Inter- city passenger miles fell 84%, from 39.9 billion to 4.6 billion. This fall in traffic was the result oE
(1) Tight regulation by the Interstate Commerce Commission (ICC), that required all tariffs to be published and be made available to all shippers under the same terms and conditio~~s. Closure proceedures under the ICC were alao elaborate and time consuming, extending unecessarily the lives of unprofitable lines.