Rochester Institute of Technology
RIT Scholar Works
Theses Thesis/Dissertation Collections
10-2014
Shear Inducing Device for the Testing of Cell
Fragility
Ramnath Raghunathan
SHEAR INDUCING DEVICE FOR THE TESTING OF CELL FRAGILITY
By
Ramnath Raghunathan
A thesis presented in partial fulfillment of requirement for the degree of
Master of Science in Mechanical Engineering
Approved by
Dr. Steven W. Day, PhD_________________________________________ Department of Mechanical Engineering (Thesis Advisor)
Dr. Hany Ghoneim, PhD__________________________________________ Department of Mechanical Engineering
Dr. Kathleen Lamkin-Kennard, PhD ________________________________ Department of Mechanical Engineering
Dr. Mark Olles, PhD _____________________________________________ Department of Manufacturing and Mechanical Engineering Technology
Rochester Institute of Technology Kate Gleason College of Engineering Department of Mechanical Engineering
Acknowledgment
Foremost, I would like to express my gratitude to my advisor Dr. Steven Day for the continuous
support, inspiration, guidance, patience and vast knowledge of my Masters Research. I also
thank him for giving me the opportunity and the freedom to work with the blood pump and
blood.
Besides my advisor, I would like to thank the rest of my thesis committee: Dr. Hany Ghoneim,
Dr. Kathleen Lamkin-Kennard and Dr. Mark Olles for their encouragement, support, and
insightful comments.
I want to thank the faculty of the Mechanical Department: William Finch, Diane Selleck, Robert
Kraynik, Jan Maneti, Jill Ehmann and Michelle Horan of the Biomedical Engineering
Department for their timely help and guidance. I also thank my fellow lab mates and friends:
Brian Vanger, Shehan Jayasekara, Sarah Stoltzfus, Aishwarya Ganapathy Subramaniam and
Kasturi Chandwadkar.
Last but not least, I would like to thank my family: Ramamurthi Raghunathan (Father), Kamala
Raghunathan (Mother) and Divya Raghunathan (Sister) for their love and support.
This work was partially supported through the FDA Critical Path Initiative project on
Abstract
Most blood pumps are designed to boost the pumping abilities of the heart by mechanical energy
transfer using a rotor. Due to the nature of blood contacting devices, the various components of
blood are subjected to shear stresses caused by the device. The accurate analysis and prediction
of blood damage during the design phase of a device has been difficult to achieve. This has been
complicated by both the inaccuracy of computer tools used to model the blood flow and the large
uncertainty in the reported values of stress that damage blood components. Different components
of blood, such as red blood cells, platelets and VWF (Von Willebrand Factor), have different
sensitivities to shear stress. Further, the damage to blood components has been correlated to both
the magnitude of the shear stress and duration of time that the components are exposed to that
stress (exposure time). A device that is based on cylindrical Couette flow was developed by
Rochester Institute of Technology called the Maglev (Magnetic Levitation) shearing device. This
device has a magnetically suspended rotor thus reducing a major amount of friction when
compared to pumps with bearings. The device is intended to have a single region of laminar
Couette flow (between an inner rotating cylinder and a stationary housing) that exposes the fluid
to stress. From prior work, the device was partially manufactured but never made to work. The
two primary goals of this thesis are to fabricate a functional magnetically levitated shearing
device to induce stress in blood and other fluids using the new fluid path design and to determine
Table of Contents
Acknowledgment ... I Abstract ... III List of Figures ... VI List of Tables ... VIII
Symbols and Acronyms ... IX
1 INTRODUCTION ... 1
1.1 Background ... 2
1.1.1 Blood ... 2
1.1.2 Blood damage ... 4
1.1.3 Blood shearing devices ... 5
1.1.4 Measurement of Free Hemoglobin ... 9
1.1.5 Maglev shearing device ... 12
1.1.6 Taylor Vortex ... 13
1.1.7 Hemolysis Power Law models ... 14
1.2 Motivation ... 14
1.3 Objectives ... 15
2 METHOD ... 16
2.1 Experimental Apparatus ... 16
2.1.1 Maglev Components and Parts ... 16
2.1.2 Flow Path Design ... 23
2.2 Blood Damage Measurement ... 28
2.2.1 Sampling Procedure ... 30
2.2.2 Trial #1 ... 33
2.2.3 Trial #2 ... 35
3 RESULT ... 36
4 DISCUSSION AND CONCLUSION ... 41
4.2 Damaging of blood (Objective 2) ... 41
4.3 Future Work ... 42
5 REFERENCE ... 44
A APPENDIX A ... 47
A.1 Bread Board Connection ... 47
A.2 Run out Testing ... 48
A.2.1 Specifications ... 48
A.2.2 Calibration of the Acuity AR700 laser ... 50
A.2.3 To determine the Run out of the rotor ... 51
A.3 Initial Testing and Performance ... 54
A.3.1 AutoHESA ... 54
A.3.2 Centering ... 55
A.4 Preliminary Blood test ... 55
List of Figures
Figure 1: Red Blood Cell23 ... 3
Figure 2: Process of Hemolysis in a Red blood Cell20 ... 5
Figure 3: Deep vein Thrombosis22 ... 5
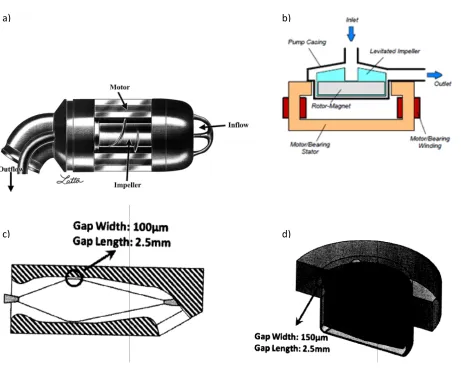
Figure 4: a) Jarvik 2000 blood pump, b) CentriMag blood pump, c) Schematic of Hemolyzer H, d) Schematic of Hemolyzer L4 ... 7
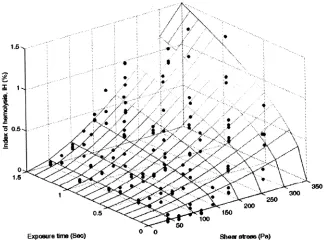
Figure 5: Relation between Hemolysis Index, shear stress and Exposure time obtained by Zhang's study4 ... 8
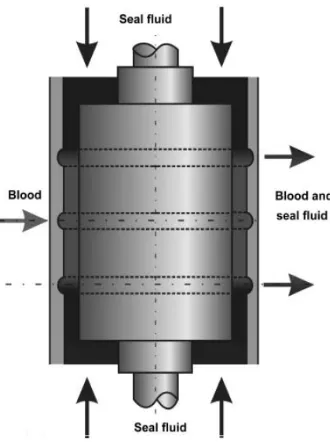
Figure 6: Schematic drawing of the shearing device used in Paul et al study1 ... 9
Figure 7: Centrifuged sample of a damaged bovine blood ... 10
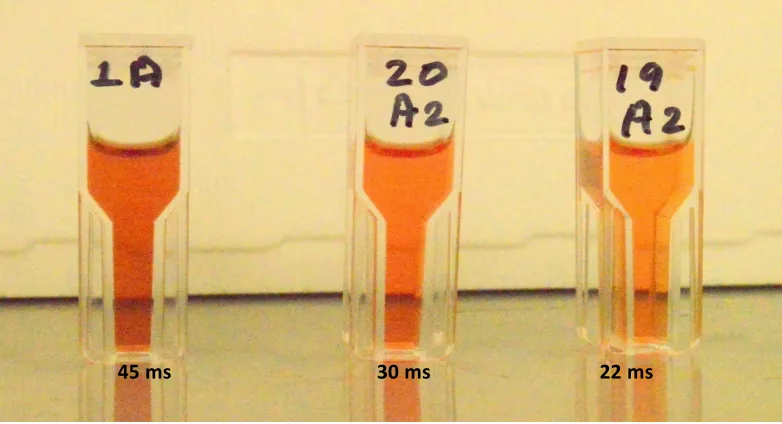
Figure 8: Plasma mixed with free hemoglobin ... 10
Figure 9: Graph that shows the Absorbance for wavelength of oxyhaemoglobin17 ... 12
Figure 10: Maglev shearing device cross sectional view19 ... 13
Figure 11: Taylor Couette flow and the formation of Taylor vortices15 ... 14
Figure 12: Blood Pump at RIT... 15
Figure 13: Cross sectional view of the Maglev shearing device19 ... 17
Figure 14: Custom made HESA used in the shearing device ... 18
Figure 15: Rear AMB on the shearing device ... 19
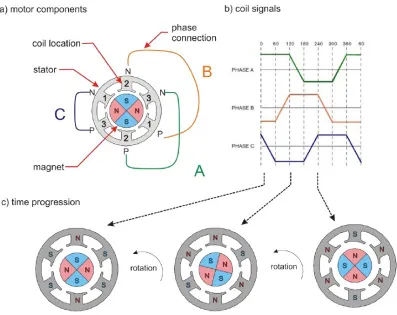
Figure 16: Three Phase brushless motor18 ... 20
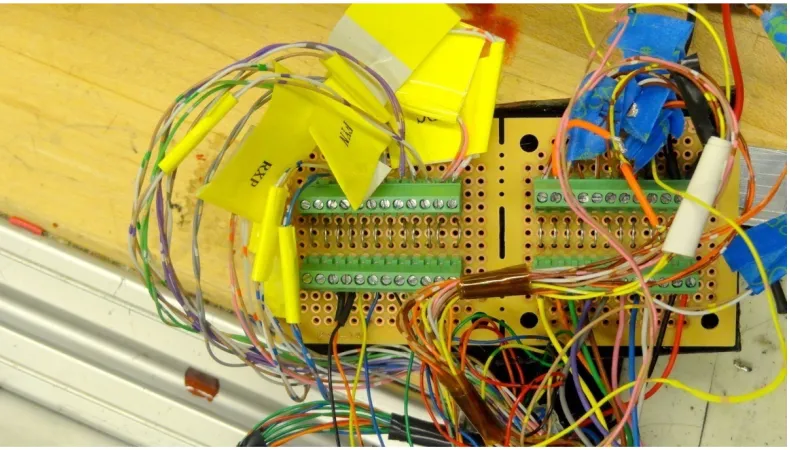
Figure 17: Bread board connection for wires from and to the shearing device ... 21
Figure 18: Protective outer casing for the shearing device ... 22
Figure 19: Flow path of the shearing device ... 23
Figure 20: Velocity profile of the tangential direction in the gap region ... 24
Figure 21: Cross sectional view of the gap region in the circumferential direction for shear stress to rotor speed derivation ... 25
Figure 22: Shear stress profile for the tangential direction ... 26
defined.……… …27
Figure 25: Blood damage measurement experimental set up ... 29
Figure 26: Flow of blood in the shearing device for sampling ... 31
Figure 27: Plasma after two cylces of centrifudging stored in cuvettes ... 33
Figure 28: Plasma sample showing negligible blood damage when passed through the syringe pump and tubes alone ... 33
Figure 29: Set up of the blood shearing experiment Trial #1 ... 35
Figure 30: Rotor speed to the inlet and outlet temperature recorded for each sample ... 35
Figure 31: I.H vs Exposure time for varying Shear stress ... 38
Figure 32: I.H vs Shear Stress for varying Exposure time ... 39
Figure 33: I.H vs Temperature for each sample taken during trial #2 ... 40
Figure A-1: Sine wave formation in an oscilloscope for the Acuity laser ... 49
Figure A-2: Graph for Voltage to Displacement Chart obtained for the AR700 displacement laser ... 51
Figure A-3: Cone formation of the rotor at the either ends ... 52
Figure A-4: Position of the laser at the front of the shearing device ... 52
Figure A-5: Position of the laser at the rear of the shearing device ... 53
Figure A-6: Movement of rotor for the AUTO HESA program ... 54
Figure A-7: Set up of the blood shearing experiment Trial #1 ... 56
Figure A-8: I.H vs Exposure time for varying shear stress ... 58
List of Tables
Table 1: Measured Index of Hemolysis (I.H) at varying levels of shear stress and exposure time
during Trial #1 ... 36
Table 2: Measured Index of Hemolysis (I.H) at varying levels of temperature and exposure time during Trial #2 ... 39
Table 3: I.H (%) only due to shear from Trial #1 ... 40
Table A-1: Color coding of the wires from and to the bread board ... 47
Table A-2: Readings obtained from the Acuity laser AR700 ... 51
Symbols and Acronyms
RIT - Rochester Institute of Technology
CFD - Computational fluid dynamics
LVAD - Left Ventricular Assist Device
HESA - Hall Effect Sensor Arrays
AMB – Active Magnetic Bearings
RBC - Red Blood Cells
FXP – Front positive X direction AMB
FYP – Front positive Y direction AMB
FXN – Front negative X direction AMB
FYN – Front negative Y direction AMB
RXP – Rear positive X direction AMB
RYP – Rear positive Y direction AMB
RXN – Rear negative X direction AMB
RYN – Rear negative Y direction AMB
HFXP – Front positive X direction HESA
HFYP – Front positive Y direction HESA
HFXN – Front negative X direction HESA
HFYN – Front negative Y direction HESA
Hz – Hertz
I.H – Index of Hemolysis
ms - millisecond
min - minute
sec - second
V - Volt
cP - Centipoises
µm - Micrometer
nm - nanometer
Pa - Pascal
𝜏 - Shear stress
∆t - Exposure time
D – Shear damage
fHb – Free Hemoglobin in blood
tHb – Total Hemoglobin in blood
R – Radius of the rotor
L – Shear gap height
d – Shear gap width
N – Speed of the rotor
Q – Volumetric flow rate
1 INTRODUCTION
Artificial Organs in direct contact with the blood stream are generally associated with flow induced
blood damage1. Blood pumps, like most artificial organs, are required to satisfy high demands on
functionality and biocompatibility. The term functionality means that the function of the pump must be
similar to that of the heart itself and biocompatibility means the artificial organ needs to be adaptable
with the human body and its organs. Most artificial organs are prone to post implant complications, such
as mechanical failure of diaphragms and valves or the material of construction is not suitable for the
body. Over the years, a definite link between fluid shear-induced damage and activation of blood
constituents such as platelets and red blood cells (RBC) has been established2. The time factor, known as
exposure time, and stress levels play an important role in blood damage. The best way to determine the
blood damage caused by any mechanical assisted pump is to analyze the motion of the pump and its
effect on the blood flowing through it.
The two major types of blood damage that can occur are thrombosis and hemolysis3. Hemolysis is the
breakage of the RBC membrane, causing the release of hemoglobin and other internal components into
the surrounding fluid. Thrombosis is the formation of a blood clot inside a blood vessel, obstructing the
flow of blood through the circulatory system. Thrombosis is a series of events, but can be initiated by
the mechanical activation of platelets resulting from fluid mechanical shear stress. Flow properties such
where D represents the rate of generation of plasma free hemoglobin, τrepresents the shear stress RBC
is exposed to, and ∆t represents the time duration. A, α, and β are obtained from the regression of
experimental data. This study will experimentally determine hemolysis values by exposing blood to
varying shear stress and exposure time to the shearing device fabricated with the design of the RIT Left
Ventricular Assist Device (LVAD).
1.1 Background 1.1.1 Blood
The blood in our body contributes to 7-8% of our body weight. In addition, it plays a vital role in our
immune system and in maintaining a relatively constant body temperature5. Of the 4000 different kinds
of elements found in human blood, the four of the most important are the red blood cells, white blood
cells, platelets, and plasma. The blood density in an average human is a constant value of 1050 kg/m3.
Since the viscosity of blood is shear thinning, at higher shear rates, it reaches a constant value6-8.
1.1.1.1 Erythrocytes (Red Cells)
Red cells, or erythrocytes, are relatively large microscopic cells (7-10 µm), which make up 40% to 50%
of the total blood volume9. The RBC's are produced continuously in the bone marrow from stem cells at
the rate of 3 million cells per second. The process of production of the red blood cells is known as
Figure 1: Red blood cell23
The life span of erythrocytes is 120 days and when they wear out, the main constituent, hemoglobin,
explodes into compounds of iron, pigment, and amino acids that are eventually ingested by
macrophages.
1.1.1.2 Leukocytes (White Cells)
White cells, or leukocytes, exist in variable numbers and types, but make up a very small part of the
blood volume, normally only about 1% in healthy people. They occur elsewhere in the body as well,
most notably in the spleen, liver, and lymph glands5.
1.1.1.3 Thrombocytes (Platelets)
Platelets, or thrombocytes, are cell fragments without nuclei that work with blood clotting elements at
the site of wounds. Platelets are smaller (2-3µm) than red blood cells and are also produced from stem
cells in the bone marrow. They help in clotting by adhering to the walls of blood vessels, thereby
fight infections by releasing proteins that kill invading bacteria and other microorganisms. In addition,
platelets stimulate the immune system.
1.1.1.4 Plasma
Plasma is the relatively clear, yellow tinted aqueous (92%) solution of sugar, fat, protein and salt that
carries the red cells, white cells, and platelets. Normally, 55% of our blood's volume is made up of
plasma. As the heart pumps blood to cells throughout the body, plasma brings nourishment to them and
removes the waste products of metabolism. Plasma also contains blood clotting factors, sugars, lipids,
vitamins, minerals, hormones, enzymes, antibodies, and other proteins9.
1.1.2 Blood damage
Blood damage by fluid forces primarily depends on the magnitude and duration of shear stress. The two
types of damage that blood handling device designers are concerned with are hemolysis and thrombosis7.
1.1.2.1 Hemolysis
Hemolysis is the destruction of red blood cells, caused by disruption of the cell membrane and resulting
in the release of hemoglobin (shown in Figure 2). Hemolysis is seen in some types of anemia, which can
be either inherited or acquired, as by exposure to toxins or by the presence of antibodies that attack red
blood cells11. During hemolysis the cells burst thereby releasing their contents such as hemoglobin into
the surrounding plasma. Hemolysis induced by mechanical shear stress is a topic of interest in this
Figure 2: Process of Hemolysis in a Red blood Cell20
1.1.2.2 Thrombosis
Thrombosis is the formation of a blood clot in the vessels due to an obstruction in the flow (Figure 3).
The most common place these blood clots occur are in the veins where they can cause severe injury12.
Although the initiation of clotting can be triggered by high shear stress, it is not the subject of this thesis.
This damage usually occurs if the mechanical devices such as the shearing device and LVAD pumps are
between blood damage and flow dependent parameters4. One of the most recent studies of shearing
devices was done by Zhang et al. Zhang et al. studied two devices, namely the Hemolyzer-H and
Hemolyzer- L. The Hemolyzer- H was derived from the Adult Jarvik 2000 (shown in Figure 4(a)) and
the latter was adapted from the CentriMag Blood Pump (shown in Figure 4(b)). The Hemolyzer-H
(Figure 4(c)) had a gap between the inner rotor and the outer housing of 100μm. The rotational speed
of the rotor was varied by the motor controller with a minimum increment of 10rpm.The Hemolyzer- L
(Figure 4(d)) had a gap of 150 μmbetween the housing and the rotor. The Hemolyzer- H had a mirror
like surface finish (arithmetic mean roughness of a surface, Ra = 0.1μm) and the Hemolyzer- L had N5
Figure 4: a) Jarvik 2000 blood pump, b) CentriMag blood pump, c) Schematic of Hemolyzer- H, d) Schematic of Hemolyzer- L4
The shear stress produced by the Hemolyzer- H ranged from 117 and 338 Pa and for the Hemolyzer- L,
it ranged from 21 Pa to 212 Pa for blood with viscosity of 0.0036 Pa.sec. In Zhang's research, the main
goal was determination of flow induced hemolysis by varying shear stress and exposure time (shown in
Figure 5). The results acquired were compared with the study done by Paul et al.1.
a) b)
[image:19.612.76.537.69.440.2]Figure 5: Relation between Hemolysis Index, shear stress and Exposure time obtained by Zhang's study4
In the device used for the Paul et al (Figure 6), RBC damage was not measurable below the shear stress
of 425 Pa and exposure time shorter than 620ms, whereas for the same experimental domain, Zhang and
his team determined a gradual increase in the hemolysis level. In this thesis, bovine blood will be used
Figure 6: Schematic drawing of the shearing device used in the Paul et al. study1
1.1.4 Measurement of Free Hemoglobin and Index of Hemolysis
One of the most commonly known and trusted ways of physically determining the damage in the blood
is by plasma hemoglobin measurement16. Malinauskas showed that hemolysis damage caused by
medical devices could be determined. First, the samples were filtered and then underwent two levels of
centrifugation in order to separate the plasma from the red blood cells. The first level of centrifuge was
done for 15 minutes at 3500 RPM, thus isolating the plasma which was mixed with free hemoglobin
Figure 7: Centrifuged sample of damaged bovine blood
The second level of centrifuging was done for 15 minutes at 4200 RPM, which removes remaining red
blood cells. This plasma was then displaced into cuvettes using micropipettes for further analysis. The
color of the plasma darkens (Figure 8) as the degree of damage to the red blood cells increases.
Figure 8: Plasma color darkening from right to left as the degree of damage increases
There are two techniques of classifying the plasma hemoglobin: an added chemical technique and a
direct optical technique. The added chemical technique uses a reagent with hemoglobin that forms
colored reactions. The direct optical technique uses a spectrophotometer and is the preferred technique.
The most common direct optical techniques are the Cripps, Kahn, Porter and Shinowara techniques of
which the Cripps is the method used at RIT.
1.1.4.1 Cripps Method:
The Cripps method is used to determine the quantity of free hemoglobin in undiluted plasma. This
method is based on the fact that free hemoglobin (fHb) has a unique absorbance spectrum so that the
concentration can be quantitatively measured by comparing the absorbance values at three prescribed
wavelengths. The advantage of using this technique is that the absorbance at A1(576.5nm), which is the
peak absorbance of the oxyhemoglobin, is corrected by using the absorbance on both sides of the peak
A2 (560nm) and A3 (593nm)17 (shown in Figure 9). Finally the free hemoglobin in plasma is determined
by inputting the three absorbance values in Equation 2.
𝑓𝐻𝑏 = 177.68 (𝐴! −!!! !! !) (2)
where fHb is free hemoglobin in mg/dL, A - Absorbance, A1- Absorbance at wavelength of 576.5nm,
Figure 9: Graph that shows the Absorbance for wavelength of oxyhaemoglobin17
The Index of hemolysis (shown in Equation 3) is defined as the ratio amount of free hemoglobin in
plasma normalized by the total amount of hemoglobin pumped through the device24.
I.H (%) =!"#
!"#∗100 (3)
where I.H is the Index of Hemolysis (in %), fHb is free hemoglobin (in mg/dL) and tHb is total
hemoglobin in blood. Bovine blood total hemoglobin ranges between 9500 mg/dL to 13500 mg/dL25.
1.1.5 Maglev shearing device
Myagmar19 designed the Maglev shearing device using CFD and began design modifications to create a
shearing device (Figure 10) using the magnetic suspension from the RIT LVAD. Her work included
design iterations of the rotor in order to achieve the desired range of shear stress and exposure time. For
first order approximations, it is assumed that the Maglev shearing device has a Couette flow condition
which creates a constant shear stress and CFD results prove this to be true. Her work shows that the A1
A2
region 1 (gap region) provides a uniform shear stress throughout the region and, in region 2, the impact
of shear stress is negligible (shear stress in inversely proportional to the gap).
Figure 10: Maglev shearing device cross sectional view19
1.1.6 Taylor Vortex
The Taylor Couette flow (shown in Figure 11) arises from the shear flow of a viscous fluid in the gap
between rotating cylinders and a concentric, fixed outer cylinder. Taylor offered a non-dimensional
Taylor number, Ta, in order to determine the critical relative rate of rotation between the
Figure 11: Taylor Couette flow and the formation of Taylor vortices15
1.1.7 Hemolysis Power Law models
The empirical power law model (Equation 1) is formulated on the assumption that there are only two
factors in the determination of hemolysis. These power law models consist of correlation between
observed damage (D) and both shear stress (τ) and exposure time (∆t).The two most commonly used
power models that relate damage to shear stress and exposure time are shown in equations 4 and 5.
The Giersiepen Power law model as Equation 4 and Heuser's power law model as Equation 5 was
derived by regression analysis of their individual experimental data.
D=3.62∗ 10!!𝜏!.!"#Δt!.!"# (4)
D=1.8∗10!!𝜏!.!!"Δt!.!"# (5)
1.2 Motivation
Implantable ventricular assist devices are regarded as dependable and promising for patients with severe
heart failures8. These pumping devices support the affected heart in its regular pumping process13. Some
of the major pumps that are used for this purpose are rotary pumps and centrifugal pumps. All rotary
pumps approved for clinical use have some type of mechanical bearings and considerable design effort
has been put into designing these bearings to reduce mechanical wear and to reduce hemolysis in pumps
with mechanical bearings14. Nonetheless, there are recently published reports of large trials of 2nd
generation devices (rotary pumps using mechanical bearings) that show improved survival and
(Figure 12) created at RIT is an axial flow pump that has a simple, unobstructed single blood flow path
and novel hybrid magnetic bearings that can overcome the strong axial forces on the rotor without
compromising the idealized flow path14. Due to the inherent nature of blood contacting devices, the
various components of blood are subjected to shear stresses caused by the device. The accurate analysis
and prediction of blood damage during the design phase of the device has been difficult to achieve.
Hence the analysis of this preliminary design was numerical and the device was not constructed.
Figure 12 : Blood Pump at RIT
1.3 Objectives
a. To fabricate a robust magnetically suspended system that can expose blood cells to known and
controllable shear.
b. To use this device to damage the blood cells at varying shear stresses for known amount of
2 METHOD
The goal of this thesis was to fabricate a device which damages the blood at varying shear stresses for
known amounts of exposure time. The work done to achieve this goal is discussed in section 2.1 and the
damaging of blood by varying shear stress and exposure time is discussed in section 2.2.
2.1 Experimental Apparatus
This section discusses the Maglev shearing device parts and flow parameters.
2.1.1 Maglev Components and Parts
The Maglev shearing device in this thesis is used to determine the blood damage with varying exposure
time and shear stress. The base structure consists of the pump like assembly with the five major parts
kept together in sequence with appropriate distances from each other. This design refers back to the
initial design of the LVAD pump. The major parts of the shearing device, including the active
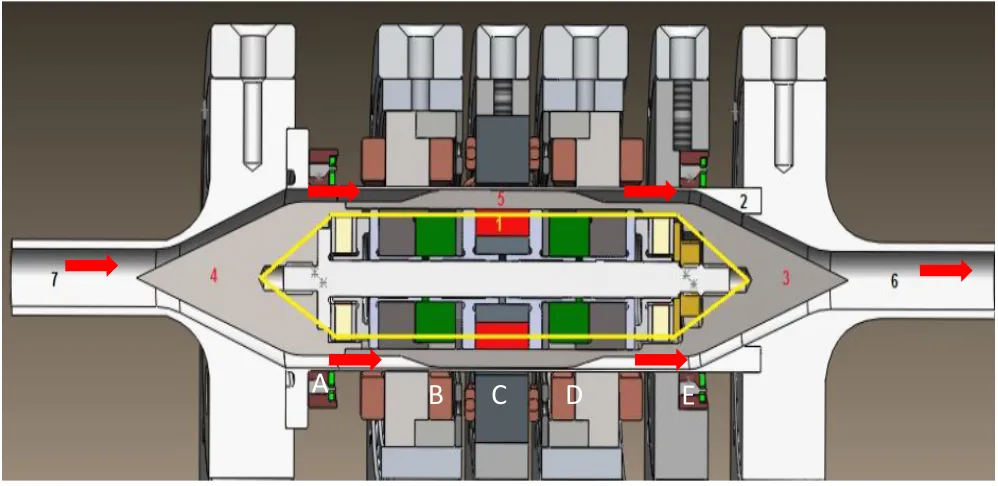
components, are shown using the cross sectional view of the shearing device (Figure 13).
1. Magnetic system from the LVAD pump
2. Outer housing
3. Rotor rear
4. Rotor front
5. Bump
6. Outlet pipe
7. Inlet Pipe
A. Front Hall Effect Sensor Arrays (HESA)
B. Front Active Magnetic Bearings (AMB)
C. Motor
D. Rear Active Magnetic Bearing (AMB)
[image:29.612.71.570.224.467.2]E. Rear Hall Effect Sensor Array (HESA)
Figure 13 : Cross sectional view of the Maglev shearing device19
2.1.1.1 HESA
The HESA is a set of four sensors which are placed around the ends of the housing cylinder. Hall Effect
Sensors are sensors that vary the voltage when the magnetic field changes. The sensors are used to
B
Two HESAs are used in this device, namely the front and the rear HESA. Each array consists of four
sensors with 6 wires – 4 from the sensors, 1 to the ground and 1 from the power supply. The sensors are
named as HFXP (HESA Front X positive), HFYP (HESA Front Y positive), HFXN (HESA Front X negative),
HFYN (HESA Front Y negative), HRXP (HESA Rear X positive), HRYP (HESA Rear Y positive), HRXN
(HESA Rear X negative), and HRYN (HESA Rear Y negative).
2.1.1.2 AMB
The AMB is a set of coil windings around the housing cylinder for the front and the rear of the shearing
device. There is AMB (Figure 15) in the front and the rear of the device namely the Front AMB and the
Rear AMB, respectively. The AMB uses electromagnetic force to levitate, maintain the position, and
permit relative motion of the rotor, which is filled with permanent magnets. The front AMBs consists of
four windings named FXP (Front X positive), FYP (Front Y positive), FXN (Front X negative), FYN
(Front Y negative) and consequently, the rear windings are named as RXP (Rear X positive), RYP (Rear
[image:31.612.225.425.305.510.2]Y positive), RXN (Rear X negative), RYN (Rear Y negative).
The three active components come around a housing cylinder, where the rotor is made to levitate and
spin. The inducer and the diffuser, which were specifically manufactured to the flow of our design, are
connected at the front and the rear of the shearing device respectively.
The wiring from the all the AMB’s, HESA’s and the motor phase are screwed to the terminal junction
box (Figure 17), which is then routed to the target system. The magnetically levitated system is
[image:33.612.111.506.264.489.2]completely controlled by the target system and executed within Microsoft Windows operating system.
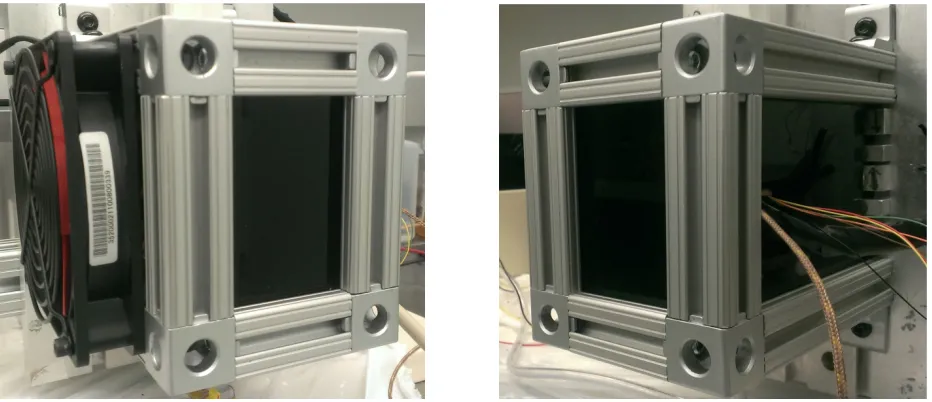
2.1.1.4 Outer Device Case
The shearing device is covered with a case made by 80-20 1 inch structural beams and acrylic panels
(shown in Figure 18). The case protects the shearing device from unnecessary human contact, fluid
[image:34.612.94.560.195.396.2]spills on the device and other factors.
2.1.2 Flow Path Design
The flow path is constructed in such a way that, the blood is pumped at a flow rate Q into the device and
sampled at the end of the device as shown in Figure 19. The shearing device uses a bladeless rotor, so it
cannot by itself pump the blood. The 2nd major objective of this thesis is to determine the damage to the
blood due to varying exposure time and known amount of shear stresses uniformly across the gap. In
order to implement this practically, the relationship between shear stress and exposure time with
[image:35.612.74.572.286.489.2]individual criteria needs to be determined separately.
Figure 19 : Flow path of the shearing device
2.1.2.1 Exposure time (Relationship between Exposure time and flow rate)
The flow rate depends on the area and the velocity of the fluid entering the cross section (shown in Rotor
Outer Housing
Inducer
Diffuser
L
GAP
R
Flow, Q
d
N
Viscosity
, μThe exposure time is inversely proportional to the flow rate (𝑄∝!!). Hence exposure time is varied by
varying the flow rate of the fluid entering the shearing device.
In order to determine uniform exposure time through the gap, the assumption is made that the velocity is
uniform throughout the flow in the axial direction as shown in
Figure 20.
Figure 20 : Velocity profile of the axial direction in the gap region
Vmax
r
0 Vz
Rotor
r
z
2.1.2.2 Shear stress (Relationship between Shear Stress and rotor speed)
From prior CFD calculation, it is confirmed that the shear damage is maximum at the gap. Using the
circumferential direction of the flow in the device, shear stress can be related to the rotor spinning
(Equation 7a and 7b) inside the housing cylinder as shown in Figure 21.
Figure 21 : Cross sectional view of the gap region in the circumferential direction for shear stress to rotor speed derivation
𝜏 =µ!!! (7a)
𝜏 =!"!"#µ!" [ω(in rad/sec) = 2πN/60] (7b)
where τ is the shear stress, µ is the viscosity of blood (4.5cP), R is the radius of the rotor (9.55mm), L is
the Gap height (0.23mm) and N is the rotor spinning speed (in RPM). The shear stress is directly
proportional to the rotor speed (𝜏 ∝N), hence shear stress is increased and decreased by varying the
spinning of the rotor inside the housing cylinder.
Outer Housing Cylinder L
r θ
R
The assumption is made that the shear stress in the circumferential direction is much higher than the
shear stress in the tangential direction. Thus the shear stress in the tangential direction (
Figure 22) is insignificant.
Figure 22 : Shear stress profile for the tangential direction
𝜏!"=𝜇 𝑑𝑣!
𝑑𝑟
τrz τ
-‐τ 0
Figure 23: (a) Velocity profile and (b) shear stress profile of the circumferential direction of the shearing device
2.1.2.3 Rotor Speed determination
A dynamic signal analyzer was connected to one of the signals from either the front or the rear HESA.
This signal was then read using FFT from a dynamic signal analyzer (Figure 24) to determine the
[image:40.612.81.568.71.335.2]frequency and in turn, the speed of the rotor.
Figure 24: Photograph of the dynamic signal analyzer which was used to determine the speed of the rotor
r r
0
0 ωR Vθ τrθ
𝜏!" =𝜇𝑑𝑣! 𝑑𝑟
2.2 Blood Damage Measurement
The shear stress is varied by altering the rotational speed of the rotor and the exposure time is varied by
altering the volume flow rate of the syringe pump.
The dump time, TD, (Equation 8) is defined as the time taken for the damaged blood from the gap region
to reach the sampling region (3 way valve).
T! = !"#$%& !"#$ !"# !"#$%&'( !"#$ !"#$!"# !" !"#$%& !"# !"#$% !" !"# !"#$%&'( !"#$%& (8)
The experiment to determine the blood damage is set up exactly as shown in Figure 25. Thermocouples
were inserted in order to determine the inlet and outlet temperature of blood. The speed of the rotor is
determined from the frequency acquired from the digital analyzer, which is connected to the rear HESA
Figure 25: Blood damage measurement experimental set up
Centrifuge Tube 3 WAY VALVE
MULTIMETER
Fluid flow tubing HESA and AMB Wiring Motor Phase Wiring Thermocouples
SYRINGE PUMP
BEAKER
TERMINAL BOX
TARGET SHEARING
2.2.1 Sampling Procedure
The Sampling procedure is the process of sampling blood, which was damaged in the gap region (shown
in Figure 246), in the centrifuge tubes for a particular shear stress and exposure time set up in the device.
1. Tubing and fittings are fitted at the appropriate location and all exits are sealed except for the
sampling exit.
2. Start rotor levitation.
3. Pump blood through the shearing device using the syringe pump at a flow rate of 4ml/min.
4. Start taking time measurements using a stopwatch as soon as the required rotor speed and flow
rate of blood are set.
5. Once the dump time is reached for a particular flow rate, the sampling of the blood is done by
changing the flow direction on the 3-way valve to let the damaged blood be collected in a
centrifuge tube.
6. Once the required amount of blood sample is collected, the flow direction on the 3-way valve is
returned to original and the blood flow goes back to the beaker.
Figure 246: Flow of blood in the shearing device for sampling
The samples were centrifuged in centrifuge tubes, stored in cuvettes (Figure 257), and then analyzed
using the Cripps method in order to determine the Index of Hemolysis (as explained in the section1.1.4).
The results of Cripps method is fHb in units of mg/dL. This was converted to I.H (%) according to the
Beaker
Centrifuge Tube 3 Way
Valve
Thermocouple
Equation 3 assuming a total hemoglobin of 12000 mg/dL (mean of the reported range of 9500 mg/dL to
[image:45.612.137.515.140.394.2]13500 mg/dL). The total hemoglobin was not measured directly.
Figure 257: Plasma after two cycles of centrifuge stored in cuvettes
Before the actual blood damage measurement, the blood samples were passed to a centrifuge tube using
the syringe pump, tubes, and tube fittings (the same tubes and tube fittings were used in the actual blood
damage measurement as well) without passing through the device. After which centrifuge tube
underwent the Cripps method and I.H was determined. The results showed that the samples (Figure 28)
Figure 28: Plasma sample showing negligible blood damage when passed through the syringe pump and tubes alone
The blood used for all testing purposes was bovine blood and the Index of Hemolysis for varying shear
stress and exposure time was determined in Trial #1.
2.2.2 Trial #1
The device was kept in a box with a fan running continuously in order to cool the device (shown in
Figure29) and also in order to determine the temperature of the blood, thermocouples were added to the
inlet and outlet of the shearing device. The shear stress was ranged from 0 Pa to 125 Pa and exposure
Figure 29: Set up of the blood shearing experiment Trial #1
The inlet and outlet temperature recorded during each sample taken was graphed with respect to the
Figure 260: Rotor speed to the inlet and outlet temperature recorded for each sample
2.2.3 Trial #2
The setup of Trial #2 was exactly the same as Trial #1 (Figure29). There was a significant variation of
temperature of the blood from the inlet to the outlet of the device during spinning (Figure 30). Hence
this trial was conducted to determine the variation of damage due to change in temperature during
levitation and not during spinning. Thus heat was physically induced to the system by changing the
Proportional gains (P gains) of the Proportional-Integral-Derivative controller (PID controller) from the
target system. By increasing the P gains more than usual, more current flows through the electromagnets
and this unnecessary current is converted into heat. The heat is dissipated to the blood flowing through
the device, thus raising the temperature of the blood.
The temperature of the blood is varied during levitation, by varying the gains, in order to produce
similar temperatures that occurred during spinning in Trial #1. The temperature of the blood was varied
from 80 oF to 100 oF for an exposure time range of 20ms to 45ms.
0 1000 2000 3000 4000 5000 6000 7000
0 20 40 60 80 100 120
Ro
to
r S
pe
ed
(RP
M)
Temperature (Fahrenheit)
Rotor spinning speed vs Temperature
3 RESULT
The Index of Hemolysis (I.H) for different shear stress and exposure times are determined during the
Trial #1and recorded in Table 1.
Table 1: Measured Index of Hemolysis (I.H) at varying levels of shear stress and exposure time during Trial #1
Sample
# Stress Shear Exposure Time fHb I.H
Pa ms (mg/dL) (%)
1 0 67 2 0.015
2 0 45 2 0.015
3 0 30 3 0.022
4 0 22 2 0.015
5 124 67 64 0.533
6 124 45 47 0.385
7 124 30 40 0.333
8 124 22 18 0.148
9 124 22 27 0.222
10 113 67 54 0.452
11 113 45 29 0.244
12 113 30 36 0.304
13 113 22 26 0.215
14 100 22 25 0.207
15 100 67 53 0.444
16 100 45 36 0.296
17 100 30 26 0.215
18 100 22 28 0.237
19 0 67 5 0.044
20 0 45 5 0.044
stress for the range of 20ms to 70ms exposure time. The I.H of 124 Pa was slightly higher (slope =
0.0085ms-1) than that of the 100 Pa and 113 Pa for the same range of exposure time. All the experiments
in trial #1 were conducted in the time period of 48 hours. The 0 Pa (rotor levitation only) shear stress
was noted before the start and the finish of the experiment for different exposure times. The I.H of the
reading after 48 hours was recorded to be slightly higher (0.025 %) than that at the start of the
[image:50.612.96.552.246.518.2]experiment due to aging in blood.
Figure 271: I.H vs Exposure time for varying Shear Stress
A graph was also plotted between I.H and shear stress for varying exposure time as shown in Figure
282. The I.H increases from 0 % to 0.55 % as the shear stress increases from 0 Pa to 125 Pa. The curves
were drawn by the linear regression of experimental data of the I.H and shear stress for varying exposure
time. The I.H was similar for the 30ms (slope = 0.0025ms-1) and 45ms (slope = 0.0028ms-1) exposure
y = 0.0071x
y = 0.007x
y = 0.0085x
0 0.1 0.2 0.3 0.4 0.5 0.6
0 20 40 60 80
I.H
(%)
Exposure Eme (ms)
I.H vs Exposure time for varying Shear stress
100 Pa
113 Pa
124 Pa
0 Pa at the start of trail #1
0 Pa at the finish of trail #1 (acer 48hrs)
Linear (100 Pa)
time for the range of 0 Pa to 125 PA shear stress. The I.H of 67ms was slightly higher (slope =
0.0042ms-1) than that of the 30ms and 45ms, and much higher than that of 22ms (slope =0.0018ms-1) for
[image:51.612.105.542.167.445.2]the same range of shear stress.
Figure 282: I.H vs Shear stress for varying Exposure time
In order to determine the damage due to temperature alone, I.H for different exposure times and
temperature are determined at 0 Pa shear stress during Trial #2 and recorded in Table 2.
y = 0.0042x
y = 0.0028x
y = 0.0025x
y = 0.0018x
0 0.1 0.2 0.3 0.4 0.5 0.6
0 20 40 60 80 100 120 140
I.H
(%)
Shear Stress (Pa)
I.H vs Shear Stress for varying Exposure time
67 ms
45 ms
30 ms 22 ms
Linear (67 ms)
Linear (45 ms) Linear (30 ms)
Table 2: Measured Index of Hemolysis (I.H) at varying levels of temperature and exposure time during Trial #2 Sample # Shear Stress Exposure
Time Temp fHb IH
Pa ms oF mg/dL %
1 0 45 82 9 0.074
2 0 30 84 4 0.037
3 0 22 84 4 0.037
4 0 30 90 10 0.081
5 0 22 90 5 0.044
6 124 22 92 38 0.318
7 0 45 94 12 0.104
8 124 45 94 63 0.526
9 124 30 95 58 0.481
10 0 45 97 20 0.163
11 0 30 98 16 0.133
12 0 22 95 9 0.074
13 0 45 103 28 0.230
A graph was plotted between I.H and temperature for varying exposure time as shown in Figure 293.
The I.H increases from 0.03 % to 0.23 % as the exposure time increases from 20ms to 45ms.
Figure 293: I.H vs Temperature for each sample taken during Trial #2
0 0.05 0.1 0.15 0.2 0.25
0 20 40 60 80 100 120
I.H
(%)
Temperature (oF)
I.H vs Temperature for varying Exposure time
45 ms
30 ms
[image:52.612.159.491.440.669.2]Using the temperature results obtained, the impact of blood damage due to shear from trial #1 (shown in
Table 3) at a particular temperature and exposure time was determined from the difference between the
I.H corresponding to the particular shear stress (Trial #1), and I.H of 0 Pa shear stress at that temperature
(from Trial #2), and I.H due to aging of blood from 0 Pa obtained before and after the experiment (from
[image:53.612.69.558.241.562.2]Trial #1).
Table 3: I.H (%) only due to shear from Trial #1
Exposure time
Temperature
Blood Damage, I.H (%)
I.H(%) due to shear from Trial
#1
I.H from Trial #1 I.H from
Trial #2
ms oF At 124
Pa At 100 Pa At 113 Pa Due to
Blood aging At 0 Pa
22 92 0.317 0.025 0.058 0.233
22 96 0.208 0.025 0.075 0.108
30 95 0.483 0.025 0.117 0.342
30 94 0.217 0.117 0.1
30 98 0.3 0.133 0.167
45 94 0.525 0.025 0.1 0.4
45 97 0.242 0.167 0.075
4 DISCUSSION AND CONCLUSION
This thesis was successful in completing the fabrication of the Maglev shearing device and the analysis
for shear damage was carried out. Damage to the blood due to temperature and due to aging in blood
was also investigated.
4.1 Working of the Shearing device (Objective 1)
The degree to which blood was damaged was regulated by varying shear stress and exposure time. In the
process of investigating the exposure time, it was necessary to know the flow rate of the blood. The
syringe pump was capable of supplying consistent flow rate.
In order to determine the shear stress, the factor needed to be taken into account was the speed of the
rotor. The speed of the rotor was controlled by the Target system and measured using the HESA signal.
The ability to regulate and control the rotor speed and flow rate allowed the device to damage blood.
4.2 Damaging of blood (Objective 2)
The results from the trail #1 show that the relationship between blood damage, shear stress, and
exposure time corresponds to that of the hemolysis power law model. According to the hemolysis power
law model, blood damage should be exponentially proportional to shear stress and exposure time
(Equation 1). Results from trial #1 showed that I.H increased with the increase in shear stress and
exposure time, which is the same as that shown in previous studies. Hence, the resultant I.H values
obtained were similar to those from previous studies. The results from Trial #1 when compared with
Zhang et al results (Figure 5) showed that the I.H values were similar in the range of shear stress and
exposure time conducted in this study. Paul et al was not able measure hemolysis damage below 425 Pa
damage in the shear stress range of 0 to 130 Pa and exposure time range of 20ms to 70ms. However,
there wasn’t sufficient data to prove the difference in I.H from that of the previous studies.
Consequently, the exponential factors obtained were inconsistent to those from previous studies.
The blood damage at 0 Pa for different exposure time showed consistency and minimal damage.
However when blood damage was compared between the 0 Pa damage at the start of the trial to the end
of the trial (duration of trial 48 hours), there was an I.H increase of 0.025 %. Thus the aging in blood
needs to be accounted for in the calculation of shear damage.
As part of the sampling process of Trial #1, the temperature of the inlet and outlet for each sample was
recorded (Figure 31). The results showed that there was a measureable increase in temperature upon
spinning of the rotor. As such, Trial #2 was carried out to account for the damage due to the
temperature. This way, the blood damage could be attributed solely to the temperature and not to shear
stress.
The result from the graph (Figure 293) clearly shows that there is a positive correlation between the
increase in temperature and increase in I.H After accounting for the blood damage due to temperature
and blood damage due to aging (Table 33), it was still observed that the measured I.H values were
significantly lower than those of the from the Trial #1. Hence, the results from Trial #1 are conclusive in
any kind of testing. Since fresh animal blood is not readily available, using it in large amounts
for running several tests repeatedly is not practical. Also, the life of the bovine or porcine blood
is low; hence all tests need to be conducted within a short period of time. All this could be
avoided, if other fluids are used as blood replacements for testing purposes, such as artificial
blood surrogates.
• It is observed that temperature of the system had a major impact on the results. In order to gain
more confidence in determining the relationship between blood damage, shear stress, and
exposure time, further investigation needs to be carried out to understand the extent and
effectiveness of temperature in damaging blood and its relationship to shear damage.
• Further work needs to be carried out to collect more data from the device in order to determine
a relationship between the I.H obtained from this thesis and previous studies.
5 REFERENCE
1. Paul, R.; Apel, J.; Klaus, S.; Schugner, F.; Schwindke, P.; Reul, H., Shear stress related blood
damage in laminar Couette flow. Artificial Organs 2003, 27 (6), 517-529.
2. Wu, J. C.; Antaki, J. F.; Snyder, T. A.; Wagner, W. R.; Borovetz, H. S.; Paden, B. E., Design
optimization of blood shearing instrument by computational fluid dynamics. Artificial Organs
2005, 29 (6), 482-489.
3. Chua, L. P.; Akamatsu, T., Measurements of gap pressure and wall shear stress of a blood pump
model. Medical Engineering & Physics 2000, 22 (3), 175-188.
4. Zhang, T.; Taskin, M. E.; Fang, H. B.; Pampori, A.; Jarvik, R.; Griffith, B. P.; Wu, Z. J., Study
of Flow-Induced Hemolysis Using Novel Couette-Type Blood-Shearing Devices. Artificial
Organs 2011, 35 (12), 1180-1185.
5. http://www.redcrossblood.org/learn-about-blood/blood-components.
6. Leverett, L. B.; Lynch, E. C.; Alfrey, C. P.; Hellums, J. D., RED BLOOD-CELL DAMAGE BY
SHEAR-STRESS. Biophysical Journal 1972, 12 (3), 257-&.
7. Chua, L. P.; Song, G. L.; Yu, S. C. M.; Lim, T. M., Computational fluid dynamics of gap flow in
a biocentrifugal blood pump. Artificial Organs 2005, 29 (8), 620-628.
8. Chua, L. P.; Song, G. L.; Lim, T. M.; Zhou, T. M., Numerical analysis of the inner flow field of
a biocentrifugal blood pump. Artificial Organs 2006, 30 (6), 467-477.
12. http://www.bupa.co.uk/individuals/health-information/directory/d/deep-vein-thrombosis, W. P.,
Deep veinThrombosis.
13. Budge Johl, M. L., Reto Schoeb, Effect of a Maglev Centrifugal Pump on Slurry Health and
Defect Rates. 2005.
14. StevenW. Day.Magnetically Levitated Implantable Blood Pump.Web. March, 2012.
15. Moser, K. W.; Raguin, L. G.; Harris, A.; Morris, H. D.; Georgiadis, J.; Shannon, M.; Philpott,
M., Visualization of Taylor-Couette and spiral Poiseuille flows using a snapshot FLASH spatial
tagging sequence. Magnetic Resonance Imaging 2000, 18 (2), 199-207.
16. Malinauskas, R. A., Plasma hemoglobin measurement techniques for the in vitro evaluation of
blood damage caused by medical devices. Artificial Organs 1997, 21 (12), 1255-1267.
17. Cripps, C. M. (1968). Rapid method for the estimation of plasma haemoglobin levels. Journal of
Clinical Pathology, 21(1), 110–2.
18. Arnold David Gomez (2009). Control of a magnetically levitated ventricular assist device.
19. O. Myagmar, “Evaluation of CFD based Hemolysis Prediction Methods,” August,2011.
20.
“http://enerca.org/activities-news/news/18/eculizumab-reduces-paroxysmal-nocturnal-hemoglobinuria-complications-and-improves-survival”. Web. March, 2013.
21.
“https://www.boundless.com/physiology/textbooks/boundless-anatomy-and-physiology-textbook/blood-17/erythrocytes-red-blood-cells-165/rbc-anatomy-828-2192”. Web. April, 2013.
22.
“http://www.bupa.com.au/health-and-wellness/health-information/az-health-information/deep-vein-thrombosis”. Web. March, 2012.
23. “http://leavingbio.net/blood.htm”. Web. March, 2012.
24. “http://www.fda.gov/MedicalDevices/DeviceRegulationandGuidance/GuidanceDocuments/ucm0
A APPENDIX A
A.1 Bread Board Connection
All the active components are powered, controlled, and displayed through the target system, hence the
wiring from these components are connected to the target system through the bread board (shown in
Table A-1).
Table A-1: Color coding of the wires from and to the bread board
COLOR CODING OF THE WIRES
FROM SHEARING DEVICE PC
B Pin
AMB & MOTOR PCB Pin
TO XPC TARGET
Wire 2 Wire 1 Wire 1 Wire 2
Wire Band Wire Band Wire Band Wire Band
BLACK 11 PHC 11 BLACK
WHITE 10 PHB 10 WHITE
RED 9 PHA 9 RED
BLUE 8 RYN 8 YELLOW BROWN
PINK 7 RYP 7 BROWN WHITE ORANGE BROWN
GRAY 6 RXN 6 BROWN YELLOW YELLOW BROWN
VIOLET 5 RXP 5 BROWN ORANGE WHITE BROWN
BROWN 4 FYN 4 BROWN TAN
GREEN 3 FYP 3 TAN WHITE TAN BROWN
ORANGE 2 FXN 2 TAN BROWN
YELLOW 1 FXP 1 BROWN PINK WHITE TAN
HESA
ORAN GE
ORANG
E 1 5V 1 WHITE PINK WHITE ORANGE
BROW N
BROW N
2 GND 2 PINK WHITE TAN ORANGE
RED 3 HFXP 3 TAN
VIOLE
T WHITE VIOLET
YELLO
GREEN 5 HFXN 5 VIOLET
WHIT
E VIOLET TAN
BLACK 6 HFYN 6 GRAY
WHIT
E GRAY TAN
RED
7 HRXP 7 WHITE
GREE
N TAN GREEN
GREEN
8 HRXN 8 GREEN
WHIT
E GREEN TAN
YELLOW
9 HRYP 9 WHITE BLUE TAN BLUE
BLACK
10 HRYN 10 BLUE
WHIT
E BLUE TAN
A.2 Run out Testing
During the spinning of the rotor at different speeds, the rotor might revolve in an orbit reducing the
region 1 much less and this might cause additional damage to the blood. Hence it is essential to
determine the distance of the gap region (region 1) during spinning of the rotor.
In order to determine the run out displacement of the rotor, an AR700 Acuity Displacement laser is used
as described in this section.
A.2.1 Specifications
Acuity AR700 Displacement Sensor
A.2.2 Calibration of the Acuity AR700 laser
a. Frequency Calibration
Frequency of the laser sampling rate is calibrated by using the laser to determine the displacement of a
linear actuator of known frequency. The laser is then connected an O- scope to determine the frequency
(shown in Figure A-1).
Figure
A-1: Sine wave formation in an oscilloscope for the Acuity laser
The above O-scope reading is for 35 Hz linear displacement motion
From the Wave, Time for 5 oscillation = 144ms = .144 sec
Hence Frequency for 1 oscillation = (!.!""! )∗5
= 34.7 ~ 35 Hz
b. Amplitude
To determine the amplitude, the laser is setup on a table with the laser point facing the tip of a Vernier
caliper jaw. This way, as the Vernier caliper jaw moves further from the laser, the voltage keeps
increasing. Ten readings were taken by repeating the experiment ten times (Table A-2) and using these
[image:63.612.100.551.302.592.2]readings the relation between voltage and actual distance was determined (Figure A-2).
Table A-2: Readings obtained from the Acuity laser AR700
minimum detectable distance from the laser (mm) 11.04
maximum detectable distance from the laser (mm) 14.33
Vernier Caliper (mm) V.C
Reading Multimeter Ratio
Average V.C reading
1
V.C
reading 2 Difference
Laser Range
Voltage
(v) V/mm
24.35 12.89 11.46 0.42 1.63 3.8809524
3.165218
24.35 12.67 11.68 0.64 2.39 3.734375
24.35 12.4 11.95 0.91 3.16 3.4725275
24.35 12.04 12.31 1.27 3.94 3.1023622
24.35 11.79 12.56 1.52 4.606 3.0302632
24.35 11.72 12.63 1.59 5 3.1446541
24.35 10.95 13.4 2.36 7.46 3.1610169
24.35 10.86 13.49 2.45 7.79 3.1795918
24.35 10.65 13.7 2.66 8.44 3.1729323
24.35 10.48 13.87 2.83 8.95 3.1625442
Figure A-2: Graph for Voltage to Displacement Chart obtained for the AR700 displacement laser
Thus 1 mm = 3.0637 V
A.2.3 To determine the Run out of the rotor
The run out of the rotor is to be determined for both front and the rear and is done by setting the laser to
face the front and the rear separately. The spinning of the rotor at its minimum speed is 2000rpm which
is equivalent to 35 Hz in frequency. Hence the sampling is set at a safe frequency of 2000 Hz.
The laser reading during spinning is noted by facing it to the tips of the rotor and two distinct numbers
are obtained. These two numbers are subtracted from one another to obtain the slant height (S) (shown
in Figure A-3). Using basic trigonometry, the actual length M is determined. This displacement M is the
run out distance of the rotor during spinning.
y = 0.3264x -‐ 0.0796 R² = 0.99734
0 1 2 3 4
0 2 4 6 8 10
Voltage to Displacement Chart
a. Front
[image:65.612.246.398.77.181.2]The laser is pointed at the slant height of the conical part of the rotor as shown in the Figure A-4.
Figure A-4: Position of the l
aser at the front of the shearing device
S
M 40
Hence the range in distance = !!.!"#$.!"# to !.!"#$!.!
= 2.506 mm to 2.5138 mm
Thus the Run out Slant distance (S) = 2.506 mm - 2.5138 mm
= 0.01 mm
Finally actual Distance M = Sin 40 * S
= 0.006mm
This can be considered that at 2000 rpm spindle rotation in air, the run out of the rear of the rotor is
0.006mm.
b. Rear
The laser is pointed at the slant height of the conical part of the rotor as shown in the Figure A-5.
Figure A-5: Position of the laser at the rear of the shearing device
Laser reading during spinning (Range) - 7.88V to 7.914V
Repeating the same calculation process the actual distance M = 0.01 mm.
Hence 0.01 mm and 0.006mm of the front and the rear of the rotor run out respectively will not
matter much compared 0.23mm, which is the gap height.
A.3 Initial Testing and Performance
The sensors responsiveness and polarity in the front and the rear needs be checked and the center of the
housing was determined for a successful levitation and spinning. They can be determined by Matlab
programs of AutoHESA and Centering Program respectively.
A.3.1 AutoHESA
The AutoHESA program is programmed to make the rotor oscillate at four positions in the order of right
left up and down inside the housing cylinder. The Figure A-6 illustrates the rotor oscillations at each
point. The polarity of the rotor was adjusted in such a way that it coordinates to a sequence.
A.3.2 Centering
The magnetic center of the rotor is required for a successful levitation and spinning. The center would
vary if the sensors were moved or if the housing is moved overall. An appropriate center can be
determined using the Matlab program and also by manual movement of the rotor during levitation and
spinning separately.
The coding for the centering program in Matlab is such that the rotor is made to spin inside the housing,
thus giving the center of the spinning orbit. The center is given in the form of 8 voltages.
The center can be determined physically for spinning and levitation by changing these voltages
manually in each direction while moving the rotor from one side to another during spinning and
levitation respectively.
The conversion from voltage to distance (From Simulink coding)
1V=0.002m
A.4 Preliminary Blood test
The preliminary blood measurement test was conducted in order to understand the procedure and trial
for the betterment of the actual blood damage measurement. During the course of this study, it was
observed that the heat of the device was elevating. Hence a cooling fan was adjacent to the device and a
heat exchanging system was implemented to the base of the shearing device. The heat exchanger utilized
Figure A-7: Set up of the blood shearing experiment Trial #1
A.4.1 Result and Discussion
The Index of Hemolysis for different shear stress and exposure time are determined during the study and
Table A-3: Measured Index of Hemolysis (I.H) at varying levels of shear stress and exposure time during Trial#1 Sample # SHEAR STRESS EXPOSURE
TIME fHb I.H
Pa ms mg/dL %
1 124 30 47 0.392
2 68 30 49 0.408
3 90 30 32 0.267
4 68 67 94 0.783
5 68 45 76 0.633
6 144 30 60 0.5
7 144 22 76 0.633
8 90 67 55 0.458
9 124 22 38 0.317
10 124 22 43 0.358
11 124 45 51 0.425
12 124 45 59 0.492
13 124 67 83 0.692
14 124 67 115 0.958
15 66 22 42 0.35
16 90 22 28 0.233
17 90 45 41 0.342
18 0 6.7 52 0.433
A graph was plotted between I.H and exposure time for varying shear stress as shown in Figure A-8.
The I.H increases from 0.3 % to 1 % as the exposure time increases from 20ms to 70ms. The curves
were drawn between the I.H and exposure time for varying shear stress by the experimental data
acquired during the blood test. All the experiments in this trial were conducted in the time period of 48
Figure A-8: I.H vs Exposure time for varying shear stress
A graph was also plotted between I.H and shear stress for varying exposure time as shown in Figure
A-9. The I.H decreased from 0.8 % to 0.2 % before increasing from 0.2 % to 1 % as the shear stress
increases from 60 Pa to 150 Pa. The curves were drawn between the I.H and exposure time for varying
shear stress by the experimental data acquired during the blood test.
0 0.2 0.4 0.6 0.8 1 1.2
0 10 20 30 40 50 60 70 80
I.H
(%)
Exposure Eme (ms)
I.H vs Exposure time for varying Shear stress
68 Pa
90 Pa
Figure A-9: I.H vs Shear stress for varying exposure time
The results from the graph of I.H vs Exposure time from the preliminary trial (Figure A-8) show that the
Index of Hemolysis does vary with respect to exposure time. The results from the graph of I.H vs Shear
stress from the same trial (Figure A-9) shows that the hemolysis damage initially decreases before
increasing. The initial trial (Trial #1) yielded unusual results due to improper operational procedures,
such as lack of proper device cleaning protocols, mismeasurement of dump time, etc. No data was taken
for 0 Pa (no rotor rotation) shear stress during this trial to determine a distinct pattern in the results.
During the course of trial, it was observed that the surface temperature of the device was elevating. All
these factors were accounted for during the actual blood testing (Trial #1 and Trial #2).
0 0.2 0.4 0.6 0.8 1 1.2
0 20 40 60 80 100 120 140 160
I.H
(%)
Shear Stress (Pa)
I.H vs Shear Stress for varying Exposure time
22 ms
30 ms
45 ms 67 ms