Rochester Institute of Technology
RIT Scholar Works
Theses Thesis/Dissertation Collections
12-1-2002
Virtual electro-photographic printer model
Sunadi Gunawan
Follow this and additional works at:http://scholarworks.rit.edu/theses
This Thesis is brought to you for free and open access by the Thesis/Dissertation Collections at RIT Scholar Works. It has been accepted for inclusion in Theses by an authorized administrator of RIT Scholar Works. For more information, please [email protected].
Recommended Citation
VIRTUAL ELECTO-PHOTOGRAPHIC PRINTER MODEL
by
Sunadi P. Gunawan
B.s. Imaging Science
(2001)
A thesis submitted in partial fulfillment of the requirements for the degree of Master of Science in the Chester F. Carlson Center for Imaging Science
of the College of Science Rochester Institute of Technology
December 2002
Signature of the Author _
H
Rhd
/2/°7/2002.-Accepted by e_nry---=-_ _o--=..y _
CHESTER F. CARLSON CENTER FOR IMAGING SCIENCE
COLLEGE OF SCIENCE
ROCHESTER INSTITUTE OF TECHNOLOGY ROCHESTER, NEW YORK
CERTIFICATE OF APPROVAL
M.S. DEGREE THESIS
The M.S. Degree Thesis of Sunadi P. Gunawan has been examined and approved by the
thesis committee as satisfactory for the thesis requirement for the
Master of Science degree
Dr. Jonathan S. Arney, Thesis Advisor
Dr. Peter G. Anderson
Dr. Roy S. Berns
THESIS RELEASE PERMISSION ROCHESTER INSTITUTE OF TECHNOLOGY
COLLEGE OF SCIENCE CHESTER F. CARLSON CENTER FOR IMAGING SCIENCE
Title of Thesis: VIRTUAL ELECTO-PHOTOGRAPHIC PRINTER MODEL
I, Sunadi P Gunawan, hereby grant permission to the Wallace Memorial Library ofR.I.T. to reproduce my thesis in whole or in part. Any reproduction will not be for commercial use of profit.
Signature: _
VIRTUALELECTO-PHOTOGRAPHIC PRINTERMODEL
by
Sunadi P. Gunawan
Submittedto the
Chester F. Carlson
Center forImaging Science College ofScience
inpartial fulfillmentoftherequirements
fortheMasterofScience Degree
ABSTRACT
A halftone image inthecomputerisabitmap matrixthatcontains either0 or 1,
where0meanstheprinter willnotdepositanytoneronto apaperand 1 means theprinter
will depositsomeamount oftoneronto apaper. The amountoftoner thatisputbythe
printer onto apaperfora given inputsignal patternischaracterized. The hypothesis was
thatthedistributionoftonermassonthepaperfora given inputmatrix pattern canbe
modeledwith atonerpoint spreadfunction,atoner transferefficiency function, anda
noise function.
Inorderto studytonermassdistributionprinted onpaper,it is necessaryto
develop an analyticaltechniquefor measuringthedistributionoftonermass. The
analyticaltechnique usedinthis thesisis anopticalanalysisbasedonlighttransmitted
through the printedsample. This analyticaltechniquewascalibratedagainst a
gravimetric analysis. Linearrelationbetweentheoptical analysis andgravimetric
analysisindicatesthatthetechnique canbeused for measuringspatialdistributionof
printedtonermass on a micro-scale.
Guidedbyexperimentalmeasurementsoftonermassdistribution, aquantitative
model ofthe threeprinterfunctions,thespreadfunction,the tonerdeliveryfunction, and
thenoise function,werecharacterized. These functionswere usedto construct a printer
functionthatwas usedtocomparetheefficiencyofdifferent halftonepatterns. Theresult
oftheprinter model wasextendedtoincludetheoptical point spreadfunctionofthe
paper. Thisprovided a completeprintingmodelthat simulatedbothphysical and optical
Acknowledgement
IwishtoacknowledgeDr. Jonathan S. Arneyfor hisadvice and guidancewhich made
thisprojecttobecome a reality.
Iwouldliketo thankDr. Peter S. Anderson for his support and advice sothatIwasable
togenerate variousdifferenttestsamples easily.
Iwouldliketo thankDr. RoyS. Bernsfor hisparticipation on mycommittee.
Iwouldliketo thankHewlett-Packard Corporation for sponsoringthisproject.
Table Of Content
Chapter 1: Introduction 1
Chapter2: Background 5
2. 1 BasicHalftoneTheory 5
2.1.2 Murray-DaviesModel 5
2.1.2 Yule-Nielsen Model 6
2.2 Optical PropertiesofColorantsonPaper 9
2.2. 1 Beer Lambert Law 9
2.2.2 Kubelka-Munk Law 11
2.3 The Electrophotographic Process (Laser JetPrinting) 13
2.4 Halftoning 15
2.4.1 Cluster Dot 15
2.4.2 Dispersed Dot 17
2.4.3 Error Diffusion 18
2.4.4 Linear Pixel Shuffling 21
Chapter 3: Analytical Technique for Toner Mass Analysis 22
3.1 Instrumental Design 22
3.2 CancelingThe Paper Transmittance Pattern 24
3.3 CalibratingtheOptical Analysis 28
3.4 TestingtheInstrumentfor Experimental Artifacts 31
3.4. 1 The Instrument Configuration 32
3.4.2 Lens Flair Characteristic oftheInstrument 35
3.4.3 InstrumentStability Over Time 38
Chapter 4: Analysis ofToner Mass Distribution on Printed Samples...41
4. 1 Relative Toner Mass Distribution (OpticalAnalysis) 42
4.2 TestoftheMultiple Reflection Hypothesis 46
4.3 Histogram AnalysisofToner Mass Distribution 49
4.3.1 InterpretationofCoverage Histograms 50
4.3.2 InterpretingtheHistogramin Figure 4.6 53
4.4 Toner MassVersus Nominal Dot Area Fraction 54
4.5 SummaryoftheAnalytical Technique 55
Chapter5: The Virtual Printer Model 57
5.1 Virtual Printer Model Function 57
5.2 Calibrating The Virtual Printer Model 60
5.3 OptimumParameters fortheHP LaserJet 4500 Printer 64
Chapter 6: TestoftheVirtual Printer Model 69
6. 1 Virtual Printer Model Testing 69
6.2 Printer FigureofMeritandToner Mass Calculation 71
6.3 ConvertingToner Mass DistributiontoReflectance Image 72
6.3. 1 CalculatingToner Extinction Coefficient 74
6.4 Virtual Printer Model Performance 74
Illustrations ofComparisons ofReflectance Images 79
Conclusions and Suggestions 86
List Of Figures
Figure 1.1: IllustrationofaBitmapPatternandIdeal Result 1
Figure 1.2: Real Printed Image CapturedbyCCDCamera 2
Figure 2.1: Printer Tone Transfer Function for Ideal Halftone 6
Figure 2.2: Physical DotGain Illustration 7
Figure 2.3: Scattering ofLightinthePaper 8
Figure 2.4: Illustration ofBeer-LambertCase inImagingLayer 10
Figure 2.5: Illustration ofKubelka-Munk CaseinImagingLayer 11
Figure 2.6: The Steps inanElectrophotographic Process 14
Figure 2.7: 6 x6 Cluster Dot Halftone Mask 16
Figure 2.8: Exampleof6x6 Cluster DotGray Scale Images 17
Figure 2.9: Exampleof
Bayer'
sOptimum Dispersed Dot 18
Figure 2.10: IllustrationofRasterProcessingwithError Diffusion 19
Figure 2.11: Floyd-Steinberg Error Filter 20
Figure 2.12: Example of aFloyd-SteinbergError DiffusionGrayLevelofFn=0.3....20
Figure 2.13: ExampleofLinear PixelShuffling Gray Scale Images 21
Figure3.1: IllustrationofPossible LightTraveling 23
Figure 3.2: InstrumentalDesign 24
Figure 3.3: Cyan Toner Image in RedandInfrared Light
(Irradianceis inArbitraryUnit) 25
Figure3.4: Cyan Toner Spectral TransmittanceDensityatFn= 1
[image:10.532.50.482.70.646.2]Figure 3.5: RelationshipBetween Optical Analysisand GravimetricAnalysis
For Cyan Toner Mass PrintedUsing 600 dpi Hewlett Packard 4500 30
Figure 3.6: Instrumental Design Illustration forTestingtheInstrument 32
Figure 3.7: DiagramofProcessingTransmittance Image Captured CCD Camera 33
Figure 3.8: IllustrationofHistogramofaFlat-Fielded
Transmittance ImageofPaperwithBlack Tape 34
Figure 3.9: IllustrationofLens Flair 36
Figure 3.10: Experimental Design forTestingLens Flare 37
Figure 3.11: Lens Flare Experimental Result 38
Figure 3.12: Light SourceandCCD CameraTestingConfiguration 39
Figure 3.13: Light SourceandCCD CameraStability 39
Figure 3.14: RedandInfrared FilterTesting 40
Figure3.15: TestingResultfor Red andInfrared Filter 40
Figure 4.1: Relative Cyan Toner Mass Distribution 42
Figure4.2: Scan LineofCyan Toner Mass Distribution Image 45
Figure 4.3: Multiple ReflectanceofLight between TonerandPaper 47
Figure 4.4: Multiple ReflectanceofLight between TonerandPaper Configuration...48
Figure 4.5: MultipleReflectanceofLight Between Inkand PaperResult 49
Figure4.6: Cyan Toner Mass DistributionwithFn=0.3, Fn=0.5,andFn=0.7 50
Figure 4.7: Histogram AnalysisoftheIdeal Toner Mass Distribution 51
Figure4.9: Figure 5.1: Figure 5.2: Figure 5.3: Figure 5.4: Figure 5.5: Figure 5.6: Figure 6.1: Figure 6.2: Figure 6.3: Figure 6.4: Figure6.5:
Relative Cyan Toner Mass Coverage Measured
OpticallyversusDot AreaFraction, Fn. (HP Laserjet4500) 55
DiagramofVirtual Printer Function 59
5x SuperSamplingoftheInput Image Files 62
Toner Point Spread FunctionandToner TransferEfficiencyFunction
for 600 dpi Hewlett-Packard Color Laser Jet 4500 Printer 65
RelationshipbetweentheMeasuredandtheSimulated Toner Mass
Distribution Metrics 66
HistogramofToner Mass DistributionImage
( )Measured & ( ) Simulated. .66
Visual Comparisonbetweenthe MeasuredandtheSimulated Toner Mass
Distribution 68
TestofThe Printer Model 70
Calculating Printer FigureofMerit 72
Relative Toner Mass Correlation betweentheMeasuredand
Simulated Samples 76
Printer Figure Of Merit CorrelationbetweentheMeasuredandthe
Simulated Samples 77
CorrelationbetweentheMeasuredandthe Simulated Samples forVarious
List Of Table
Chapter 1: Introduction
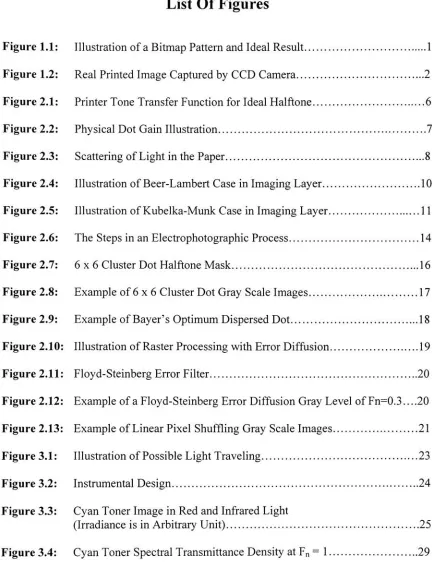
Ahalftoneimage inacomputerisamatrixthatcontainsa patternof0and 1
values. Thispatternis senttoaprinter andtheprinterwilltranslate the signalfor 1 as
some amount oftonermasstobe depositedonto apaper. Thesignalvaluefor0
translatesintheprinter asa commandtodepositno toner. Figure 1.1 isanillustrationof
a matrixpatterninacomputer andthecorrespondingimageprintedbyanidealprinter.
Anideal resulting imagefromaprinterisa perfect squaredotontopof apaper,which
doesnothave physicaland optical dotgain effects.[7]
1 0 1 0 1 0 1
0 0 0 0 0 0 0
1 0 1 0 1 0 1
0 0 0 0 0 0 0
1 0 1 0 1 0 1
Matrix Pattern
[image:14.532.55.467.341.448.2]PRINTER
Figure 1.1: Illustration ofaBitmapPatternandIdeal Result
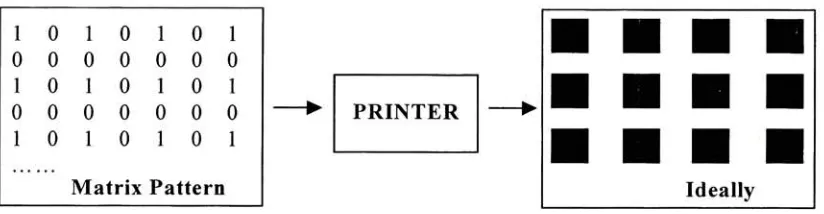
Figure 1.2 showstheresult ofprintingtwo differentmatrix patternson a600 dpi
Hewlett-Packard 4500 colorprinter. The CDintheappendix ofthis thesiscontainsthe
composed of one addressable printerdotand pattern(B)produces one dotcomposed of
fouraddressable printer dots.
(A)
[image:15.532.134.401.148.356.2]111
lxl ClusterSize 2x2Cluster SizeFigure 1.2: Real Printed Image Capture byCCD Camera
Figure 1.2 showsthat theprinteddotsarenotperfect squaredots, buttheyhave
some shapewithsomedistributionand noise. Itisalso clearthat the amount oftonerin
eachprinterdot depends strongly onthechosen pattern. The individualprinterdots in
Figure 1.2 (A)areverydifficultto seeatall,andthe2x2clustersinfigure 1.2(B)arenot
printedas clusters ofdiscretelyresolved printerdots. Theeffects ontonereproduction
areclearly important. Inthe past, the terms"physical dotgain"
has beenusedtodescribe
tonereproduction effectscausedbytonermassdistributionssuchasthoseillustrated in
densitometrytechniquecapable ofmeasuringtonermassdistributions, andtousethe
results oftheanalysistodevelopa quantitative modelfortonermassdistributionin laser
electro-photographicprinting.
Themodelthatwasdevelopedcontainedapoint spreadfunction (PSF).
However,thepointspreadfunctionusedinthismodel was not anopticalPSF,commonly
usedtomodel optical dotgain[13' 23,
29\
butaPSF intermsoftonermass.Aninterestingobservationin Figure 1.2 isthatastheprinter printsfourdots
together(2x2 clusters),theprinterseemsto put moretonerontothepaper. Bylooking
visuallyattheimagesonFigure 1.2heldat armslength,pattern(A)image looks brighter
thanpattern (B)imageeventhough thenominaldotareafraction, Fn, senttotheprinteris
thesame. Macroscopicmeasurements ofimagedensityconfirmthisobservation. This
phenomenon cannotbe describedbythepointspreadfunctionoftonerbecausethepoint
spread function only describesthewaytonermassis distributed. Itdoesnotdescribethe
total tonermassthatis delivered. Therefore,an additionalfunction isneededinthe
printermodel inordertodescribethe tonermassthatis delivered.
The modelwastestedand calibratedbycomparisonwith measurementsoftoner
mass distributionsmadewith anespecially developedmicro-densitometer. This
analyticaltoolusesopticalmicro-densitometrytomeasure thedistributionof printed
tonermass onthepaper. The opticalanalysis oftonermass was calibratedagainst an
micro-densitometricanalysis oftonermassdistributionwas usedtomeasurethespatial
distributionof printedtonermass asaguideto thedevelopmentoftheprinter model.
Theprinter model developed inthis thesiswas usedtocalculate severalfiguresof
meritforcomparison ofdifferent halftonepatterns. Themodelhas been incorporatedas
part ofother projects underthedirectionofProfessor P.G. AndersonandJ.S. Arneyto
Chapter 2: Background
Thischapter providesbriefbackgroundoverviewsoffourtopicsthatare
importanttoanunderstandingofthecurrentthesis. Thebasic halftonetheoryis
described insection2.1. Theopticaltheoryofcolorantsis describedinsection2.2.
Section 2.3 describesthebasicmechanism of electrophotographicprintingprocess.
Finally,section2.4 describesfourvery different kindsofhalftoning methods usedinthis
thesis to testthereliability oftheprinter model.
2.1 Basic Halftone Theory
2.1.1 Murray-Davies Model
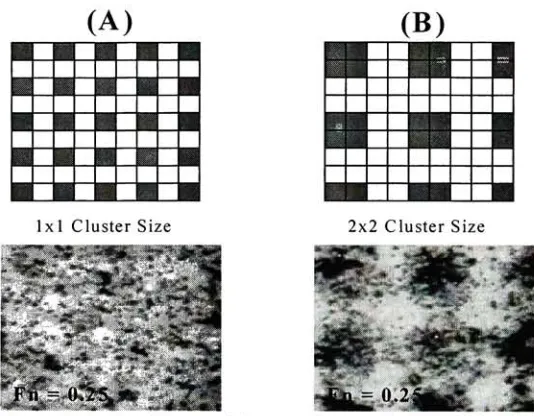
Thefirstprintermodel usedtopredictoutput reflectanceofanimage, R,from
input dot areafractionsenttoaprinter,Fn, wastheMurray-Davies Modelshownin
equation(2.1).[1]
R=
F_-Rk+
(1-F_)-RB
(2.1)Thereflectance values Rkand Rgrepresentthereflectancevalues oftheimageatFn= 1
(solidink)andFn =
equation2.1,then thepredicted reflectance willbelinearlyrelatedto theinputdotarea
[image:19.532.182.366.144.296.2]fraction. This isillustratedin figure 2.1.
Figure 2.1: Printer Tone Transfer Functionfor Ideal Halftone
2.1.2 Yule-Nielsen Model
It isexperimentally observedthat themeasured reflectance is darkerthan the
reflectance predictedbyequation2.1,andthebiggest differenceoccursnear50%dot
areafraction. Dotgainisthe termusedtodescribethisphenomenon. Therearetwo
typesofdotgain; thatis,physicaldotgain and opticaldotgain.[7]
Becausethemeasured reflectance valueisdarkerthan thepredicted reflectance
value, itis generallyassumedthatdotsgetbiggerintheprintingprocess. This isthe
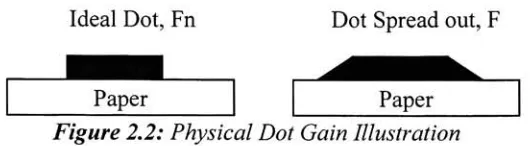
reasonthephenomenoniscalleddotgain. Figure 2.2 illustratesphysicaldotgain. In
dotareafraction, Fn, usedinequation2.1 is clearlynotthecorrectdotareafractionvalue
ifthesize ofthedots increases.
Ideal Dot,Fn
Paper
[image:20.532.140.405.148.221.2]Dot Spreadout, F
Figure 2.2: Physical Dot Gain Illustration
Theactual dotareafraction, F,in a printedhalftone may bemeasuredby
micro-densitometrictechniques.[9] Onemight expectthatbyusingtheactualdotareafraction,
F,inequation2.1 insteadof Fn,onewould predictthecorrectimage reflectance,R.
However,themeasured reflectancevalueis stilldarkerthan thepredicted reflectance
value. ' Therefore,thereisanother effectthatcausesthis observation, whichiscalled
optical dotgain. Thecause of optical dotgainisthescatteringoflight inthepaperJ '
Arney,etal,modeledtheopticaldot gaineffect asillustratedin Figure 2.3.[10'"'
12' 13]
Light enteringthepaperasshownin figure 2.3 can reflectbackoutfromthepaper
(I) oritcan scatterand reflectbackoutthroughthe ink (II). Ontheotherhand, light
Paper
Figure 2.3:ScatteringofLight inthePaper
oritcan scatter and reflectbackoutthrough thepaper(IV). The lightpathin figure 2.3
(IV) causes reflectance of paperbetweenthedotstogetdarker. Theamountoflighton
pathIV isthesame as onpathII. Therefore,theoverall measuredreflectance willbe
darkerthan thepredicted reflectance.
In 1951,Yule andNielsenmodifiedtheMurray-Daviesmodel as shownin
equation2.2.[8] They addedthe 1/npowerfactorinordertocorrectforphysicaland
opticaldotgain sothat theprinterswouldbeabletopredictthemeasured reflectance
fromthedotareafractionsentto theprinter. Equation 2.2describestheYule-Neilson
model.
R=Fn.R
+(l-Fn).R (2.2)
Thenfactorisanempirical constantforfittingtheexperimentaldata.[9J By
findingthebest fitof nvaluefora particularsystem,oneis abletopredicttheoutput
Aswill beshownlater,thelateral scatteringoflightandtheeffects of optical dot
gain cause a problemintheoptical analysis oftonermassdistribution. Thenature ofthe
problem andtheway itwas overcome willbe describedsubsequently.
2.2 Optical Properties ofColorants on Paper
Inanidealcontinuousimaginglayer, onecanapplytheBeer-Lambert Law for
predictingtheoutputirradiance from input irradiance aftertravelingsomethickness of
imaginglayerwitha given colorant absorption coefficient and concentration ofthat
colorant. However, ifthelightscattersinthelayer,Kubelka-Munktheorycanbeused.
Inordertodevelopan optical analysisoftonermassonpaper, theabsorption and
scatteringpropertiesofboththetonerandthepapermustbeunderstood. Thereaderis
referredtoKubelka-Munk(1931), Allen(1980), andBerns(2000)foradetailed
discussionofthesetheories.[3'24'25]
2.2.1 Beer Lambert Law
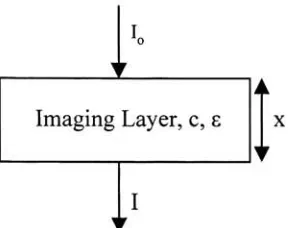
Consideranimaginglayeras shown onfigure2.4, whichdoesnot scatterlight.
The lightenters an imaginglayer, I0,andtravelssome xdistance. The layerhascolorant
at concentration c. Thecoloranthasan absorptioncoefficient, s. Lightthatcomes out
fromthelayer, I,canbedescribedbytheBeer-Lambert Lawas showninequation2.3.
The Beer-Lambert Lawsaysthat the irradiance decreases exponentiallywithincreasing
ImagingLayer,c,e
[image:23.532.196.341.89.203.2]I
Figure 2.4: Illustration ofBeer-Lambert Case inImagingLayer
Equation 2.3 showsthat
-In'P
y\j
isdirectlyproportionaltoc. Theproducte.c.x isalso
calledabsorbance,A. Theterm
-In
'I"*
J.J
iscalledtransmissiondensity, Dt,sodensity is
proportionaltocolorant concentrationinaBeer-Lambertsystem.
D. =-ln =s.c.x (2.3)
TheproductC=
e ciscalledthecolorantcoverage. Ingeneralitiseasier
experimentally tomeasure coverage, C,thantheseparate values of andc. Inthework
2.2.2 Kubelka-MunkLaw
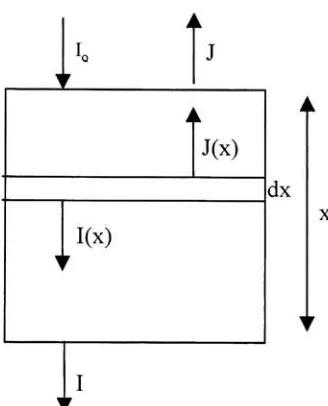
Many imaginglayers,such as paper andpigment, scatterlight. Scatteringoflight
intheimaging layer is veryimportanttobetakenintoconsideration. Forinstance,
scatteringoflightinthepaper can causetheprintedimagetobe darkerthanpredicted.
Therefore,scattering and absorptionoflight intheimaginglayeraffecttheoptical
properties ofimages.
?
Io J
i_
J(x)
1 I(x) r
1 I
r
[image:24.532.191.355.250.453.2]dx
Figure 2.5: Illustration ofKubelka-MunkCaseinImagingLayer
Consideranimaginglayeras showninfigure 2.5thatscatters and absorbs light.
Iftheimaging layerdoesnot scatterlight,then the changein inputirradiance, I0, will
followtheBeer-Lambert Law. Thus, equation2.4canbe writtentodescribethechange
dI=-KI-dx (2.4)
whereKistheabsorption coefficient(theproductof extinctioncoefficient, e, and
concentration,c, withreciprocalunit,e.g. mm"1). However, scatteringalso decreasesthe
irradiance,I, inthedown direction. Kubelka-Munk suggestedthatthe scattering
phenomenon couldbedescribedas afirstorderphenomenon. Therefore, equation2.4
canbeexpandedtoincludethescatteringphenomenon,andthisisshowninequation2.5.
dl=- KI-dx-S-1-dx+S- J-dx
(2.5)
where S isscatteringcoefficient andhasthesameunitas absorptioncoefficient,andJ
represents irradiance intheup direction. A seconddifferentialequationisneededin
ordertodescribetheirradiance intheup directionthatwillalsobeaffectedbythe
scatteringoflight. The irradiance intheup directionis described byequation2.6.
dJ =- K- dx- S-
J-dx+S- 1-dx
(2.6)
Lateral scatteringoflight intheimaging layerisignoredinthisanalysis. The
a=^> (2.7)
S
b=Va2-1 (2.8)
1-R [a-b-coth(b-S-x)]
R= s (2.9)
a-R+b-coth(b-S-x)
T =
(2.10)
a- sinh(b-
S-x)+ b-cosh(b-
S-x)
whereRandTarereflectance andtransmittanceoftheimaginglayerrespectively,andRg
is backgroundreflectance.
2.3 The Electrophotographic Process (Laser Jet Printing)
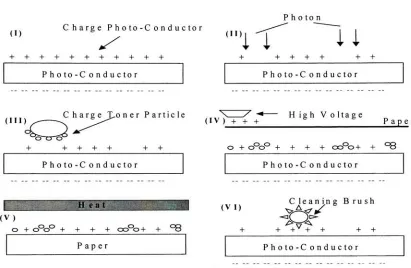
Figure 2.6 shows sixbasicsstepsoftheelectrophotographic process. ' The first
step, asshownin figure2.6-(I),istochargethephotoconductor. Afterthe
photoconductorhas beencharged, thelaser isusedtoexposethecharged photoconductor.
The laser light dischargesthecharged photoconductor. Thisprocessis illustrated in
figure 2.6-(II). Theareawherethephotoconductordischargedwillbe developedinto a
realimage withtonerparticles. Tonerparticles are chargedparticlesthatwillbeattracted
to the dischargedphotoconductor. Therefore,inthedevelopment step,shownin figure
2.6-(III),the tonerparticles willbeattractedto thedischargedareas ofthe
accomplishedbychargingthepaper sothatthepaperhaslargeenough electricfield for
breakingthebond betweenthephotoconductor andtoner. This isshownin figure
2.6-(IV).
Photon
(I) Charge P h
oto-C onductor
(II)
'"I
I
il
+ + + + + + + + + + +
Photo-Conductor Photo-Conductor
C h arge 'Loner Particle N / -* High Voltage
(III)
^-*^>^
(' v ) + + + I B Paper
^^J
+ + + + + + +
Photo-C onductor
o +oo
+ + + + ooo+ + 8
Photo-C onductor
TFT IW? (VI)
(V)
o +oo
+ + + + coo+ + 8
Paper
Cleaning Brush
+ +v
+ + + +
Photo-C onductor
Figure2.6: The Steps inanElectrophotographic Process
Oncethetonerhas beentransferred tothepaper, thetonerparticles arefusedto
create apermanentimage. Thisfusingstateisaccomplishedby heatingthe toneras
showninfigure2.6-(V). The last step intheelectrophotographic processistocleanup
[image:27.532.62.473.165.433.2]2.4
Halftoning
Fora review ofhalftoningtechniques andhalftonetheory,thereaderisreferredto
Ulichney (1987) andKang (1999).[7,26] Thefollowingis asummaryofkeypointsabout
halftoningusedinthecurrentthesis.
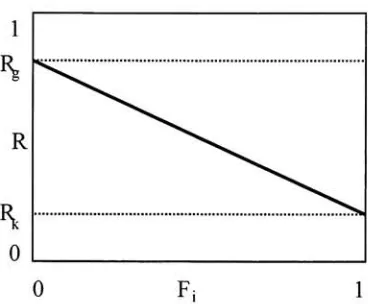
2.4.1 Cluster Dot
Clustered Dothalftoningis alsocalledamplitudemodulated (AM)halftoning.
The AMhalftoningmethodisaconventionalhalftoningmethod wherethespacing
distance betweenthehalftone dots isconstant andthesize ofthedots isnot constant. In
anAMhalftone,thedotareafraction, F,is controlledby controllingthesizeofthedots.
An AMtypehalftone isproduceddigitally byusingahalftonemaskwithaclustered
arrangementofthresholdvalues. The individualelements ofthemaskcorrespondto
individual addressable units oftheprinter. Themask as awhole correspondstoasingle
AMhalftonedot,andthemaskis usedtoconstructahalftone dotateachhalftone
locationintheimage.
Figure2.7 illustrates a6x6clustered dot halftonemaskwith36threshold levels
ranging from 1 to36. A digitalalgorithm comparesthesethresholdvaluesto the gray
levels oftheoriginal continuoustoneimage inordertodeterminewhetherinkshouldbe
deliveredatthatlocationor not. Thethresholdprocess producesa0fortheprint
command"deliverno
toner"
ora 1 fortheprint command "delivertoner". Inthis way, a
sequential arrangement ofthe thresholdvalues causes the 1 valuestogrowina
contiguous cluster astheimage becomes darker. Figure 2.8 showsseveral 6x6cluster
dotgray scale imagesattheredifferent dotareafraction.
21 22 23 24 25 26 20 7 8 9 10 27
19 6 1 2 11 28
18 5 4 3 12 29
17 16 15 14 13 30
36 35 34 33 32 31
Figure 2. 7: 6x6 Cluster Dot Halftone Mask
Thetermofdpi (dotsperinch)isoften usedto describethespacingfrequency of
theaddressable unitsofaprinting device. It is alsothespacingfrequencyoftheelements
inahalftonemask. Thefrequencyofthe halftone dot is lessthan thefrequency ofthe
printer. Forexample, ifa600 dpiprinterisusedtoproduceAMclustereddothalftones
byusinga6x6 halftonemask, as shownintheaboveexample, theresultwill bea 100
LPI (linesperinch) halftoneimage. Thehigherthefrequencyofthehalftoneimage,the
smoother animagewill appear. Thus,a printer withhigher addressibilityisneededin
6x6 Cluster Dot
Fn=
0.3 Fn=
0.5 Fn=
0.7
Figure 2.8: Example of6x6 Cluster DotGrayScale Images
2.4.2 Dispersed Dot.
There aremany differentwaysthethresholdvaluescanbearrangedina clustered
dot halftonemask,and each produces anAMhalftonewithdifferentproperties.[7] Also,
thearrangement ofthreshold valuesinthehalftonemaskdoesnotneedto beclustered
andregular. Manytechniqueshave beenpublishedfordispersingthethresholdvalues
throughout themaskinrandomor quasi random patterns^ ' ' '
Theresultiscalled a
disperseddothalftone,also calledanFMhalftone. Figure 2.9 shows severalillustration
of constanthalftone gray scaleimagesproduced with adisperseddot halftonepattern
Bayer'sDispersed Dot Patterns
Fn=
0.3 Fn=
0.5
xxxxxxxxxx
:WxKxXxx-:-x-X :WxKxXxx-:-x-X :WxKxXxx-:-x-X :WxKxXxx-:-x-X :WxKxXxx-:-x-XXX XXX -.."."."..-..."...."...
..."...-..".-..."....v.
x-x-x-x-x-x-x-x-:-X x-x-x-x-x-x-x-x-:-X x-x-x-x-x-x-x-x-:-X x-x-x-x-x-x-x-x-:-XXX X X X X
X XXX X X X X X X -&*:-*::-:V*-#X
XXX XX X X XXX ::x:::::x:::x:::::::x:::
XX XXXX XXX X .:::.::::$:=.$.
xxxxxxxxxx :SS...::SH.$i
xxxxxxxxxx :::SS...$::::SS. xxxxxxxxxx x-x-x-x-x-x-x-x.-: xxxxxxxxxx
Fn=0.7
xxxxxxxxx:-Figure 2.9: Example ofBayer's Optimum Dispersed Dot
2.4.3 Error Diffusion.
Error diffusion isapopulardigital halftonealgorithmfor preparingimagestobe
printed onlowresolution printers. Errordiffusionwasdevelopedby Floydand Steinberg
in 1976as amethod ofpreparing animageforcomputerdisplay. 7' Error diffusiondoes
notrely on ahalftonemask. Instead,thefirstprinter pixelintheimageiscomparedtoa
thresholdvalueof x=
0.5. Ifthereflectance oftheoriginal, continuoustoneimage(0<
R< 1)is higherthanthisthreshold, theprinter command"0" isusedtoprint no ink.
Otherwise,theprintercommandis"1" andinkisprinted. Thisresultsinagray level
errorE= (0
-R)orE=(1
-R) atthatparticularlocation. Inordertocompensateforthis
error,thenextlocationuses athresholdvaluethatisadjustedtowithsomeamount,k, of
the error, x= 0.5
-k'E. This newthreshold iscomparedtoRandink isnotprintedif R
>x,otherwise ink isprinted. Theresultis still anerror, E=(0
-R)orE=(1
-R),sothis
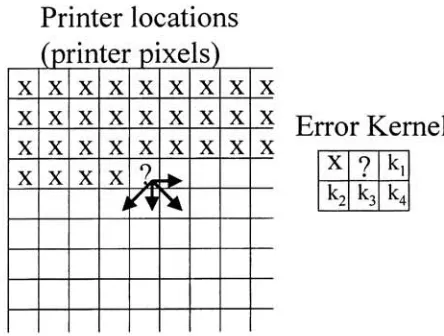
Theerror propagationtechniquegenerallypropagates somefractionofthe error,
kE,toseveralneighboring locations,asillustrated inFigure2.10. The locationsmarked
"x"
have beenprocessed, andink hasbeenprinted or notprinted. The locationmarked
"?"
isthelocationwherethealgorithmis intheprocessofmakingaprint-or-not
thresholddecision. TheresultwillleadtoerrorE=(0
-R)orE= (1
-R),andafraction
ofthaterrorkiEwillbesubtractedfromthethresholdvalueofthepixelto theright of
the "?" location. Three other pixelsthathavenot yetbeenprocessedare alsogivena
fractionoftheerrorto adjusttheirrespectivethresholdvalues. Thevaluesofthe
fractions, kithrough1_4,sumtounity. Eachpixellocationintheimagecan accumulate
errorfromasmany asfourthresholdoperationsin neighboringpixels.
Printer locations (printer pixels) x x x x x x x x x x x
i#ft
x x X X X Error Kernel x _______J_!
^2 ^3 ^4 [image:32.532.153.375.367.535.2]Figure2.1 1 istheerrordiffusion kernelmostcommonly usedinthishalftone
process. Thevalues ofthefractionski through1_4areactuallycalculated as7/(7+3+5+1)
through 1/(7+3+5+1). Figure 2.12 shows an example ofconstantgray levelproducedby
Floyd-Steinberg errordiffusion. Error diffusiontechniquestypicallyproducehalftone
imageswithindividualprinterdots distributed inaquasi random way. Theresultisan
FMtypeofhalftonepatterninwhich dot fractionvaries withthefrequencyofoccurrence
of printeddots.
?
7
3
5
1
(1/16)
Figure2.11:Floyd-SteinbergErrorFilter
mm
2.4.4 Linear PixelShuffling
Linear Pixel Shufflingisan algorithmdevelopedbyAnderson[20]
thatisuseful for
generating halftone imageswithavarietyof properties. Linear Pixel Shufflingcanbe
usedtogeneratedispersedthreshold masksfor dispersed dothalftoningorfordispersing
theorderof rasterprocessing inerrordiffusion halftoning. Amajor advantageofLinear
Pixel Shufflingisthatit isadeterminantprocesswith quasi-randomproperties. Thatis,
itisawayto scrambletheorder ofthingsinawaythatismathematicallyreversible.
DigitalhalftonesproducedbyLinear Pixel Shufflinghave avarietyofdesirable
propertiesfortonecontrol andforcontrol of spatialfrequencycontent. Themathematical
detailsofLinear Pixel Shufflingcanbe seenintheliterature.[20'21'22] Figure2.13 shows
some Linear PixelShufflinggray scale imagesbyusingFloyd-Steinbergerrorfilter.
Linear PixelShufflingwithFloyd-SteinbergError Filter
Fn=
0.3 Fn=0.5
Fn=0.7
MiP
*
an
r
Chapter 3: Analytical Technique for Toner Mass Analysis
Inordertocharacterizethe tonerpoint spreadfunction,the tonermasstransfer
function,and noisefunction,itwasnecessaryto developan analyticaltoolthatcould
measureopticallytheamountoftonermassdepositedonto a paper. Therefore,thefirst
focusofthe thesiswastodevelopandto testan analyticaltoolfor measuringthe spatial
distributionof printedtonermass on a micro-scale.
3.1 Instrumental Design
Amonochrome CCDcamerawithmicroscope optics wasused inordertocapture
the tonermassinformationonprintedsamples. Imageswere capturedfor images
illuminatedwithdifferentwavelengthbandsoflightinordertoextractthe tonermass
distribution basedon spectral characteristicsofthe toner.
Illumination oftheprintedsample fromthecamera sideofthesample results in
animagemadeofreflectedlight. However,a reflectionimageisnot abletodistinguish
spatially betweenregions ofthepaperthathavetonerand regionsthatdonothavetoner.
Thisisbecauseofthelateral scattering oflightwithinthe paper, asillustratedin Figure
3.1. Thisisthe samelateral scatteringeffectthatcausestheso-called opticaldotgain
fromabarepaper region oftheimage (pathIVinFig. 3.1) itstill carriesthe spectral
signature ofthe toner. Thus, spectral analysis of a reflectionimagecaptured witha
microdensitometer wouldindicatethat tonerexistsinthetoner-freeregions ofthepaper.
ReflectanceMode
Io
l^II
Transmittance Mode
Dot
Paper Paper
Figure 3.1: Illustration ofPossible LightTraveling
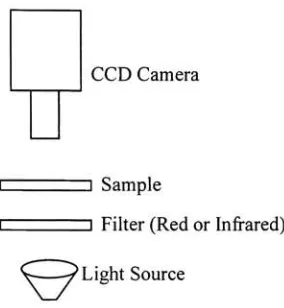
Inordertoavoidtheproblemoflateral scatteringandtheresultingspatial
scrambling ofthetonerspectralsignature, thesampleis illuminated fromtherear as
illustratedontherightside ofinFigure 3.1 andin Figure 3.2. Inthis configuration,light
scatters inthepaperbefore itencountersthe tonerdots, solightemerging fromthe
printedsamplecarries spectralinformationaboutthe toneronly inregions wherethereis
toner. Thedeviceillustrated in Figure 3.2was constructedtoallowfilterstocontrol
illuminationovertherangeofsensitivityofthecamera. Thecamera usedinthis thesis
CCDCamera
_____________ Sample
_____________ Filter(RedorInfrared)
v
[image:37.532.192.334.60.214.2]7LightSource
Figure 3.2: Instrumental Design
Althoughtransmittedilluminationremovestheproblemofspatiallyscrambling
the tonerinformation, it introducesanother problem. The spatial variationinthepaper
transmittance,knownas"paperformation"[17], is introducedintothemeasurement.
3.2
Canceling
The Paper Transmittance PatternInordertocancelthenoise ofpaperformation,anindependentmeasure ofpaper
transmittance isneeded. A preliminary study demonstratedthatcyan, magenta,and
yellowtonerswere notdetectableinimagesmade withnearIRradiation. Figure 3.3
illustratesthepreliminaryexperimentforthecyantoner. The CD intheappendix ofthis
thesiscontainsthehigh quality imagesusedinthisfigure. Theprintedblockofcyan was
clearlyobservedinredlight, as expected,butwas notdetectable inthenearIR. This
Cyan Tonerwith
RedLight Scan Line (RedLight)
^0.5 ~
200 400
Pixel Position 600
Cyan Tonerwith
Infrared Light
Scnn Line
200 400
PixelPosition
600
Figure3.3: Cyan Toner Image in RedandInfrared Light
(Irradiance is inArbitrary Unit)
The camera usedinthisstudyproduced pixelvaluesthatweredirectly
proportionaltotheradiance ofthesample. SincetheimagecapturedinthenearIR
carriedinformation only aboutthe transmittancepattern ofthe paper,it was usedto
cancelthepapertransmittancefromimagescapturedwithvisible light. Equation 3.1
showsthefunctionforthepixelvalues,P, intheimageatlocations(x,y)as afunctionof
[image:38.532.128.412.103.405.2]Pred(x,y)=
kred(x,y)-Sred(x,y).I(x,y)-Tfred-Tp(x,y)-Ttred(x,y) (3.1)
wherePred(x,y) ispixel value ofthecapturedimage,k(x,y) isa collectiveconstant
representingsystem optical effects such asthelensaperture and cosinelens fall-off,
Sre_(x,y)iscamerasensitivitytoredlight,I(x,y)is irradiance distributionforthe light
source,Tfre_isthefiltertransmittance, Tp(x,y) isthepapertransmittancedistribution, and
Ttredistoner transmittance.
Equation 3.2 canbewritten whenthesameimageis captured withInfrared light.
PIR(x,y)=kIR(x,y)-SIR(x,y)-I(x,y)-TfIR-Tp(x,y)-l
(3.2)
where subscriptIRindicatestheinfrared filter isbeingusedforthe analysis,andthe
transmittanceofthetoneris Tt(x,y)= 1
.0intheIR. Weassumethe transmittanceofthe
paper,Tp(x,y), is governedonlybyscatteringsothatitthesamein both images. Then,
dividingequation3.1 by 3.2 leadstoequation3.3. This cancels outthepaper
Pred(x,y) = kred
(x,y) Sred(x,y) Tfred
Jt (3J)
PiR(x,y) kIR(x,y)-S1R(x,y)-TfIR
Asampleoftheunprintedpaperisthenplaced infrontofthecamera and
illuminatedexactlyasdone fortheprintedsample. Imagesare capturedinredlightand
in IR exactlyasdescribedabove. Thisresultsin images describedbyequations3.4 and
3.5. These equations areidenticaltoequations3.1 and3.2exceptthat the toner
transmittancein bothredlightandintheIRareTt(x,y)=1.0.
Ppred(x,y)=
kred(x,y) Sred(x,y) I(x,y) Tfred Tp(x,y) (3.4)
PPm(x,y)=
k^(x,y) Sm(x,y) I(x,y) Tfm Tp(x,y) (3.5)
Bydividingequation3.4by 3.5,equation3.6 isobtained
Ppre_(x,y) kred.Sred(x,y).Tf,red
PPiR(x,y) km.S1R(x,y)-TfIR
Finally,rationingequation3.3 with equation3.6results intoner transmittance
informationonly,asshownonequation3.7.
Freddy)/
Ppred(x,y)/
Ured(,y)C ;
/PPm(x,y)
Thetransmissiondensityis thencalculated asDt(x,y)=
-log(T(x,y)), andDtis
proportionalto toner coverage, C,at eachlocation, (x,y).
3.3
Calibrating
the Optical AnalysisSupposethe tonerobeystheBeer-Lambertlawanddoesnotscatterlight.
Therefore,theirradiance entering inthetonerdecreases exponentiallywithincreasing
tonerconcentration and itsthickness. Byusingthisassumption, itisverysimpleto
measuretherelative amount of printedtonermass onpaperoptically becausethe
Transmittance
Density
400 550 650 700
Wavelength,nm
Figure 3.4: Cyan Toner Spectral TransmittanceDensityatFn = I
Figure 3.4 showsanillustrationof spectraltransmittance densityforcyantoner
whentheprinterprints 100 % cyantonercoverageontothepaper. Forthisgiven
condition, therelative concentration of cyantoner, Cc,isequalto 1.00, andthe
corresponding densityisDc. Thenthedensityatany otherrelativeconcentration,Cc, is
givenbyequation3.8 asDt(650).
Dt(650)=
Dc-Cc (3.8)
Therefore,by measuringandcalibratingDcat 100%toner coverage,we can calculatethe
relative concentration of printed cyantoner,Cc,by knowingthemeasuredtoner
law. Inorderto testwhether or not equation(3.8)is applicable, theresultsoftheoptical
analysis were comparedto theresults of anindependentgravimetric analysisoftoner
mass on paper.
Gravimetric analysis was performedbyprintingwhole sheetsofpaperwith cyan
toner andweighingtheprinted sheets. Sheetswere printed withhalftonepatternsof
differentnominaldotareafractionsfrom 0 to 1. Theprinted cyantoner area was8 x 10.5
inches on8.5x 1 1 inchespapersize. The averagemass of10 differentpaper samples
was subtractedfromthe totalmass of printedcyantoneron a piece of papertogive a
printedtonermass. The gravimetricanalysisresult wasthenplotted againsttherelative
concentration oftonermass determined opticallyas shownin figure 3.5.
H 2a(0.024)
2ct(1.66 grams/m2)
0 0.5 1
RelativeCyan Toner Concentration
(OpticalAnalysis)
Figure 3.5:RelationshipBetween Optical AnalysisandGravimetric Analysis
The primary cause of variationinthegravimetricanalysis wasthevariationof
paper weight. The standarddeviationfor 10 differentpaper'sweightis0.83 gram/m2.
Nevertheless, Figure 3.5 indicatesalinear relationship betweenthegravimetric analysis
andthe optical analysis. Thegravimetric analysis shows alow levelofprecision
primarilybecauseoftheintrinsicvariability ofpaper. Thegravimetric analysisisalso
not abletoresolvetonermassspatially atthemicroscopiclevel. However,the
gravimetric analysis andfigure3.5 provide a calibration constantforconvertingthe
opticalanalysis of relativetonermasstoreal unitsof gram/m2. Thus,theproposedthesis
wasbasedonthe optical analysis oftoner.
3.4 Testing the Instrumentfor ExperimentalArtifacts
Thetransmissionmicro-densitometer shownin Figure 3.2 wastestedfortwo
experimentalproblemsthatoften compromisetheaccuracyof a micro-densitometer.
Theseproblemsarelensflairandtemporal stability. Inordertoevaluatetheextentto
whichtheseproblems contributeto themeasurements madewiththeinstrument,the
3.4.1 TheInstrument Configuration
Figure3.6 shows anillustrationoftheconfigurationoftheinstrumentusedfor
testingtheinstrument for lens flairandforstability. In Figure 3.6, it isshownthatthe
printedpaper sampleissandwichedbetweentwo clear glass plates.Thepurposeofusing
twoclear glass platesistomaintainthesample at aconstantdistance fromthecamera
andthelightsource inordertoholdthefocusofthe camera constantandtoholdthe
illuminationofthesample constant. Fortestingtheinstrument, itwasdecidedtousethe
redfilteronly.
)Sample
H Red Filter
C
^
Light SourceFigure 3.6:InstrumentalDesignIllustration for TestingtheInstrument
Transmittanceimagesoftest samples,T(x,y),were captured withtheCCD
referenceimageof an unprinted piece of paper. Inthesetests,variability causedbythe
paperformationpattern was not a significantfactor, aswillbe illustrated.
T,(_.,)= ^.y)-mean[dark(x,y)1
meanMx>y)_dark(x>y)]
ret(x,y)
-mean|dark(x,y)J
(3.9)
Following imagecapture and flat-fielding,histogramanalysis was performed.
The general experimental sequenceis illustrated inFigure3.7.
CameraOutput
Transmittance Image
T(x,y)
Flat-Field
TransmittanceImage
Tf(x,y)
Figure3. 7: Diagram ofProcessingTransmittance ImageCaptured CCD Camera
Thetestsamples used inthisseriesofexperiments consistedofthereference
paperwithastripofblackvideo cassettetapeplaced overthepaper. Thefractionofthe
paper coveredbytheblacktapewasadjustedtosimulate printed samples withdifferent
dotareafractions. A histogramofaflat-fielded imageof oneofthese samplesis
1
(\l Threshold,Fi r
fee
/
\
___
V
y
Pi
Transmittance
Pixel Value
255
Figure 3.8: Illustration ofHistogram ofaFlat-Fielded Transmittance Image ofPaperwithBlack Tape
Thehistogramclearlyallows a separation ofthepixelscorrespondingtopaper
fromthepixelscorrespondingtoblacktape. Themeanpixelvalues, PiandPp,were
selected asthepeaksofthedistributions, asillustrated. Also,theareafraction, Fj,ofthe
darktapewasestimatedby selectingatransitionpixel value asillustratedin Figure 3.8.
Thepaperandtapepixel values weretranslatedintotransmittancevaluesbyusing
equation 3.10and equation3.11.
X =
mean[ref(x,y)
-dark(x,y)]
(3.10)
y P y
p
mean[ref(x,y)
-dark(x,y)]
Theratio( Pp/mean[ref-dark] )is expectedtobe 1 +/-experimental variability. Thetransmittanceof paperreference,TPjref, wasmeasuredindependentlywithaMacbeth
TR-1224densitometry. This densitometerapproximatesanintegratingspherefor measurement ofscatteringsamples.
3.4.2 Lens FlairCharacteristics oftheInstrument
"Lens flair" isa generaltermusedinthis thesis tomeanany stray lightthatcauses
inaccuracy inthemeasuredtransmittancevaluesusingtheinstrumentshownin Figures
3.2 and3.6. Lightscatteredwithinthelens,as illustrated in Figure 3.9-c,resultsinan
overall additionoflightto theentireCCDarray. Anothercommon sourceofstraylight
is lightthatcomesfroma region ofthesamplethatis outsidethefield of view ofthe camera. Thisis illustratedin Figure 3.9by light frompointbthatcomestofocusat point
b'
insidetheoptical system whereitshouldbeabsorbed. However, a small amount of
scattered reflection can occurattheblackwall oftheopticalsystem,andthisscattered
aT al'
Camera
SamplePlane
Figure3.9: Illustration ofLens Flair
Inorderto testthe significance ofstraylight,a sample of paperwasmaskedbya
pieceofblackvideo cassettetapeas illustratedin Figure 3.10. Themaskedregion
coveredbothregions withinthecamerafieldof viewand regionswelloutsidethecamera
fieldof view. Imageswere captured withthe tapepositionedtoproduce different
fractionsofcoveredpaper,F. Thevalueof Fwasmeasuredbythehistogramanalysis
[image:49.532.164.374.66.282.2]Ill
1
n
Increasing
Paper Area FractionH
Field OfView
Black Tape
?Plain Paper
Figure 3.10: Experimental Design forTestingLensFlare
Iftheinstrumentsuffersfromsignificantstraylight, thenthemeasured valuesof
X,andTpfromequations 3.10and 3.11 willvary withthepaperareafraction, F.
However, iftheinstrument lensflareis negligible, thevalues ofXandTpwillbe
independentoftheareafraction,F. Theresults shownin Figure 3.11 indicatethatstray
lightisnegligible withintheprecisionofthemeasurement. Therefore,theCCD camera
Lens Flare Test(StrayLight) 0.4 -S 0.2 E -0.2
-1 1 1 1 1
.
ou o o o
--CT o t
1 oo o o o
1 u 1 o S 1 1 =c-^ 1 Transmittanceof Paper Transmittanceof Black Tape
0.2 0.4 0.6 0.8
PaperArea Fraction
Figure 3.11: Lens Flare Experimental Result
3.4.3 InstrumentStabilityOver Time
Anotherimportantcharacteristicfortheinstrument designisthe stabilityofthe
instrument. The lightsource, CCDcamera, andthecolorfiltersusedintheinstrument
have tobestableovertime. Otherwise, thevariation oftheinstrumentmay bemistaken
foravariationintoner. The firsttestofinstrument stability involvedthecamera andthe
CCD Camera
i -J Plain Paper Sample
[image:52.532.131.325.59.193.2]V yLight Source
Figure 3.12: Light SourceandCCD CameraTestingConfiguration
Thetransmittanceof a plainpapersample,Tp,was measuredseveraltimesover a
ten-minuteperiod oftimewithapproximatelyone-minute increments. The resulting
measurements are showninfigure3.13. Itisclearthat themeasuredtransmittance ofthe
paperis constantoverten-minutes. Thus,thelightsourceandtheCCDcamera are stable
enoughfor measuringthespatialdistributionoftonermass.
s 0.4
e
E
V. a
i-H 0.2
_ ti ed
Oh
o o o o o o o o e i
10
Period(Minutes)
[image:52.532.154.352.431.561.2]Secondtestwasto test thestabilityoftheredandthe infrared filterused fortoner
mass analysis. Thistestinvolvedthesystem as showninFigure 3.14. Thetransmittance
values of paper inthered andinfraredregionweremeasured,andtheresultsare shownin
Figure 3.15. It isclearthat the twofilters usedintheexperimentare stable over a
10-minute period oftime. Therefore, these twofilterscanbeusedtobuildtheinstrument for
measuringthe spatialdistributionoftonermass.
CCD Camera
_l Plain Paper Sample __RedorInfrared Filter
C PLightSource
Figure3.14: RedandInfrared FilterTesting
Test forRed Filter
S0.4 c I
H0.2
-1 1
V u
1 1
TestforIRfilter
T"
10
s- 0.2
-5 10
Period(Minutes) Period(Minutes)
Chapter 4: Analysis ofToner Mass Distribution
on Printed Samples
Experimentalsamples were printed with aHewlett-Packard Laser Jet 4500color
printer. Sampleswere printedusingcyantoneronly. Differentdotpatternswereprinted
forthis analysis. Thetonertransmittance,Ttre_(x,y),was calculatedforeach pixelinthe
image,usingequation3.7. Thistransmittancemapwas usedtocalculatea relativetoner
coverage, C(x,y),at eachpixellocation. Therelative coverage canbetranslatedinto
absolute
grams/m2
asdescribed inChapter 3. However, most oftheanalysiswasdonein
relative units.
Inordertoobservethedistributionoftonermassvisually, thecalculatedtoner
massdistribution, C(x,y)wasconvertedintoa viewable imageby applyingequation4.1.
Pc(x,y)=
[l-0.8C(x,y)]255 (4.1)
Onthe average, thehighestrelativetonermassis 1.00. However,experimental and
printingvariations resultin localcoveragethataredistributed aroundC=l. Thus,the factorof0.8 inequation(4.1)was selectedtokeepvaluesbetween0and 1. Thenthe
values weresubtractedfrom 1.00,multipliedby255,and roundedto thenearestinteger.
Thisproduced viewablepixelvalueslinearlyrelatedto tonermass. A perfectlywhite
Tonermassimages, Pc(x,y),were usedonly forillustrationpurposes. Actualtonermass
calculations were performed onthe datamatrices C(x,y).
TheCD intheappendix ofthis thesiscontains all oftheillustrationsusedinthis
thesis since printed and copiedillustrationsare not alwayseasily observed. The readeris
referredto these illustrationsforthebest illustrationoftheexamplesdiscussed inthe
remainderofthis thesis.
4.1 Relative Toner Mass Distribution (Optical Analysis).
Figure 4.1 showsrelative cyantonermassdistributionimages, Pc(x,y),forthree
differentinput dotpatterns withthesamenominaldotarea fraction,Fn=
0.25, sentto the
printer. Theseprintedillustrationsofthetonermassimagesarenot ofhighquality, so
thereaderis referredto theCD intheappendix ofthis thesisforclearillustrations.
(I) (!!)
(III)|
|
|
t.m m-m 1
'ik^A^m,M>^ \ & & iH i
Relative Toner Mass=0.185 Relative Toner Mass=0.191
Relative Toner Mass=0.257
F=0.25 F=0.25
Fn=0.25
Thethreeoriginal dotpatternsineach experiment showninFigure 4.1 were
formedas clusters of2x2, 3x3,and4x4pixels,where each pixelmapped 1:1 onto printer
addressable units. The printer was a600 dpiHewlett-Packard 4500 colorprinter,so each
addressable unitis 1/600inches,or0.0423 millimeters.
Thetotalrelativetonermass on each printed samplewasfoundbysummingthe
massineachlocationinC(x,y),accordingtoequation4.2.
Relative Toner Mass=
f
fc(x,
y)dxdy (4.2)k
xy
The constant,k,inthisequationis defined asfollows,
k=jJCso.,d(x,y)dxdy (4.3)
whereCsoiid(x,y)isa sample ofthecyantonerprinted at adotareafractionof1.00. Since
theaverage value of Csoii_(x,y)=
1,thismeansk=
N,whereNisthenumberof pixelsin
theconcentrationmap,C(x,y). Inotherwords, the relativetonermassissimplythemean
value ofthematrixC(x,y).
Theidealprinter should printarelativetonermass of0.25 foreachdotpatternin
lessthan theidealamount oftoner. Thus,it isclearthattheamount of cyantoner that the
printerdeposits dependsontheinput halftonepattern. Inthisexample, theefficiencyof
tonerdeliveryto the paperdeclines asthesize oftheclustereddot declines. Thisis
consistent withtheearlyvisual observationsdescribedintheintroductionto this thesis.
Anotherobservation we canmakefrom figure 4.1 isthatsometonermassappears
tobe depositedbytheprinterinbetweenthedots. Therefore, ascanline analysisoftoner
massdistributionwascarriedoutasillustrated in Figure 4.2. The scanlinewas
performedbyaveragingtherelativetonercoverage,C, inthey-directionfor everyx
position. Bylookingat point(A)in figure4.2, itappearsthat thereissometonermass
deposited in betweenthedots. Thiswas asurprisingresult. Itwas expectedthatthere
wouldn'tbe anytonermassdepositedbytheprinterbetweenthedots especiallyfor
_>
b ST
s-_>
>
<
mm me
t
i
_&___i_l_--ie-i a n _t
^^^^^^^^^^P ^r IW *_F 1^
ii * * * *
M'iuik.
20 40 60
[image:58.532.132.384.49.312.2]Pixel Position
Figure 4.2: Scan Line ofCyan Toner Mass Distribution Image
Itwashypothesizedthatthenon-zerovalue at point(A)in Figure 4.2 mightbean
experimental artifact. A stray lightartifact,forexample,might resultinan apparent non
zero valuefortonerbetweenthedots. However,as illustratedintheprevioussection, a
stray lightartifactdoesnot seemtobea problem withtheinstrument.
Itwasalsohypothesizedthatsomekindof multiple reflection processbetweenthe
paper andthetonermightintroducean optical artifact ofsomekindand cause an errorin
theanalysisoftoner mass. Thus, aneffortwasmadetoreproduce such an effectinorder
tosee ifafalsereadingmightbe inducedto showtonermassbetweenthedotsas seenin
4.2 Test ofthe Multiple Reflection Hypothesis
Considertwocases in figure4.3,where inone case wehaveonlypaper andinthe
other case wehavepaper with sometonerdepositedonit. Figure 4.3-1shows some
possible lightpathsfor scattering lightthrough thepaper. The lightcantravellaterally
whilemaking itswaythrough thepaper. Forexample, infigure4.3-1, light AandB
travel laterally forgreaterlateral distancesinpapercompareto thelightC. Now,ifthere
issome amount oftonerprinted ontopofthepaperas showninfigure4. 3-II,multiple
reflectance oflightmightoccurbetweentonerand paper. Forexample, asshown in
figure4.3-II, lightAandBmightbe reflectedback intothepaperbythetoner. Onthe
otherhand, light Ctravelsonthesamelightpathin bothcases. Lightreflectedbackinto
thepaperhasanotheropportunitytoscatterto thebackofthepaper andbelost. Thus,
reflectance atthepaper/tonerinterfacemightbeexpectedtodecreasethetotalamount of
lightthatgetsthrough the sample. Thiswouldresult,intheopticaltonermassanalysis,
inan over-estimate ofthe totaltonerintheimage. Thiscouldrationalizetheobserved
(I)
_i
Air
1
1
A
__ __>
_.Paper Paper
Figure4.3: MultipleReflectance ofLight between TonerandPaper
Anexperiment wasdesignedtotestwhether multiplereflectance oflight between
toner and paperintransmittancemode could explainthisobservation. Aphotographic
transparency filmwithprintedlinesatvarious different line frequencies (0-10
cycles/mm)wasusedfor simulatingtonermaterial. Figure 4.4showstheinstrumental
design fortestingthe interaction betweentonerand paper. First,thefilmanda piece of
paper were placed incontactas showninfigure4.4-1. Thisconfiguration was intendedto
simulate printedtoneron paper with a maximum likelihoodof multiple reflectionsthat
couldreturnlight intothepaper. Thesecondconfiguration, showninfigure4.4-II, is
identical to thefirstexceptthat thepaperis3 cmbelowthefilmimage. Inthis case, no
(I) (II)
CCD Camera
^^Film
if' PlainPaper 4
CCD Camera Film
_] Film
3cm
3 Plain Paper
V
-7LightSource CVLight Source
Figure 4.4: Multiple Reflectance ofLight between TonerandPaper Configuration
Thecapturedtransmittanceimages in bothcases wereflat-fieldedagainstthe
imagescaptured withthefilmremoved. Thetransmittanceofinkandpaperwere
calculatedbydoing histogramanalysis. Figure 4.5 showstherelationship of
transmittanceofinkandpaperbetweenthetwo cases. Thetransmittancevaluesvary
significantlyacrossthefilm becauseofvariations inthefilmandbecause of variationsin
theinkthickness. However,whenthetransmittance values are compared point-by-point
onthefilmforthe twoexperimentalconfigurations, thelinear relationshipofFigure 4.5
is clearlyevident. Therefore,these datawereunableto detect any significantdifference
that couldberelatedtodifferentamountsofmultiple reflectancebetweenthepaper and
theinklayeronthepaper. Althoughtheabsenceof proofisnotthesame as a proof of
contributeto theexperimentalobservations. Thus,itappearsthatthe tonermass
measuredin Figure4.2at point (A)isanactualindicationoftonermassbetweenthedots.
-a ts S3 CL
0)
8-Oh
_-,
Transmittance
ofInkon.Paper
Transmittance of
Paper
0.1 0.2
[image:62.532.126.401.150.350.2]Film & Paper in Contact
Figure 4.5: Multiple Reflectances ofLight Between InkandPaperResult
4.3 Histogram AnalysisofTonerMass Distribution.
Figure4.6 showsseveralcyantonermassdistributionimages, Pc(x,y),andtheir
corresponding coveragehistogramsfromthecoveragematrix, C(x,y). Theimageswere
printedusingaclustereddot halftonewith a6x6halftone cell. Thethreesamples were
printedatnominaldotareafractions ofFn=
0.3, 0.5, and0.7. Thesamples were printed
using aHewlett Packard 4500 Color Laser Jetprinter. Froma visual inspectionofthe
coverage images,thereis nodoubtthat the totalamount oftonerisverymuchlarger in
increaseasthe total tonerconcentrationincreases. However,theareasinthese three
histogramsare approximatelythesame. This apparentparadoxiseasily explainedby
considering inmore detailthemeaningofthecoveragehistogram.
/|\ **_.*i_t,**<
.tf*a*jt*4#<NH
N *1? #**##*!
It#**####<*?.
r###**# _MM
(II) >++*+***++? 4* an) |.. if l.|f.i _a._-S__-_-*U_A*___*_ o s 1 1
Fn=0.3
Paper
w Toner
^1 -_ i
u
Z 0.02
c
l i
Fn=0.5
a
a"
u Paper Toner
0 0.5 1 1
Relative MassConcentration,c
0 0.5 1
[image:63.532.50.486.190.411.2]Relative MassConcentration,c Relative MassConcentration,c
Figure 4.6: Cyan Toner Mass DistributionwithFn=0.3, Fn=0.5, andFn=0. 7
4.3.1 Interpretation ofCoverage Histograms
Considertwoideal tonermassdistributionsas shownin figure 4.7. Thefirstcase,
figure4.7-1,consists of three tonermasspiles,eachwithapileheightof x. Thesepiles
aredistributedontopof atransparentlayerthatdoesnot absorbanylight. The second
case,Figure4.7-II, consists ofthesame amountoftoner. However,the toneris stacked
toadepthof3xina singlepile. The histograms forthese twocases areillustrated in
Thus,thehistogrampeak atthelowtonercoveragehasa relative areaof3. However,the
histogram forthe second case showspeakofheight 1 sinceonlyone "pixel"iscovered.
Thelocationofthepeak showsthatitrepresents acoveragethatisthreetimesasmuchas
thefirsthistogram.
(I)
Toner? f~n
| | ' "| x
Transparent Layer
(U)
It
H 3x
Toner ? |||\
/ Transparent Layer o [--, L 1 o G 0.2 Relative Concentration
r. , -6
Relative
[image:64.532.106.431.195.400.2]Concentration
Figure 4. 7: HistogramAnalysis oftheIdeal TonerMass Distribution
The histogramfunction, H(C), is aprobability densityfunction fortonercoverage,
C. Inordertofindtheaverage coverageofthe sample, ^coverage, thefirstmoment ofthe
probability densityfunctionmustbecalculated,as showninequation(4.4).
ltcoverage = JH(C)-CdC
For example,in Figure4.7,theproduct oftheheighttimesthecoverageis 0.6 inboth
casesillustrated. Thismeansthe totalamount oftonerintheexperimentalfieldof view
forthe twocases isthesame. Onlythedistributionis different. Nevertheless, theareas
underthehistogramsare quitedifferent.
Figure4.8 shows anidealclustereddot halftoneandtheidealcoveragehistogram
fortheimage at adotareafractionofFn=
0.5. Distributionoftoner,coupled with
experimentalvariability,will resultin histogrampeaksthatare muchbroaderthan the
ideal. Moreover,blurringofthe tonerimageby variousspreadfunctionsintheprinting
process will spreadthe tonerout, resulting intonerbetweenthedotsanda shiftofthe
histogrampeakfromzero coveragetosome valuesgreaterthanzero.
Cluster Dot Fn=
0.5
(6x6 Halftone Cell)
0.5
Paper Toner
0 0.5 1
[image:65.532.110.433.356.528.2]Relative Mass Concentration
4.3.2 InterpretingtheHistogramsin Figure 4.6
Alltheeffectsdescribedaboveare clearlyevidentintheexperimental histograms
ofFigure 4.6. In particular, thepeak
representingthepaperbetweenthedotsclearly
showsthata small amount oftonerhasbeendepositedbetweenthedots. Thus, thepeak
labeled "paper"
inthehistogram forFn=
0.3 is located slightlyabove zero. Asthe
nominaldot fractionincreases,thepeaksfor bothtonerand"paper" shift significantly
towardhighercoverage. Theterm"paper" nowdoesnotmean paperthatiscompletely
withouttoner. Thereisno area ofthesample withouttoner. Thebi-modaldistribution
that visuallylooks like dotsandpaperbetweenthedotsis reallytwodistinctcoverage
populations oftoner.
Noticethat the coveragehistogramof sampleIinfigure4.6 hasthetonerpeak
value atapproximately 0.7,whereasthe tonermasshistogram ofsample IIIhas atoner
peakvalueatapproximately 1.2. Itis becausetheopticalanalysis was calibrated with
respecttoa cyan sampleprinted at 1 00 %nominaldotareafraction,anditwas assigned
tohave arelativecyan massconcentration ofone. Itisevidentthat theheightoftoner
pile at adifferentnominaldot areafractioncanbe quitedifferent from 1.00. The
distributionoftonercanleadtopileheights insome areasthatare muchlargerthan1.00
and somethat are much shorter.
A significant observationfromtheexperimental resultsin figure 4.6 isthat the
peakcorrespondingtopaperbetweenthedots shiftsfromzero atFn=
0tohigher
observedisthat there couldbean optical artifactintheanalysis. However,asdiscussed
previously,the instrumentdoesnot sufferfromstraylightproblems, andthereisno
evidence fora significant contributionfrom internalreflectionsbetweenthe tonerandthe
paper. Thus,theobservedincreaseoftonermass onthepaperbetweenthedotsappears
tobea real phenomenon and notanexperimental artifact.
4.4 Toner Mass Versus Nominal Dot Area Fraction
Alargenumber ofsamplesof cyantonerwereprintedatdifferent dotarea
fractionsusingthe 6x6clusteredhalftoneillustrated in Figure 4.6. The opticalanalytical
techniquewas usedtodeterminetheaveragetonercoverage, u.Coverage, foreachsample at
eachnominaldotareafraction,Fn. Figure4.9showstheresults. The dotted linewas
sketched ontothegraphtohighlighttheapparent shape oftherelationship betweenthe
delivered tonermass andthe signal, Fn, sentto theprinter. ThepointatFn= 1
isthe
reference point. Thatis, therelativetonermassis 1.00bydefinitionatF
= 1
. This
clearlyshowsthat the total tonermassdelivered forFn=
0.95 is significantlygreaterthan
themassdelivered atFn= 1
0.2 0.4 0.6 0.8 1
[image:68.532.163.377.64.229.2]Nominal Dot AreaFraction,Fn
Figure 4.9: Relative Cyan Toner Mass Coverage Measured
OpticallyversusDot AreaFraction, Fn. (HP Laserjet4500)
4.5
Summary
oftheAnalytical TechniqueTheoptical analysisoftonermassdistributionhas been demonstratedtobea
reliable experimentaltechniquefortheanalysisoftonermass. Itis significantlymore
precisethangravimetric analysis,anditcanberesolvedspatiallytoshowthe
micro-distributionofthe tonermass.
Close examinationofthedatadescribedabove suggeststhree significant
observations. First,thehalftonepatternsentto theprinteris blurredduringtheprinting
process. This iscertainly notsurprising. However, thesignificance ofthisobservation is
that theprintingprocessinvolves apoint spreadfunction (atleastone)thatisa point
spreadfunctionintermsoftoner mass, PSFm(x,y). Printersare often modeled with
printerMTF orPSF functions,butthesearegenerallyexpressedintermsofthereflected
non-linearityof printers. Thus, intheprintermodel describedbelow, aPSFinter