BY NOMEKO T. MLOBELI
A thesis presented in partial fulfilment of the requirements for the degree of Master of Technology in Biotechnology and Bioprocess Engineering
The growth of Bifidobacterium bifidus on batch culture was investigated. Growth was studied with regard to growth rates, substrate utilisation rates, biomass yields and product formation rates. The organism was cultured on a variety of substrates and at different pH values. The objective was to determine whether different sugars or different medium pH values had any effect on specific growth rates, substrate utilisation rates, biomass yields and product formation rates.
B. bifidum (Hansen's strain) from a stock culture obtained from New Zealand Dairy Research Institute (DRI) was used for this study. The organism was grown on TPY medium supplemented with L-cysteine-HCl, sodium chloride, potassium chloride, magnesium chloride, potassium di-hydrogen phosphate, di-potassium phosphate and ammonium chloride. The experiments were carried out at uncontrolled and controlled pH.
At controlled pH, maximum growth of this organism was obtained on medium containing mixed sugars (glucose and lactose) at pH 5.5. On single carbohydrate sources, glucose, maltose and raffinose were readily utilised by this organism to give high rates of growth and formation of products. Very high concentrations of lactose were growth limiting. Lactulose and cellobiose were fermented but with low specific growth and product formation rates, while xylose was not fermented at all.
that the A: L (acetic acid to lactic acid) ratio of products was different at different pH.
ACKNOWLEDGEMENTS
I would like to sincerely thank my supervisor, Associate Professor Ian Maddox for giving the opportunity to work with him in this study. His constant guidance, supervision and encouragement was greatly appreciated.
I would also like to thank my co-supervisor, Dr. Noemi Gutierrez, for her guidance and supervision. I am deeply grateful to her assistance.
I would also like to thank Professor R. L. Earle (former Head of Department of Process and Environmental Technology) for allowing me the opportunity to do this work.
I am also grateful to the New Zealand Ministry of Foreign Affairs and Trade for giving me the scholarship during the period of this study.
I would also like to extend my appreciation and gratitude to the all the people who provided
the technical and laboratory assistance, namely. Mrs. A-M Jackson, Mr. J Sykes, Mr. M
Sahayam, Mr. M. Stevens, Mr. J. Alger, Mr. D. Maclean and Mr. B. Collins.
I would also like to thank my dear friends, Samuel Oppong for his friendship, encouragement and support, Kathy and Sam Hansen for their greatly appreciated friendship
and support throughout my stay in New Zealand.
TABLE OF CONTENTS
PAGE
Abstract ... ... ... ... . ... i
Acknowledgements . . . Ill Table of Contents . . . . . . iv
List of Tables . . . IX List of Figures . . . xi
CHAPTER 1 INTRODUCTION . . . I 1.2 OBJECTIVES OF THE STUDY ... ... ... 3
CHAPTER 2 LITERATURE REVIEW . .... . ... . ... ... 4
2.1 DESCRIPTION ... ... ... .... .... 4
2.1.1 Historical background ... ... .... ... . 4
2.1.2 Morphology ... .. ... 6
2.1.3 Identification ... .... ... .. ... .... ... . 6
2.2 ECOLOGY ... .... ... . ... ... ... 9
2.2. l Bifidobacteria in humans ... ... 9
2.2.2 Colonisation in humans ... ... 12
2.3 PHYSIOLOGY . . . 17
2.3.1 Respiration . . . 17
2.3.2 Temperature ... ... ... ... . 19
2.3.3 pH .. .. .... . . 19
2.3.5 Nutrient requirements ... .... 24
2.3.5.1 Nitrogenous matter ... 24
2.3.5.2 Trace elements ... ... 24
2.3.5.3 Growth factors ... 25
2.3.5.4 Lactoferrin ... .. ... 28
2.3.5.5 Lactulose and Lactitol ... 28
2.3.5.6 Oligoholosides and Oligosaccharides ... .. 29
2.3.5.7 Fructooligosaccharides (FOS) ... ... 29
2.3.6 Bile metabolism ... 30
2.3.7 Mucin metabolism ... 31
2.4 APPLICATIONS ... ... ... . .... ... . 31
2.4.1 Medical and health benefits ... 31
2.4.2 Bifidobacteria in food ... .... . ... 35
2.4.2.1 Bifidobacteria in dairy products ... . . ... 39
2.4.2.2 Selection of Bifidobacteria for use as dietary adjuncts ... ... .. . 40
2.5 CONCLUSION ... 42
CHAPTER 3 MATERIALS AND :METHODS ... 43
3.1 MA IBRIALS ... .. . .. ... ... . ... 43
3.1.1 Organism ... ... .... ... 43
3.1.2 Bacteriological media .... ... ... 43
3.1.3 Chemical reagents ... ... ... ... 43
3.1.5 Enzymes ... ... ... .... . 44
3. 1. 6 Equipment . . . 44
3.2 METHODS ... . ... .. ... ... ... 45
3.2.1 Cultivation ... . ... ... ... .. .. .. 45
3.2.2 100-rnl scale fermentation ... ... .. ... .... .. 46
3.2.3 1.2-L scale fermentation ... ... .... ... .... .. .... 47
3.3 ANALYSES ... .... .. .... .. .. ... ... ... ... 49
3.3.1 pH ... . ... ... ... ... .. ... 49
3.3.2 Biomass ... ... .. . . 49
3.3.2.1 3.3.2.2 Biomass calibration curve ... ... ... .. .. ... 49
Biomass concentration .. .. ... ... . ... 50
3.3.3 Substrate concentration .... .... ... .... ... 50
3.3.4 Ethanol and Acetic acid ... ... . ... .. ... 51
3.3.5 Lactic acid ... ... .... ... .. 51
3.3.5.1 Solution Preparation . . . 52
3.3.5.2 Reaction mixture . .. ... . ... .. 53
3.3.5.3 Sample preparation . . . . . . 53
3.3.5.4 Standard curve .. ... .... .... .. ... 53
3.3.5.5 Assay ... .. .. .... .. .... ... .. .... 54
3.3.6 Fannie acid .... ... ... ... ... ... .. 54
3.3.6.1 Reagents and Solutions . . . 55
3.3.6.2 Procedure ... .. ... . . . 56
CHAPTER4 RESULTS ... ... ... ... .... ... . ... 58
4.1 MORPHOLOGY ... 58
4.2 GROWTH OF Bifidobacterium bifidus ... . ... 58
4.3 INITIAL GROWTH AT DIFFERENT pH VALUES ... ... 59
4.4 GROWTH AT UNCONTROLLED pH ... . 62
4.4.1 Specific rate of growth ... ... ... ... . 63
4.4.2 Substrate utilisation ... 66
4.4.3 Product formation ... ... ... 70
4.4.4 Changes in pH during fermentation ... 78
4.5 GROWTH AT CONTROLLED pH ... ... ... 80
4.5.l Different substrates at pH 5.5 .. .. ... ... ... .... .... 81
4.5.1 Rate of growth ... ... . .... ... 81
4.5.2 Substrate utilisation ... ... . .. .... 83
4.5.3 Product formation ... ... 87
4.6 GROWTH AT MIXED SUBSTRATES .... . ... 93
4.6.1 Specific rate of growth ... .... 94
4.6.2 Substrate utilisation ... ... .. .. , .... ... 94
4.5.3 Product formation ... ... ... 95
4. 7 EFFECT OF pH VALUES ON GROWTH OF Bifidobacterium Bifidum ... 98
4.7 .1 Specific rate of growth ... 98
4.7.2 Substrate utilisation .... ... ... .. 100
4.7.3 Product formation ... .. ... 103
4.8.1 Product inhibition at pH 5.5 . . . 109
4.8.2 Product inhibition at pH 4.5 ... 110
CHAPTERS GENERAL DISCUSSION AND CONCLUSIONS ... 112
List of Tables
Table 1: Distribution of Bifidobacterium species in the human colon ... 12
Table 2: Vitamin production by Bifidobacterium ... 23
Table 3: Characteristics of the main bifidigenic factors .... ... .. . 27
Table 4: Fermented Mille Products containing bifidobacteria ... . .. . .... .. . 40
Table 5: Rates of growth of B. bifidum in bottle fermentation ... .. ... 65
Table 6: Rate of substrate utilisation ... ... .... . .. ... . 69
Table 7: Rates of Product formation ... 75
Table 8: Specific rates of product formation ... 75
Table 9: Fermentation balance and carbon recovery for B. bifidum ... 76
Table 10: Rates of substrate utilisation and yield . . . 82
Table 11: Rates of product formation .... ... ... ... ... ... ... 85
Table 12: Volumetric rates of product formation .... ... ... ... .. . 89
Table 13: Specific rates of product formation ... ... ... 89
Table 14: Fermentation balances in moles/mole of substrate and carbon recovery ... 91
Table 15: Growth parameters of B. bifidum growing in a mixture of glucose and lactose . .... .. ... . .. ... 96
Table 16: Specific rates of growth at different pH values ... 99
Table 17: Rate of glucose utilisation and yields at different pH values ... ... 101
Table 18: Rate oflactose utilisation and yields at different pH values ... ... 101
Table 19: Specific rates of production formation at different pH values . . . 104
Table 20: Specific rates of production formation at different pH values . . . 104
List of figures
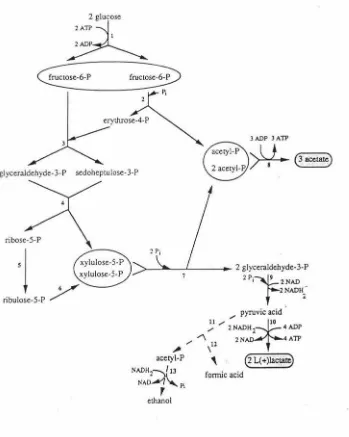
Fig. 1: The metabolic pathway of Bifidobacterium. . ... .... ... .. ... .. .. 21
Fig. 2: A picture of the fermentation apparatus used in the 1.2-L scale ... 48
Fig. 3: Plot of biomass produced versus time at different initial pH values ... ... 60
Fig. 4: Plot of products at t36 versus pH . .. ... ... ... 60
Fig. 5: Log (x) versus time at 10 g/L glucose .. . ... .... . ... . ... . .. .. .. . 63
Fig. 6: Log (x) versus time at 10 glL glucose ... 63
Fig. 7: Log (x) versus time 50 g/L glucose 64 Fig. 8: Log (x) versus time 50 g/L glucose ... .... .. .... ... ... . ... .... . 64
Fig. 9: Log (x) versus time at 10 g/L lactose ... ... ... .... .. ... 64
Fig. 10: Log (x) versus time at 50 g/L lactose . ... ... . ... 64
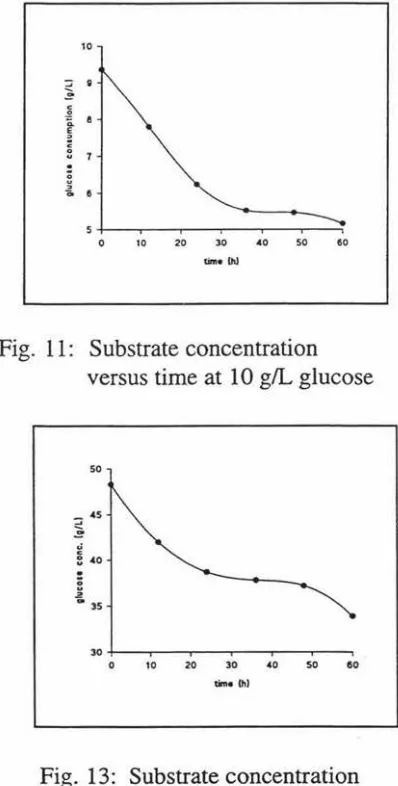
Fig. 11: Substrate concentration versus time at 10 g/L glucose ... 66
Fig. 12: Substrate concentration versus time at 10 g/L glucose ... .. ... ... 66
Fig. 13: Substrate concentration versus time at 50 g/L glucose ... ... ... 66
Fig. 14: Substrate concentration versus time at 50 g/L glucose .. ... . ... 66
Fig. 15: Substrate concentration versus time at 10 g/L lactose ... ... .. .... 67
Fig. 16: Substrate concentration versus time at 50 g/L lactose ... .. ... 67
Fig. 17: Substrate concentration versus biomass concentration at 10 g/L glucose ... 68
Fig. 18: Substrate concentration versus biomass concentration at 10 g/L glucose ... 68
Fig. 19: Substrate concentration versus biomass concentration at 50 g/L glucose ... 68
Fig. 20: Substrate concentration versus biomass concentration at 50 g/L glucose . . . 68
Fig. 21: Substrate concentration versus biomass concentration at 10 g/L lactose .... 69
Fig. 22: Substrate concentration versus biomass concentration at 50 g/L lactose . . . . 69
Fig. 24: Acetic acid concentration versus time at 10 g/L glucose . ... 71
Fig. 25: Acetic acid concentration versus time at 50 g/L glucose ... .. .. ... 71
Fig. 26: Acetic acid concentration versus time at 50 g/L glucose ... . ... 71
Fig. 27: Acetic acid concentration versus time at 10 g/L lactose .... .... ... 72
Fig. 28: Acetic concentration versus time at 50 g/L lactose ... .. ... . . 72
Fig. 29: Lactic acid concentration versus time at I 0 g/L glucose ... ... ... .... 72
Fig. 30: Lactic acid concentration versus time at I 0 g/L glucose .... ... 72
Fig. 31: Lactic acid concentration versus time at 50 g/L glucose .... .. .. .. .... .. 72
Fig. 32: Lactic acid concentration versus time at 50 g/L glucose . ... .. 72
Fig. 33: Lactic acid concentration versus time at 10 g/L lactose ... 73
Fig.34: Lactic acid concentration versus time at 50 g/L lactose ... 73
Fig. 35: Formic acid concentration versus time at 10 g/L glucose ... .. 73
Fig. 36: Formic acid concentration versus time at 10 g/L glucose .. ... .. .. .. ... . 73
Fig. 37: Formic acid concentration versus time at 50 g/L glucose ... 74
Fig. 38: Formic acid concentration versus time at 50 g/L glucose ... .. 74
Fig. 39: Formic acid concentration versus time at 10 g/L lactose ... . . 74
Fig. 40: Formic acid concentration versus time at 50 g/L lactose ... ... ... .. 74
Fig. 41: Plot of pH versus time ... . ... ... ... ... 78
Fig. 42: Log10 (x) versus time at controlled pH . .. ... 81
Fig. 43: Substrate concentration versus time at controlled pH ... ... 84
Fig. 44: Biomass produced versus substrate used ... ... 85
Fig. 45: Acetic acid concentration versus time ... .... 87
Fig. 46: Lactic acid concentration versus time . . . . . . 88
Fig. 48: Log10 (x) versus time ... ... ... ... 94
Fig. 49: Substrate concentration versus time ... . .. .. ... .... ... .. .... 94
Fig. 50: Acetic acid concentration ... . ... .. 95
Fig. 51: Lactic acid concentration . . . 95
Fig. 52: Formic acid concentration versus time ... 95
Fig. 53: Plot of Log10 (x) versus time at pH 4.9 ... 98
Fig. 54: Plot of Log10 (x) versus time at pH 6.5 ... ... .... .. .. 98
Fig. 55: Plot ofµ against pH ... .... ... ... ... ... 99
Fig. 56: Plot of substrate concentration versus time at pH 4.9 . . . 100
Fig. 57: Plot of substrate concentration versus time at pH 6.5 . . . 100
Fig. 58: Biomass concentration versus substrate used at pH 4.9 100 Fig. 59: Biomass concentration versus substrate used at pH 6.5 100 Fig. 60: Plot of Yield against pH . . . 101
Fig. 61: Acetic acid concentration versus time at pH 4.9 . . . 103
Fig. 62: Acetic acid concentration versus time at pH 6.5 . . . 103
Fig. 63: Lactic acid concentration versus time at pH 4.9 .... ... ... 103
Fig. 64: Lactic acid concentration versus time at pH 6.5 ... .... .... .. 103
Fig. 65: Lactic acid concentration versus time at pH 4.9 ... ... ... . 104
CHAPTER! INTRODUCTION
Micro-organisms evoke mixed opinions among people. They have an alarming or disgusting
aura surrounding them, so much so that any suggestion that the majority of them are trivial or even beneficial is rarely understood. However, this is so.
They play an important part in the cyclical changes that the biological elements undergo on
earth. Sewage treatment systems depend on them, but out of control they can be destructive. They ferment our foods, but foul food is dangerous. They aid our digestion, but upset our
intestines if they get out of control. This is to say that some are good and some are bad. Of particular importance in this study are the Bifidobacteria.
Bifidobacteria are indigenous gut organisms which are well adapted for metabolism in the gastro-intestinal tract of humans and animals (Biavati and Matarelli, 1991). They constitute
over 25% of the intestinal flora in healthy breast-fed infants, while Lactococci, Enterococci, and
coliforms represent less than 1 % of the population (Rasic, 1983).
The first organism of the bifidobacteria was isolated from the faeces of breast fed infants by
Tissier, who then called it Lactobacillus bifidus. Since their discovery by Tissier in 1900, a lot
of attention has been directed to the habitat, nutritional and immunological role, biochemistry
more detailed micro-ecological research into these organisms (Mitsuoka, 1984). At present,
bifidobacteria are reputed to play a very important role in nutrition and resistance to infection
in breast fed infants. Within the last decade, considerable interest has developed among
researchers, in the use ofBifidobacteria in foods, pharmaceutical and feed product application.
These organisms play a role in controlling the pH of the contents of the large intestine through
the production of lactic and acetic acids, which in tum prohibit the growth of many potential
pathogens (Rasic, 1983).
Bullen et al. ( 1977) found that enteric infections in children can be prevented or minimised
when their intestinal tract contains high levels of bifidobacteria. Recent research has focused
on establishing these bacteria as major influences on certain normal functions of the intestinal
tract and in exploring their role in human health and disease.
Bifidobacteria are used as dietary adjuncts or as starter cultures for yoghurt and other cultured
dairy products with the idea that such products may help the promotion of health. The effects
of the daily intake of such products are reported as ( 1) to suppress the putrefactive bacteria as
well as putrefaction, so as to prevent constipation and geriatric diseases, including cancer; (2)
to prevent and treat antibiotic-associated diarrhoea, and (3) to stimulate the immune response,
therefore contributing to a greater resistance to infection (Mitsuoka, 1992). Due to the reputed
therapeutic effects of these organisms, the Japanese have taken an active involvement in the
development and application of these organisms in foods (Mitsuoka, 1982; Yamakazi et al.,
feeiling dairy products containing large numbers ofbifidobacteria (Mitsuoka, 1982). It has also
been found that the feeding ofbifidobacteria, in conjunction with antibiotic therapy, can correct
intestinal conditions such as upset or irritable stomach (Hotta et al., 1987). Some workers
believe these organisms have anti-carcinogenic (Mitsuoka, 1982) as well as anti-cholesterolemic
(Hata et al., 1982) properties. Since 1986, the traditional microflora of yoghurt, Streptococcus
salivarius spp thermophilus and Lactobacillus delbruickii spp bulgaricus, has been enhanced
by a third bacterium belonging to the genus Bifidobacterium, and sometimes associated with
Lactobacillus acidophilus (Ballongue, 1993).
Clearly, not only are these organisms beneficial to mankind, but they are also unique. It is for
these reasons that they have drawn such an interest in researchers. However, little is known
about their physiology.
1.2 OBJECTIVES OF THE STUDY
The objective of this research is to study the growth of batch cultures of a selected strain of
Bifidobacteria. Growth will be conducted on a variety of substrates, such as glucose, lactose,
oligosaccharides, pectin and starch with regard to growth rates, substrate utilisation rates,
product formation rates, biomass yields, and product yields. The objective of using different
CHAPTER2 LITERATURE REVIEW
2.1 DESCRIPTION
2.1.1 Historical background
In 1900, Tissier discovered an organism, in the faeces of infants, that became known as Bacillus bifidus communis, (Ballongue, 1993). At about the same time, Moro, in Italy, discovered,
under similar conditions, an organism which he recognised as being different to that of Tissier, and which he identified as belonging to the genus Lactobacillus. Because of the differences, this new organism was named Lactobacillus bifidus (Ballongue, 1993). It was not until 1924 that Orla-Jensen described the genus Bifidobacterium and Bacillus bifidus communis was transferred into this genus and became known as Bifidobacterium bifidum (Mitsuoka, 1982;). Despite this transfer, the name Lactobacillus bifidus was reported in the seventh edition of Bergey's Manual (1957). Thus, for many years, bifidobacteria were included in the genus Lactobacillus as Lactobacillus bifidus, but they are now classified in a separate genus
Bifidobacterium, as suggested by Orla-Jensen, since the 8th edition of the Bergey's Manual,
1974, (Modler ~ al, 1990), on the basis of their characteristic morphology, biochemical characters, cell wall constituents, and DNA base composition (Mitsuoka and Kaneuchi, 1977; Scardovi, 1986; Biavati et al., 1991).
(Mitsuoka et
ill.,
1977), but on the basis of carbohydrate fermentation, several more species andbiotypes were identified. Since 1957, when Dehnert recognised the existence of multiple
biotypes of bifidobacteria (Mitsuoka, 1984), the taxonomy of these organisms has been a
subject of great interest.
Early distinction between species of this genus was based on carbohydrate fermentation
patterns. By 1963, Reuter proposed seven members of the genus Bifidobacterium and he
differentiated these on the basis of fermentation and serological features (Scardovi ~ al., 1969; Matteuzi~gJ., 1971; ScardoviandCrociani, 1974; Scardovi and Zani, 1974; Trovatelli et al.,
1974; Mitsuoka, 1977 ). Since 1970, this genus has further expanded, mainly through the use
of DNA/DNA hybridisation or polyacrylamide gel electrophoresis of sodium dodecyl sulphate
solubilised whole cell protein extracts (SDS-P AGE) (Matteuzi, 1971; Biavati et al., 1982;
Mitsuoka, 1990). Through the use of this technique, eleven (11) different species can be described (Ballongue, 1993) and it soon came to light that some species were synonymous, e.g.,
B. lactentis, B. liberorum and B. infantis have been combined to form a single species under
the name, B. infantis and B. breve and B. parvulorum came under a single name of B. breve
(Scardovi et al., 1971).
In the last few years, more species have been described . Twenty four (24) species are classified
under this genus in Bergey's Manual (Scardovi, 1986). However, more species have been added
to the genus since then. At present twenty nine (29) species are now validly recognised, of
honey bees and two (2) have been isolated from sewage (Ballongue, 1993).
2.1.2 Morphology
Bifidobacteria are Gram positive bacteria of varying morphology. They are rods of various
shapes; club shaped or spatulated -single or in chains of many elements, in star-like aggregates
or disposed in V' or palisade arrangement. They are non-acid-fast, non-sporing and non-motile.
These organisms are anaerobic though some species can tolerate oxygen (02), but only in the
presence of carbon dioxide (C02). The colonies are smooth, convex, entire edges, cream to
white, glistening and of soft consistency (Scardovi, 1986).
2.1.3 Identification
Methods of identification of species of Bifidobacterium are still not completely reliable
(Mitsuoka, 1984 ). Morphology of these organisms provides little help in their identification at
genus level This is because of the similarities they have with Lactobacillus. However, on the
species level, morphology may be more relevant as a tool of identification, as many species
show unusual and unique morphological traits. Such traits include disposition and number of
branchings, cell contours, dimensions, and arrangement in groups, and are characteristic for many Bifidobacterium species growing in trypticase- peptone-yeast extract (TPY) medium
(Biavati et al., 1991).
and Actinomyces. However, Bifidobacterium ferments hexose through a special metabolic pathway, the so-called bifid shunt, with fructose 6-phosphate phosphoketolase as the characteristic key enzyme. This enzyme seems to be absent when other anaerobic Gram positive bacteria with bifid-like morphology (Actinomyces, Arthrobacter, Corynebacterium and Propionibacterium) are tested with fructose 6-phosphate as the substrate (Scardovi and Trovatelli, 1965). Therefore the presence of this enzyme, fructose 6-phosphate phosphoketolase, in cellular extracts is the most reliable characteristic for identification of the genus, Bifidobacterium. The presence of this enzyme is demonstrated by a colour reaction (Scardovi, 1986; Biavati et al., 1991) or by starch gel electrophoresis (Scardovi et al., 1971). The starch gel electrophoresis method allows for the discrimination of three different types of Bifidobacterium - the animal, the human, and the honey bee types.
Identification of the fermentation products is an alternative method of primary differentiation of Bifidobacteria from related groups (Biavati et al., 1991). This approach involves the determination of organic acids at the end of fermentation, notably acetic acid and lactic acid. They are normally produced in the ratio 3:2. In addition, species of the genus Bifidobacterium produce the L+ isomer of lactic acid (Ballongue, 1993). However, measurement of fermentation end-products is sometimes difficult to interpret, as side reactions give variable amounts of formic and succinic acids, as well as ethanol, and so give an unexpected pattern (Biavati et al., 1991).
band, which migrates the same distance for all species, except B. boum, where the distance of
migration is slightly greater from the anode (Biavati et
,ru.,
1982). The presence of this band cantherefore be used as a clear indication that an unknown organism belongs to this genus.
Analysis of the cell composition with regard to lipids and phospholipids of the cell wall and
membrane is a good criterion for differentiating between the genus Bifidobacterium and
Lactobacillus. Both genera contain disphosphatidylglycerol and phosphatidylglycerol.
However, only Bifidobactrium contains polyglycerolphospholipids and their lyso-derivatives,
alanylphosphatidylglyceol, and the lyso-derivatives of diphosphatidylglycerol (Ballongue, 1993).
Species identification is generally accomplished by isozyme patterns in starch gels for
transaldolase and 6-phosphogluconate dehydrogenase (Biavat~ ~.al.., 1991), supplemented with
either a limited number of fermentation tests, or with the electrophoretic migration of
3-phosphoglyceraldehyde dehydrogenase (Mitsuoka and Kaneuchi, 1977; Ballongue, 1993).
Another important parameter in the identification of bifidobacteria is the murein type of the cell
wall (Lauer and Kandler, 1983). The type of peptidoglycan allows discrimination of closely
related species (Biaviati ~ al., 1991). DNA/DNA hybridisation is also important in
identification of these organisms (Scardovi et
,ru.,
1979). However, this method is laborious andcannot be carried out on a routine basis in most laboratories, as it needs a large number of
Recent studies show that phenotypic characterisation of Bifidobacterium strains can help in
resolving the taxonomic problems encountered in this genus (Biavati et al., 1991 ), although they
will probably never allow clear-cut discrimination of all present and future species.
2.2 ECOLOGY
Bifidobacteria have been isolated from diverse ecological niches. These include faeces of
humans, the rumen of cattle, sewage, the human vagina, dental caries, and the honey bee
intestines (Biavati et al., 1991). These organisms are also found in the intestines of various
other animals, including chickens, dogs, pigs, mice, rats, hamsters, rabbits, horses, and monkeys
(Mitsuoka, 1977). However, the numbers and consistency varies from animal to animal. In the
intestinal tract of human adults and animals, bifidobacteria coexist with a large variety of
bacteria, most of which are obligate anaerobes (Biavati et al., 1991).
2.2.1 Bifidobacteria in humans
Bifzdobacterium constitutes a numerically major part of the faecal flora of various age groups
of healthy humans, (Mitsuoka and Kaneuchi, 1977). These investigators found that
Bifidobacterium appeared on the second to the fifth day of life and continued to be one of the
most numerous bacteria amounting to about 1010/g of stools, although in children, adults, and
anaerobic Gram-positive cocci were more numerous and usually outnumbered bifidobacteria.
In elderly persons, the occurrence and numbers of bifidobacteria decrease significantly or
disappear (Mitsuoka, 1990).
Since these organism were discovered, it was generally believed that they were found
exclusively in the faeces of breast-fed infants whereas in bottle-fed infants Lactobacillus
acidophillus was the most numerous organism. However, studies have shown that the
differences in the occurrence and numbers of bifidobacteria between breast fed and bottle fed
infants were not significant (Mitsuoka and Kaneuchi, 1977). Bifidobacteria were found present
in all of 30 breast fed and 29 of 30 of bottle fed infants, with approximately the same mean
coW1tS (Scardovi, 1986). This author found that the principal difference between breast fed and
bottle fed infants was that the number of Enterobacteriaceae, streptococci and other anaerobes
were present in significantly greater numbers in bottle fed infants than in breast fed infants.
There are definite differences in the Bifidobacterium species isolated from humans of different
age groups and from animals (Mitsuoka, 1992). These differences are shown in Table 1. The infant type Bifidobacterium species are never isolated from children or adults, and animal type
Bifidobacterium species are never isolated from the intestines of humans (Mitsuoka, 1990).
The most common bifidobacteria isolated from infants belong to B. infantis and B. breve.
Bifzdobacterium bifzdum, B. longum, and B. adolescentis are occasionally isolated from infants.
In contrast, B. adolescentis and B. longum are found in high numbers in the intestines of
Bifidobacterium longum and B. adolescentis biovars A and B are found in monkeys, while B.
adolescentis biovars C and D and B. pseudolongum are found in dogs. Most of the pig and
cattle strains are identified as B. pseudolongum and B. thennophilum. Chickens commonly
harbour B. pseudolongum, B. gallinarum, and B thennophilum. In the intestines of mice and
rats, B. pseudologum and B. animalis are found, while guinea pigs and rabbits harbour B.
animalis and B. magnum (Mitsuoka, 1990).
Bifidobacteria can colonise the intestinal tract (Mitsuoka, 1989). Colonisation varies,
depending upon the specific bacterium-to-host affinity that also includes individual differences.
Many studies have shown that bifidobacterial colonisation sometimes fails in some infants
(Tomkins et ill., 1981; Stark and Lee, 1982). However, these authors were uncertain as to why
some infants and some nurseries are deficient in faecal bifidobacteria. Studies showing bifidus
deficiency do not rule out the possibility that the deficiency is caused by the administration of
antibiotics to the mother during and after pregnancy (Mitsuoka and Kaneuchi, 1977).
The greatest density of bacteria is found in the distal end of the small intestine, where most of
the lactobacilli are found. Bifidobacteria have been found to be more prevalent in the large
Table 1: Distribution of Bifidobacterium species in the human colon Population Breast-fed infants Dottle-fed infants Children Adults Old aged Predominating species
ll. longum
!1. in/antis B. breve
B. adolescentis
n. in/antis, B. breve,
B. bifidum biovar b,
B. longum
B. adolescelllis biovars a and b,
B. longum
B. adolescentis biovar b, .
ll. /ongum
Source: Ballongue, 1993
2.2.2 Colonisation in humans
Minor species
B. bifidum biovar b
B. bifidum biovar a
It is generally believed that at the time of birth, a foetus is completely surrounded by a sterile
environment. After birth, the digestive tract is rapidly colonised by bacteria (Mitsuoka et al.,
197 4; Bezirtgou, 1985). Most bacteria appear within the frrst 48 hours after birth, but
bifidobacteria appear only between 2 and 5 days (Mitsuoka, 1974) and become dominant barely
one week after birth at 1010-1011/g of stools. These organisms appear to reach a level of 99%
of the faecal flora, while levels of other bacteria decline sharply by up to 1000-fold (Hoffmann,
1966). Most anaerobes and other putrefying bacteria are greatly reduced or completely
[image:27.554.80.397.117.322.2]Studies show that bifidobacteria enter the body of the neonate by the oral route. Mutai and
Tanaka (1987) isolated and observed Bifulobacterium, Propionibacterium, Peptostreptococcus,
Fusobacterium, Enterococcus, La.ctobacillus and Enterobacteriaceae from the mouths of 23
neonates 10 minutes after birth. These neonates were born through the vaginal tract. Of the
9 neonates born by caesarean birth that were investigated, only Propionibacterium and
Enterococcus were isolated in 8 of the 9. Mitsuoka et al. (1974) isolated bifidobacteria in 41 %
of infants born by the genital route, while Bezirtglou ( 1985) found them in 21 % of infants aged
4 days and born by the caesarean route. However, this author reported an increase to 41 % 15
days after birth.
There appears to be several factors, besides the method of delivery, which influence colonisation
of neonates by bifidobacteria . These are;
(i) Prematurity
It appears that bifidobacteria find it difficult to implant at this stage, due to a lack of
receptors and/or endogenous substrates. On the other hand, enterobacteria and
Bacteroides readily colonise the colon (Hoffmann, 1966; Stark and Lee, 1982;
(ii) Method of feeding
Bifidobacteria are believed not to be present in mother's milk (Bezirtglou, 1985).
However, Mayer and Moser (1950) isolated B. bifidum from the colostrum and
milk of a mother just before she breast fed (Ballongue, 1993).
Early studies suggested that bifidobacteria were the dominant intestinal flora of breast fed
infants while lactobacilli were dominant in bottle fed babies. However, subsequent research
disproved this belief. It has been found that there is no apparent difference in the qualitative
distnbution of species between these two types of feeding. The difference, instead, lies in the
quantitative level of the proportion of Bifidobacterium to other species (Braun, 1981; Mitsuoka, 1982; Benno~ .al., 1984; Moreau et al., 1986). Therefore, the main difference lies in the maintenance of high levels of optional aerobic species, E. coli and Streptococci, which
initially colonise the digestive tract and thus lead to the establishment of anaerobes, Bacteroides, Clostridium, Eubacteria, Peptostreptococcaceae, Enterobacteriaceae and Streptococcus
(Mitsuoka and Kaneuchi, 1977; Mitsuoka, 1989). The appearance of Bifidobacterium comes
later than this (Neut et al., 1981).
Changes in the faecal flora are observed at weaning. Due to the change in diet, the numbers of bifidobacteria decrease sharply in some children, though remain stable in some
Ballongue (1993) suggested that the discrepancies in these findings are due to the different
techniques used in identifying the strains. Some workers, especially the Japanese, used
carbohydrate fermentation to identify the strains, while the Italians used DNA/DNA
hybridisation.
Human milk contains a high concentration of lactose. It also contains lactoferrin and lactulose,
a low concentration of proteins used by putrefying bacteria, and it has a low buffering capacity
(Bullen et al., 1977). These factors are essential to development of bifidobacteria in the
intestines.
In 1930, Polonowski and Lespagnol isolated oligosaccharides other than lactose from human
milk, which they named gynolactose and allolactose
[-D-galactopyranosyl-(1,6)-D-glucopyranose] (Ballongue, 1993). When Levesque et al. (1960) administered high quantities
of N-acetyl-glucosamine to infants with low levels of B. bifzdum, they observed that this species
then appeared in the stools of the infants and then disappeared when the administration was
stopped (Ballongue, 1993). Other workers, Inoue and Nagayama (1970) observed that when
children were fed milk containing added porcine and mucin, the pH of the stools dropped and
the bifidobacteria levels rose. All this seems to suggest that there are numerous substrates
(iii) Endogenous substrates
These are substrates which exist in the digestive tract without a dietary source. They are
produced by the host and may be used by bacteria. Hoskins and Boulding (1976) reported that
some strict anaerobic bacteria produce enzymes that are able to degrade blood group antigens
and mucin oligosaccharides. Included in these bacteria are B. bifidum and B. infantis. They
are able to remove the N-acetyl-D-galactosarnine residues from the blood group A factors and
also secrete a-L-fucosidases, sialidases and B-glycosidases (Neutra et al., 1987).
(iv) Environment
Mitsuoka et al. (1974) isolated mainly B. infantis from the stools of Japanese infants but 10
years later, B. breve was recognised as the dominant species. It is believed that the country,
hospital and even the unit within which a delivery takes place influences the rate of colonisation
by Bifulobacterium (Mitsuoka, 1992). It is suggested that obstetrical and therapeutic customs
play a role in the colonisation of neonates by these organisms. It even appears that very strict
hygienic conditions delay the implantation of Bifidobacterium (Sihmon et al., 1982; Yoshioka
2.3 PHYSIOLOGY
2.3.1 Respiration
Bifidobacteria are strictly anaerobic, though there is some degree of oxygen-tolerance
depending on the species and culture medium (De Vries and Stouthamer, 1969; Scardovi,
1986).
De Vries and Stouthamer (1969) observed that when growth conditions are switched from
anaerobic to aerobic, three types of response are observed. First, aerobic growth is observed,
with no accumulation of hydrogen peroxide. Generally, a strain of B. bifidum, which is
aero-tolerant, forms small quantities of hydrogen peroxide by NADH oxidation. The absence of
hydrogen peroxide in aerobic culture is explained by the measure of an unknown peroxidase
system which can destroy the hydrogen peroxide. Secondly, there is limited growth, with
accumulation of hydrogen peroxide. The accumulation of peroxide is considered to be toxic
for the fructose 6-phosphoketolase. Finally, no growth is observed, and no accumulation of
hydrogen peroxide occurs.
When carbon dioxide is present, the sensitivity to oxygen varies considerably, depending on the
strain. Among the strains that are able to grow in the presence of oxygen, some remain catalase
negative, and others become catalase positive. For some strains, the presence of catalase is
absorption of oxygen by five strains of bifidobacteria of human origin has shown that the partial
pressure of oxygen falls in the medium during the multiplication of these strains (Shimamura,
1989). The endogenous absorption of oxygen is linked to the presence of NADH oxidase. It
takes place even in the absence of glucose and appears to depend directly on the quantity of
polysaccharides accumulated in the cells. All the five strains accumulated hydrogen peroxide
which is subsequently reduced by NADH peroxidase though the activity of the enzyme varied
according to the strain investigated. The strain most sensitive to oxygen had low NADH
peroxidase activity, resulting in the accumulation of toxic hydrogen peroxide.
When Bifidobacteria are cultivated for industrial application, it is important to prevent the toxic
effects of oxygen. Prevention of oxygen toxicity is especially crucial during manufacturing and
processing of biomass and ensuring cell viability during storage of products containing these
organisms. Shimamura et al. ( 1990) have reported that Bifidobacterium species exhibit oxygen
uptake which results from reduced NAD-(NADH)-oxidase activity. In a study to elucidate the
mechanisms with which enzymatic activities in Bifidobacterium species are correlated with the
apparent sensitivity to oxygen, Shimamura et al. (1992), found that these organisms express
reduced NAD-oxidase and peroxidase activities. These activities function in a pathway for
two-electron reduction of molecular oxygen, thus producing hydrogen peroxide, and subsequently
water. They concluded that reduced NAD-oxidase and reduced NAD-peroxidase in these
2.3.2 Temperature
The optimum temperature for growth of the species isolated from humans is 36°-38°C, and
41°-43°C for the species isolated from animals. Some of the latter may even grow at 46.5°C.
Below 20°c, there is no growth at all, and the organisms show no thermo-resistance above
46°C. B. bifidum dies at 60°C (Scardovi, 1986; Biavati et al., 1991 ).
2.3.3 pH
The optimum initial growth pH is 6.5-7.0 and no growth can occur below pH 5.0 or above pH
8.0 (Scardovi, 1986; Biavati et al., 1991).
2.3.4 Metabolism
(a) Sugar metabolism
Hexoses are degraded exclusively and specifically by the fructose 6-phosphate pathway.
Fructose 6-phophoketolase is the key enzyme in this pathway, while glucose 6-phosphate
hydrogenase is absent (Scardovi and Trovatelli, 1965; De Vries and Stouthamer, 1967).
Generally, the fermentation of two glucose molecules leads to the formation of 3 moles of
acetate and 2 moles of L(+) lactate. In reality, pyruvic acid can be broken down via two
pathways; (i) reduction of the pyruvate to form L( +) Lactate by L( +) dehydrogenase, whose
activity is controlled by fructose 1,6-diphosphate, and (ii) the splitting of the pyruvate by
subsequently reduced to form ethyl alcohol and so generate NAD. The proportions of the
products of fermentation vary considerably from one strain to another and even within the same
species. Small quantities of succinic acid are produced by some strains and a small amount of
carbon dioxide may be produced during the degradation of gluconate (Scardovi, 1986; Biavati
et al., 1992) (Figure 1).
In an experiment to determine the fermentation of glucose, lactose, galactose, mannitol and
xylose by Bifidobacterium species, DeVries and Stouthamer (1969) found that glucose was
always fermented completely. Working out the fermentation balances, the authors found that
bifidobacteria converted pyruvate from the fructose 6-phosphate phosphoketolase route by two
paths. In the first path, pyruvate is reduced to L( +) lactate by the action of L( +) lactate
dehydrogenase and requires fructose-1,6-diphosphate for activity. In the second path, cleavage
of pyruvate into acetyl phosphate and formate by the phosphoroclastic enzyme takes place.
Some of the acetyl phosphate formed is reduced to ethyl alcohol. These authors also found that
the amount of pyruvate converted via either pathway is influenced by the growth substrate.
It appears that there are three factors which determine the choice of pathway taken. The frrst
is the relative amounts of phosphoroclastic enzyme and lactate dehydrogenase. A second factor
is the amount of fructose-1,6-diphosphate present in the cell. Finally, a different affinity of
lactate dehydrogenase and the phosphoroclastic enzyme toward pyruvate, might explain the
differences in the fermentation balances between different substrates (De Vries and Stouthamer,
2A~ ~:se
~
gl yceraldeh yde- 3-P sedoheptu I ose-3-P
Figure 1:
. : : - - - ' - - - 2 glyceraldehyde-3-P
2Pir2NAD _ 2NADH
~
·.
_,,. pyruvic acid
; ; _,,. 2 N A D 42 lO 4 ADP _,,. "'\ 2N 4ATP
~ ,12
acetyl-P ~ (2 L(+)!atjii.~
NADH2){ 13 formic acid
N AD""""'7 '
,
Pi ethanolThe metabolic pathway of Bifi.dobacterium.
l = hexokinase and glucose-6-phosphate isomerase; 2 = fructose-6-phosphate phosphoketolase; 3 = transaldolase; 4 = transketolase; 5 = ribose-5-phosphate isomerase; 6 = ribulose-5-phosphate epimerase; 7 = xylulose-5-phosphate phosphoketolase; 8 =acetate kinase;
9 = homofermentative pathway enzymes; l 0 = L( +) lactate dehydrogenase; 11 = phosphoroclastic enzyme; 12 =formate dehydrogenase (EC 1.2.1.2); 13 =alcohol dehydrogenase (EC 1.1.l.l)
[image:36.555.111.460.100.537.2](b) Enzymes
The characteristic enzyme of the sugar metabolism is fructose-6-phosphoketolase (F6PPK)
(Scardovi and Trovatelli, 1965; De Vries and Stouthamer, 1967). This enzyme is specific to
the genus and is absent from the anaerobic bacteria which could be morphologically confused
with the bifidobacteria. According to Biavati et al. ( 1986), there are three different types of
this enzyme, depending on the ecological source of the strain, be it mammalian, bee or man.
The animal type has actually been purified (Sgorbati et al., 1976).
In addition, 14 isoenzymes of transaldolase and 29 isoenzymes of 6-phosphogluconate
dehydrogenase have been identified (Ballongue, 1993).
( c) Vitamins
Deguchi et al. (1985) have studied and found that bifidobacteria of human origin synthesise six
water-soluble vitamins, namely, thiamine(B 1 ); riboflavin (B9); pyridoxine (B6); folic acid (B9);
cyanocobalamine (B 12) and nicotinic acid (PP) (Table 2). With the exception of riboflavin, all
the other five are synthesised by most of the human strains. These authors also observed that
the concentration of the vitamin accumulated varied widely among different species or strains.
For thiamine, nicotinic and folic acid, the concentration produced was higher in B. bifidum and
B. in/antis (higher-accumulators) than in B. breve, B. longum and B. adolescentis
quantities of the vitamins (non-accumulators).
Table 2: Vitamin production by Bifidobacterium
B. breve B. i11fa11tis
n.
longum B. bijidum B. adolescentisThiamin (Bl) + +++ + +++ +
Riboflavin (B2) + + +++ ++ +
Pyridoxine (B6) ++ ++ +++ + ++
Folic acid (B9) + +++ + ++ +
Cobalamin (B12) + ++ +++ + +
Ascorbic acid (C) ++ ++ +++ ++ +
Nicotinic acid (PP) +++ +++ + +++ +
Biotin (H) ++ +++ ++ ++ ++
Source: Ballongue, 1993
As far as vitamin requirements are concerned, there seems to be no rule for the
Bifidobacterium. Strains of human origin seem to need Bl, B6, B9, B12 and PP for their
growth (Deguchi.ci; al., 1985; Teraguchi .ci; al., 1987). It appears added vitamins are required
2.3.5 Nutrient requirements
2.3.5.1 Nitrogenous matter
Most species are able to utilise ammonia and ammonium salts as the only source of nitrogen,
though there are some strains which develop only in the presence of organic nitrogen.
In
vitro, and in the absence of any organic source of nitrogen, bifidobacteria may synthesiselarge quantities of amino acids (Matteuzi et
.al.,
1978). Tanaka (1987) found that the glutaminesynthetase and glutamate dehydrogenase of Bifidobacterium may be involved in the assimilation
of nitrogenous compounds by these organisms.
2.3.5.2 Trace elements
B. bifidum grows only in the presence of magnesium, manganese, and most important, iron.
Iron is assimilated by this species in both oxidation forms, depending on the acidity of the
medium (Bezkorovainy et al., 1986; Bezkorovainy and Topouzian, 1981; Ueda~ al., 1983). Fe 2+ is used at pH 5 and its transport depends on a membrane A TPase and its incorporation
may be completely inhibited by zinc (Bezkorovainy
~
_fil., 1986). Fe3+ is used at neutral pH.Through the intermediary of ferroenzymes, iron is involved in the production of acetic acid by
2.3.5.3 Growth factors
Experiments have shown that the species of Bifidobacteria require the presence of growth
factors of various types (Poch and Bezkorovainy, 1988). Most species of this genus are unable
to grow in a totally synthetic medium and require complex biological substances such as bovine
casein digestate, lactoserum of bovine milk, porcine gastric mucin or yeast extract (Poch and
Bezkorovainy, 1988). Only B. adolescentis and B. longum can grow on unsupplemented
medium. To date, five growth factors have been identified. These are bifidigenic factors,
lactoferrin, lactulose and lactitol, oligoholosides and fructooligosaccharides.
(a) Bifidigenic factors
There are three main groups of these factors and they differ according to species. They are BB,
BI and BL factors (Table 3).
The BB factors include BBa and BBb and are characterised as the elements in human milk
which do not lose their stimulant activity for B. bifidum var. a and var. b respectively after
heating or irradiation. BBa factors are found mainly in yeast extracts, liver extracts, lyophilised
milks, bovine casein hydrolysate, and porcine mucin (Raynaud, 1959; Bezkorovainy, 1979).
BBb factors are found in colostrum, human milk, rat milk (Gyorgy et al., 1954), human casein
There are three groups of natural BB factors. They are;
(i) Gyorgy's bifidus factor 1 or BFl, which is found in milk and colostrum and in the form of
gynolactose which is particularly active on variant b. It appears that the presence of an
N-acetylglucosarnine structure in the oligosaccharide structure is essential but not sufficient to the
expression of bifidigenic activity (Seka Assy, 1982). B. bifidum var. pensylvanicus has
N-acetyl-D-glucosaminidase activity which is considerably higher than that found in the other
bifidobacteria (Desjardins and Roy, 1990). Native human casein or its trypsin hydrolysate
consisting of glycoproteins may be effective for B. bifidum var. b (Bezkorovainy et al., 1979;
Seka Assy, 1982). Trypsin or chymotrypsin hydrolysis of native human K-casein gives fractions
containing 60-70% sugars of galactose, glucosamine and galactosamine, which are themselves
active. Mucins (glycoproteins and mucus) are produced and secreted by the mucus cells of the
salivary glands, oesophagus, stomach, small intestines and colon (Allen, 1984). They are the
major part of mucus (Forstner et al., 1984) and consist of70-80% sugar (Allen, 1981). Porcine
gastro-intestinal mucins and the meconium are an abundant source of BB factors.
(ii) BF2 factors, which are found in a strain of B. Bifidum var. a. They appear to consist of
non-glycosylated peptides obtained by action of a protease on casein.
(iii) Glycoproteins, which are isolated from human colostrum and milk lactoserum. They
appear to be effective for both variants and their activity seems to be related to the sugar
BI and BL Factors
BI factor stimulates growth of B. inf antis and is destroyed by lyophilisation.
BL factor activates the growth of B. longum and is sensitive to heating and irradiation.
Both factors are proteins and are abundant in plant, liver and milk extracts (Beerens et al.,
1980). The BI factors from human milk are of two types. One is the thermo- and radiolabile
BI and the other is the thermo- and radiostable BI.
Table 3: Characteristics of the main bifidigenic factors
Resistance
Bifidigen factor Species a:mcemed Source Heat Ray. Lyoph. Active structure
BB BFl B. bifidum var. b Milk and colostrum + + N-acetylglucosamiae
Human casein gl ycoproteins
hydrolysate Mucins
BF2 B. bifidum var. a Casein hydrolysate + + Nonglycosyled peptide
GI ycoproteins B. bifidum var. a Human milk and Glucidic part
B. bifidum var. b colostrum
BI B. in/antis Plant extracts
=
=
Proteic part Liver extractsMilk
BL B. longum Plant extracts Proteic different from
Liver extracts BB factors
Milk
2.3.5.4 Lactof errin
Lactoferrin and its three metal complexes iron, copper and zinc have a promoting effect on the
growth of eight species of Bifidobacteria, five of human origin and three of animal origin, at the
beginning of the logarithmic phase of growth. These lactoferrin-metal complexes show an
antibacterial activity against E. coli and Staphylococcus aureus (Shimamura, 1989).
2.3.5.5 Lactulose and Lactitol
Lactulose, a disaccharide (4-0-beta-galactopyranosyl-D-fructose) is a constituent of dairy
products which have been subjected to heat treatment and is not present in raw milk.
In vivo, lactulose can increase the growth of B. bifidum. However, this factor is not active in
vitro and is not present in the free state in the mother's milk. Its action is due to the fact that
it is more resistant to degradation by digestive tract lactases than is lactose and can therefore
be used massively by Bifidobacteria (Ballongue, 1993). Y azawa et al. (1978) found that
lactulose is not used specifically by bifidobacteria and may also be utilised by other intestinal
bacteria. Lactitol is considered to be a bifidigenic factor with a less marked effect (Mitsuoka
2.3.5.6
Oligoholosides and OligosaccharidesBifidobacteria utilise raffinose, stachyose, inulin and other oligosaccharides with molecular
weight of less than 4500 (Y azawa kt
.al.,
1978). Other intestinal bacteria such as E. coli,L. acidophilus and S. faecalis do not. Oligosaccharides higher than the trisaccharide of inulin
and the tri-to penta-saccharides of dextran are also metabolised by species of Bifidobacteria.
However, the oligosaccharides of amylose and cellulose are not only metabolised by
Bifidobacteria, but may be used by other bacteria.
2.3.5.7
Fructooligosaccharides (FOS)These are polymers of fructose with a degree of polymerisation between 2 and 35. They have
a stimulating effect on growth ofbifidobacteria (Hidaka et al., 1986). They are metabolised by
bifidobacteria as well as other types of bacteria and are not degraded by human digestive
enzymes nor by undesirable micro-organisms of the digestive tract. The most important source
ofFOS is the Jerusalem artichoke tuber (Mitsuoka et al., 1987). However, similar substances
can now be easily prepared by an enzymatic route or by chemical modification of natural
products, e. g., lactulose from lactose (Hidaka et al., 1986; 1988; Y amakazi and Dilawri,
2.3.6 Bile metabolism
The human microflora can biotransform the bile acids, cholic acid and chenodeoxy cholic acid.
Bifidobacteria (Ferrari et al., 1980) hydrolyse conjugated bile acids. Although many more
genera of the intestine can hydrolyse bile acids, there is variation among species with respect
to the presence and extent of this activity (Shimamura, 1990).
Ibrahim and Bezkorovainy (1993) reported that there is a significant decline of growth of
bifidobacteria in the presence of primary bile salts, with an obvious dose-dependency. They
observed that the higher the bile salt concentration, the lower the growth of the organisms.
They also found that as the concentration of the bile salt increased in the medium, the change
in the pH values caused by growth grew smaller. They were able to recover all the strains to
normal growth when they cultured them in bile salt-free medium.
This study obviously simulates in part, the movement of bifidobacteria from the small intestine,
where the bile salt concentration is relatively high (about 0.6 g/L) to the colon, where the bile
salt concentration is low. Nevertheless, though the authors demonstrated the survival of
Bifidobacterium, of human origin, in a bile salt solution, because the study was carried out
.in
vitro, it does not take into account the effects and conditions experienced
2.3. 7 Mucin metabolism
Mucin is an intestinal mucus glycoprotein. It has been reported that faecal mucinase activity is absent in infants during the first few months of life (Cooperstock and Zedd, 1983). It is
unknown whether this mechanism is a nutrient-recycling process in either infants or adults, or
not. Poch and Bezkorovainy (1988) reported that a limited number of bifidobacteria grew optimally in synthetic medium to which biologically complex materials, including mucin had
been added as a growth-promoting supplements. They used the most commonly occurring human bifidobacterial species, some of which were the adult species and some the infant types.
2.4 APPLICATIONS
2.4.1 Medical and health benefits
The intestinal flora is composed of a variety of organisms comprising hundreds of species,
manifest pathogenicity when the host's resistance is decreased (Mitsuoka, 1982).
Recent research has focused on bifidobacteria to establish their influence on certain normal
functions of the intestinal tract and in exploring their role in human health and diseases.
Bifidobacteria are used as dietary supplements or as starter cultures for yoghurt and other milk
products with the thought that such products may help the promotion of health (Mitsuoka,
1982). The daily intake of such products is reported to have the following effects;
(i) to suppress the putrefactive bacteria as well as intestinal putrefaction, so as to
prevent constipation and geriatric diseases, including cancer;
(ii) to prevent and treat antibiotic-associated diarrhoea, and
(iii) to stimulate the immune response, thus contributing to a greater resistance to
infection (Mitsuoka, 1982).
Most Bifzdobacterium species metabolise a wide range of indigestible oligosaccharides to acetic
and lactic acids and subsequently act as effective scavengers in the large intestine when these
indigestible oligosaccharides are ingested. Studies show that improvement of intestinal flora
as well as intestinal environment were observed after oral administration of various
oligosaccharides, including fructo-oligosaccharides, isomalto-oligosaccharides,
galacto-oligosaccharides, palatinose condensate, raffinose, and soy bean oligosaccharides. Most of the
oligosaccharides stimulated the growth of bifidobacteria in vitro and in vivo, and caused a
cholesterol and triglyceride levels as well as the blood pressure of elderly patients with
hyperlipaemia (Tanaka et al., 1983; Mitsuoka et al., 1987; Kohmoto et al., 1988). These
investigators concluded that oligosaccharides enhanced the intestinal bifidobacteria and
improved the intestinal flora, stool consistency, and lipid metabolism.
Tanaka et al. (1983) observed that feeding 200 ml of Bifidus milk supplemented with
1010-1011
of B. breve per ml per day to healthy subjects with otherwise normal diet resulted in
an increase of indigenous bifidobacteria, reduction of the counts of bacteroidaceae, clostridia
and enterobacteraceae in the stools, and a decrease of faecal ammonia.
Tohyama et al. (1982) studied the effects of the administration of B. breve on bacterial
metabolic activities in the intestines. They observed that the activities of bacterial enzymes such
as B-glucuronidase, tryptophanase and lysine decarboxylase in faeces were significantly reduced,
and bacterial metabolites such as phenols, ammonia and cadaverine in urine were also reduced.
Mitsuoka (1982) studied the effects of oral administration of freeze-dried Bifidobacterium
longum to five healthy 25-35 year old volunteers. The subjects were administered 3 x 10⁹
freeze-dried B. longum per day for five weeks. During the administration, it was observed that
the counts of bifidobacteria in the stools increased, while the counts of clostridia decreased
significantly. A decrease of ammonia concentration and B-glucuronidase activity in both faeces
When Hartley male rabbits were fed a 0.25% cholesterol diet supplemented with 1010 cells of
B. longum per day for 13 weeks, it was observed that in 2 of 3 rabbits, B. longum remarkably
suppressed an increase in cholesterol level in serum Homma ( 1988), reported that the presence
of Bifidobacterium restrained the neoformation of LDL receptors of human activated T-cells.
In rats, Bifidobacterium reduced serum cholesterol level by affecting HMG CoA reductase
activity.
Orally administered bifidobacteria preparations have been used in the treatment of various
intestinal disorders (Mitsouka, 1992). Hotta et al. (1987) investigated the effects of
administration of Bifidobacterium preparations for the treatment of infantile intractable
diarrhoea. Fifteen patients, ranging in age from 1 month to 15 years, were receiving antibiotic
therapy for the treatment of septicaemia and respiratory tract infections. In most cases, a
disturbed intestinal flora was observed, where there was a marked decrease of anaerobes,
especially bifidobacteria. Pathogens or toxins responsible for causing diarrhoea were not
detected during this period. When these patients were administered a bifidobacteria
preparation, the frequency of the stools as well as appearance, were improved after 3-7 days.
The faecal flora of all subjects studied also became normal with predominance of resident
bifidobacteria, and the balance of intestinal flora improved to normal levels.
The relationship between liver tumourigenesis and bifidobacteria was studied in mice.
Gnotobiotic C3H/He male mice monoassociated and polyassociated with intestinal bacteria
and conventional mice than in the germ-free mice (Mizutani and Mitsuoka, 1980). These
workers observed live tumours in 100% of mice associated with a bacterial combination of E. coli, S. faecalis, and C. paraputrificum, in contrast to 30% of germ-free mice and 75% of conventional mice. This tumour-promoting effect by intestinal bacteria was found to be suppressed 46% by the addition of B. longum to the promoting combination, and 65% by L. acidophilus. It has been suggested that the mechanism of the suppressive effect of
bifidobacteria on liver tumours might be related to their ability to detoxify carcinogens.
2.4.2 Bifidobacteria in food
Bifidobacteria are the most recent organisms to be recognised as dietary adjuncts. Some of the benefits that have been listed as a result of consumption of foods containing bifidobacteria are
1) improved flavour and nutritional quality of some foods such as yoghurt, 2) improved nutritional value of baby formulae, 3) control of intestinal infection in the very young and the very old, 4) anti-carcinogenic activity, and 5) improved lactose utilisation, especially for people
who are lactose intolerant (Laroia and Martin, 1990).
Recent research has indicated that maintaining a proper balance among the various normal
micro-organisms in the intestinal tract is needed for optimum health. Obviously, there are many factors that affect the balance among the intestinal microflora. Diet, infections and antibiotics
can alter this balance. It is therefore important that if an organism is to be used as a dietary
flora of the intestinal tract of a healthy person. To reach the intestines, this organism must be
able to survive extreme conditions of the upper digestive tract. Thirdly, if it does survive these
conditions, it must be able to establish and grow in the intestine. Once established, it must
produce the beneficial effects that are expected of it. Finally, and perhaps most importantly, to
have any effect, it must be viable in the food to which it is added at the time of consumption.
The use of bifidobacteria as dietary adjuncts helps maintain a proper balance of the intestinal
flora (Laiora and Martin, 1990). Consumption of fermented foods containing these organisms
allows their continuous passage through the gut (Modler et
.al,.
1990). In this way, theycompete for essential nutrients and attachment sites on the epithelium with other gut organisms,
thus minimising or inhibiting colonisation of the intestinal tract by invading pathogens (Tamura,
1983).
It has been reported that the composition of the intestinal flora is influenced by the type of diet.
Benno et al., (1986) studied the influence of diet on the intestinal flora of nine rural healthy
Japanese and eight healthy Canadians. The two population groups ate typical Japanese and
western diets, respectively. The numbers and occurrence of bifidobacteria were higher in the
Japanese population than in the Canadians. In addition, these investigators found that the
incidences of B. adolescentis biovars a and b, and B. bifidum biovar b, were significantly higher
in the Japanese than in the Canadians.
no significant differences in bifidobacterial numbers were observed (Mitsuoka, et al., 1977).
Hentges et al. (1977), compared the faecal counts of volunteers on high and low beef diets.
They found that bifidobacteria counts were 1.05 ± 0.49 x 10¹⁰ and 1.98 ± 0.76 x 10¹⁰,
respectively. Furthermore, Reddy et al. (1975), observed a lower anaerobe count in faecal
samples from persons consuming a non-meat diet, compared with those on a high-meat diet.
Bifidobacterial counts were reported as 7.94 ± 0.08 x 10¹⁰ and 2.63 ± 0.10 x 10¹⁰ per gram of
faeces, respectively.
On the basis of the above information, it appears there is no general agreement in terms of
whether or not the bifidobacterial flora of individuals on high-meat diets differ from those
individuals on low-meat diets. However, Mitsuoka (1984) believes that a Japanese-style diet,
is superior to a western-style diet, with respect to bifidobacterial counts in the intestinal flora.
Another type of diet that has been shown to have an effect on the numbers of intestinal flora,
especially bifidobacteria, is one containing fructo-oligosaccharides. These compounds are found
in plant materials such as onions, asparagus, wheat, etc. Human digestive enzymes are not able
to hydrolyse these compounds, but bifidobacteria can (Mitsuoka, 1982). When a population
of elderly people were orally administered 8 g of fructo-oligosaccharides per day for two weeks,
it was observed that the numbers ofbifidobacteria in faeces increased about 10 times compared
with levels before administration. The average pH of the stools decreased, about 0.3 units
Kohmoto and others (1988) administered 13.5g of isomalto-oligosaccharides (found in
fermented foods), per day for two weeks to a group of healthy adults. At the end of the
administration period, they found that bifidobacteria counts had remarkably increased.
Due to the health promoting effects associated with bifidobacteria, various countries are taking
a keen interest in incorporating these organisms into fermented milk products. However, to
manufacture fermented milk products containing viable cells of these organisms, the organisms
must be able to survive in the products, during manufacture and storage in acidic milk. In the
intestines, growth of these organisms is associated with the so-called bifidus factors (Modler,
1990). Klaver et ill. (1993) found that growth ofbifidobacterial species in unsupplemented milk
was generally poor. Of 17 strains they used in their experiment, only 3 displayed any growth,
albeit poor, while the rest did not grow at all. When the milk was supplemented with casitone,
all but 3 strains grew fairly well, and when they supplemented the milk with a mixture of free
amino acids, all strains grew fairly well except one. It appears that different bifidobacterial
strains have different nitrogen requirements.
In fermented products, Klaver et al. (1993) found that 3 of 17 strains did not show any
significant reduction in counts during storage while the rest showed a significant reduction by
a factor of more than 103 in 2 weeks of storage. In this case, it appears that changes in pH were