THESES. SIS/LIBRARY R.G. MENZIES BUILDING N0.2 Australian National University Canberra ACT 0200 Australia
USE OF THESES
This copy is supplied for purposes
of private study and research only.
Passages from the thesis may not be
copied or closely paraphrased without the
written consent of the author.
THE AUSTRALIAN NATIONAL UNMRSllY
Telephone: "61 2 6125 4631 Facsimile: "61 2 6125 4063
IN
PENINSULAR MALAYSIA
Ahmad Fuad Hashim
A thesis submitted in partial fulfilment of the requirements for the degree of Master of Arts in Demography
at the
Australian National University
ii
DECLARATION
ACKNOWLEDGEMENTS
I would like to express my gratitude and heartful thanks and
sincere appreciation to a number of individuals for their
assistance in the writing of this study.
Firstly, I am most indebted to Dr Paul Meyer, my supervisor,
for his incisive comment, guidance and also for his constant
encouragement, interest, and understanding without which this study would not be a reality. I also owe my thanks to Dr Hal Kendig, my
advisor from whom I have received his assistance and expertise in
several different phases of this study.
I also thanks Dr David Lucas, Mr Rodney Coale and Ms Carol Mehkek for their help and encouragement. I also wish to acknowledge
assistance given by Ms Christine McMurray.
I thanks The Australian Development Assistance Bureau for
fully supported me in taking this course, and also the Federal Town
and Country Planning and Department of Public Service, Kuala Lumpur
for providing study leave.
Finally, but not least, to my wife Faridah and my daughter, Farah Fudiana who each in their own way motivated me through their
iv
ABSTRACT
This study is concerned with the implications of population growth for housing needs in urban areas of Peninsular Malaysia from 1980 to 2010. The demographic trends and household structure of the main ethnic groups in the urban area are analysed as a basis for making projections of the urban population and the number of urban households. These projections, along with information on overcrowded, sub-standard, and dilapidated housing are then used for making estimates of housing needs.
TABLE OF CONTENTS
Declaration ii
Acknowledgements iii
Abstract iv
1. INTRODUCTION 1.1 Introduction
1.2 Review of Literature 2
1.2.1 The Concept And Perspective of Housing 3 1.2.2 General Features of Population Growth and Housing 4
in Development
1.3 Statement of Issues 6
1.4 The Study Approach 7
1.5 Problems and Limitation 8
2. DEMOGRAPHIC BACKGROUND OF PENINSULAR MALAYSIA 10
2.1 Introduction 10
2.2 Population Structure in Peninsular Malaysia 11
2.2.1 Growth and Distribution 11
2.2.2 Age,Sex and Ethnicity 14
2.2.3 Fertility and Mortality 14
2.2.3.1 Mortality Pattern 14
2.2.3.2 Fertility Pattern 18
2.2.4 Urban Growth 19
2.3 Household Structure in Peninsular Malaysia 23
2.3.1 Introduction 23
2.3.2 Growth and Size of Households 24
2.3.3 Type of Household 24
2.3.4 Marital Status 28
2.3.5 Heads of Households 28
3. PROJECTION OF THE POPULATION 32
3.1 Introduction 32
3.2 Limitations of the Assumptions and Projections 33
3.3 Assumptions 34
3.3.1 Mortality for Peninsular Malaysia and Urban Areas 34 3.3.2 Fertility in Peninsular Malaysia 37
3.3.2.1 High Variant 37
vi
3.3.2.3 Low Variant 38
3.3.3 Fertility for Urban Areas 38 3.3.4 Migration and Urbanization 40 3.3.4.1 Estimated Annual Net Rural-Urban Changes 43
1980-2010
3.3.4.2 Age Distribution of Rural to Urban Changes 44 3.4 Future Size and Characteristics of the Population in 48
Peninsular Malaysia
3.4.1 Population Size 1980-2010 48
3.4.2 Ethnic Composition 48
3.4.3 Age Structure 50
3.5 Urban Growth and Characteristics of Urban Population 53 3.5.1 Urban Growth and Urbanization, 1980-2010 53
3.5.2 Ethnic Composition 53
3.5.3 Age Distribution 57
4. PROJECTION OF HOUSEHOLDS 59
4.1 Introduction 59
4.2 Projected Urban Households 60
4.2.1 Number of Urban Households 60 4.2.2 Urban Households by Ethnic Group - Medium Variant 60 4.2.3 Related Changes in Headship Rates and Households 62
4.2.4 Household Size 65
4.2.5 Households Per Living Quarter
5.
PROJECTED FUTURE HOUSING STOCK5.1 Profile of the Urban Housing Stock 5.1 .1 Growth
5.1.2 Overcrowding
5.1.3 Sub-standard Units 5.1.4 Replacement
66 68 68 68 69 71 71
5.2 Future Housing Requirements 71
5.2.1 Methodology 71
5.2.2 Total Housing for New Households 73 5.2.3 Projection of Total Housing Requirements for 76
Urban Areas
5.2.4 Overall Housing Requirements 79
6. CONCLUSION
6.1 Summary of Findings 6.2 Projections
6.2.1 Related Policies and Assesment 6.3 Related Studies and Conclusion
REFERENCES 83 83 84 87 89 go
Appendix B. Rural to Urban Changes by Age and Sex: Chinese 97 1970-1980
Appendix C. Rural to Urban Changes by Age and Sex: Indians 98
1970-1980
Appendix D. Percentage Distribution of Rural to Urban Changes 99
by Age Groups, Sex and Ethnic Groups: 1980
Appendix E. Urban Population by Ethnic Groups, Sex and 100
Age: 1980
Appendix F. Projected Urban Population in thousands Groups, Sex and Age: 1990 [High Variant]
Appendix G. Projected Urban Population in thousands Groups, Sex and Age: 2000 [High Variant]
Appendix H. Projected Urban Population in thousands Groups, Sex and Age: 2010 [High Variant]
Appendix I. Projected Urban Population in thousands Groups, Sex and Age: 1990 [Medium Variant]
Appendix J. Projected Urban Population in thousands Groups, Sex and Age: 2000 [Medium Variant]
Appendix K. Projected Urban Population in thousands Groups, Sex and Age: 2010 [Medium Variant]
Appendix L. Projected Urban Population in thousands Groups, Sex and Age: 1990 [Low Variant]
Appendix M. Projected Urban Population in thousands Groups, Sex and Age: 2000 [Low Variant]
Appendix N. Projected Urban Population in thousands Groups, Sex and Age: 2010 [Low Variant]
Appendix O. Projected Number of Urban Household
Ethnic Groups, Sex and Age: 1990 [High Variant]
Appendix P. Projected Number of Urban Household
Ethnic Groups, Sex and Age: 2000 [High Variant]
Appendix Q. Projected Number of Urban Household
Ethnic Groups, Sex and Age: 2010 [High Variant]
Appendix R. Projected Number of Urban Household
by Ethnic
by Ethnic
by Ethnic
by Ethnic
by Ethnic
by Ethnic
by Ethnic
by Ethnic
by Ethnic
Heads by
Heads by
Heads by
Heads by
Ethnic Groups, Sex and Age: 1990 [Medium Variant]
Appendix S. Projected Number of Urban Household Heads by
Ethnic Groups, Sex and Age: 2000 [Medium Variant]
Appendix T. Projected Number of Urban Household Heads by
Ethnic Groups, Sex and Age: 2010 [Medium Variant]
101 102 103 104 105 106 107 108 109 110 111 112 113 114 11 5
Appendix U. Projected Number of Urban Household Heads by 116
viii
Appendix V. Projected Number of Urban Household Heads by 117
Ethnic Groups, Sex and Age: 2000 [Low Variant]
Appendix W. Projected Number of Urban Household Heads by 118
LIST OF FIGURES
Figure 1-1 : Urban Areas in Peninsular Malaysia 9 Figure 2-1 : Trends in Birth and Death Rates: Peninsular 17
Malaysia 1948 - 1980
Figure 3-1 : Percentage Age Distribution of Rural to Urban 47 Changes
Figure 3-2: Projected Poiulation: Peninsular Malaysia and
55
[image:10.577.50.562.116.756.2]Table 2-1:
Table 2-2:
Table 2-3:
Table 2-4:
Table 2-5:
Table 2-6:
Table 2-7:
Table 2-8:
Table 2-9:
Table 2-10:
LIST OF TABLES
Population and Annual Percentage Change by States: Peninsular Malaysia, 1911-80
Population of Peninsular Malaysia by Ethnic Group at Various Censuses, 1911-80
Percentage Distribution of Population by
Age-Group, Sex and Ethnic Group, Peninsular
Malaysia: 1970 - 1980
Median Age by Sex and States: Peninsular
Malaysia 1970-80
Life Expectancy by Sex and Ethnic Group : Peninsular Malaysia, 1957-80
Age-Specific Fertility Rates by Ethnic Grou~:
Peninsular Malaysia, 1970-80 [Rates per 1000J Percentage of Population Living in Urban and
Rural Areas and Annual Growth Rates
Peninsular Malaysia, 1911-80
Percentage of Urban and Rural Population by Ethnic Group : Peninsular Malaysia, 1947-80 Average Annual Population Growth by Ethnic
Group: Peninsular Malaysia, 1957-80
Population, Private Living Quarters and and Rural Areas
1970-80
Households, Number of
Household Size in Urban Peninsular Malaysia,
x 12 13 15 16 18 20 21 22 23 25
Table 2-11: Percentage of Household by Type, Ethnicity of 27
Head of Household and Stratum Peninsular
Malaysia, 1980
Table 2-12: Distribution of Marital Status of Age 15+ by 29
Sex, Ethnic Group and Marital Status
Table 2-13: Percentage Distribution of Head of Household 30
by Sex, Ethnic Groups and Stratum, 1980
Table 2-14: Headship Rate by Ethnic Group, Sex and Age: 31
Urban Areas, 1980
Table 3-1: Assumptions for Expectation of Life at Birth 36
by Ethnic Groups 1980-2010
Table 3-2: Assumptions Regarding Total Fertility Rates by 39
Ethnic Group, 1980-2010 [High, Medium and Low Variants]
Table 3-3: Total Fertility Rate for the Urban Population 41
by Ethnic Groups, 1980-2010 Table 3-4:
Table 3-5:
Internal Migration in Thousands: Peninsular 43
Malaysia, 1957-1970 AND 1970-1980
Projected Annual Net Rural to Urban Changes,
Table 3-6:
Table 3-7:
Table 3-8:
Table 3-9:
Table 3-10:
Table 3-11:
Table 3-12:
Table 4-1:
Table 4-2:
Table
4-3:
Table 4-4:
Table 4-5:
Table 5-1:
Table 5-2:
Table
5-3:
Table 5-4:
Table 5-5:
Table 5-6:
Table
5-7:
Table 5-8:
Table
5-9:
Table 6-1:
Projected Population by Ethnic Group :
Peninsular Malaysia 1980-2010 [in thousands]
Average Annual Growth Rate of Projected
Population in Peninsular Malaysia : 1980-2010 [Percentages]
Percentage Distribution of the Projected
Population by Ethnic Groups Peninsular
Malaysia, 1980-2010
Percentage Age-distribution by Ethnic Groups: Peninsular Malaysia 1980-2010
Projected Urban Population by Variants and Ethnic Groups: 1980 - 2010
Ethnic Composition in Urban Areas: 1980-2010 [Percentages]
Percentage Age-distribution in Urban Areas: 1980-2010
The Actual and Projected Urban Population and Urban Households, 1970 - 2010 [in thousands] Actual and Projected Urban Population and Urban Households by Ethnic Groups, 1970 - 2010
[in thousands]
Households and Headship Changes by Variants and Ethnic Groups: Urban Areas 1980 - 2010 [in
thousands]
Projected Households Size by Variants and Ethnic Groups in Urban Areas 1980 - 2010
Projected Number of Households per Living Quarter by Variants and Ethnic Groups 1980 -2010
Housing Stock and Households in Urban Areas, 1970 - 1980 [in thousands]
Indicator of Overcrowding : Urban Areas 1980 [in thousands]
Average Households Size and Average Households Per Occupied Living Quarter 1980 - 2010
Average Households Size and Average Households Per Occupied Living Quarter in Urban Areas by Variants 1980-2010
Projected New Livin~ Quarters for Population
Increased 1980-2010 Lin thousands]
Projected New Living Quarters for Population by Ethnic Group, 1980-2010: Medium Variant [in
thousands]
Projected Housing Requirement According to Variants, 1980-2010 [in thousands]
Projected Housing Requirement for Each Ethnic Group, 1980-2010
Housing Needs in Urban Areas by Variants, 1980-2010 49 50 51 52 54 56 58 61 63 64 66 67
69
7074
75
76 77 78 80 81 Peninsular 1971-19831.1 Introduction
CHAPTER 1 INTRODUCTION
In Malaysia, the fulfilment of housing needs is one of the main social objectives of national development. The national housing policy is to ensure that households have access to adequate housing, in particular the low income group. The availability of adequate housing has a significant bearing upon the social and economic development of the country. As an assurance that Malaysia will be in a strong position for making progress in attaining its social and economic objectives, various consecutive five-year development plans have been outlined since independence in 1957.
The first two development plans (1957-60, 1961-65), were mainly concerned with sectorial planning with the aim of upgrading the physical and economic infrastructure. Since the so-called First Malaysia Plan ( 1966-70), there has been a shift from sectorial planning to a greater emphasis on regional planning, from rural-oriented planning to urban and agro-industrial development, and from economic to socio-economic planning. In these five-year development plans, considerable attention has been devoted by the Malaysian Government to providing adequate housing in terms of allocation of funds, al though the policy documents contain only fragmented and brief statements on housing.
highlighting important variations among states and between urban
and rural areas. For the purpose of this study, data from the
censuses will be used to produce long-term estimates of current and
future urban housing needs. Such needs are usually assessed in
terms of households rather than population, since a household
normally occupies one housing unit. The inter-action between
population trends and housing is also considered to be important.
With this perpective, the study will focus on the description and
analysis of some aspects of population growth and its
inter-relationship with changes in household structure, which in
turn influence changes in the number of households. The projected
population structure will be converted into numbers of households
based on the pattern of household headship rates defined as the
ratio of households heads to the total population in the same age,
sex, and marital status category (Di Iulio 1981 :2; Shryock and
Siegel 1975 :848). The general procedure is to cross-multiply the
projected population by age, sex and ethnic group with the headship rates of the same age, sex and and ethnic group.
This study seeks to:
1. estimate the future urban population increase from the year
1980 to 2010;
2. establish the needs for housing in view of a progressively
increasing population;
3.
determine the extent of the housing backlog; and4.
provide a framework for identifying housing goals.1.2 Review of Literature
This review covers research literature on housing and
population growth with the purpose of providing a wide range of
3
1.2.1 The Concept And Perspective of Housing
Housing is defined as shelters or physical structures of varying shapes, sizes, types and materials erected within a community for security, privacy and protection from the elements. The house represents shelter from not only physical elements, but also social, spiritual and psychological forces (Podger 1985:5).
In the past, housing was primarily a physical phenomenon. Policies on housing provision centred on construction costs, the combination of alternative material inputs, and the level of standards and finish (Grimes 1976). In recent years, the literature has given housing a broader interpretation. The economic and social costs and benefits of housing have received more emphasis (Grimes 1976; McCallum and Benjamin 1984; Burns and Gebler 1977).
To establish an economic perspective on housing, McCallum and Benjamin (1978:6) categorized housing as:
1. social consumption;
2. an improver of health and well-being;
3.
a macro economic sector;4. a stimulus to savings and investment; and
5.
an indirect contributor to income and production.Grimes' ( 1976: 30) view of housing encompasses far more than living space and shelter, and housing is dicussed in the following manner:
Indeed, he went on to point out that housing has substantial social benefits and it not only gives shelter to a family but also acts as a focus of economic activity, as a symbol of achievement and social acceptance, and as an element of urban growth. In fact housing represents one of the most heterogeneous products of a society.
1.2.2 General Features of Population Growth and Housing in Development
The demand and need for housing are two separate and distinctive features of housing provision. Housing need is defined as the extent to which housing conditions fall below the levels considered necessary for the heal th, privacy and development of normal family living standards (United Nations, 1976:40). The concept of housing demand refers to the ability and willingness of people to buy (Chander et. al. 1975:37-38). Factors that influence housing needs and demands include population growth, urbanization trends, economic growth and social development. Concern about housing
growth
provision problems that are caused by rapid is an important part of the broad range addressed by studies on housing.
population of subjects
The urban population of the world is growing at a more rapid rate than the total population. In developing countries, the urban population is now growing at a faster rate than was experienced by the developed countries (World Bank 1975:14; Chander et. al. 1979:32; Smith 1981 :2). Nearly half of the urban population growth in developing countries is the result of natural increase (Smith 1 981 : 6) • Such growth leads to increasing pressure on housing provision in the urban areas.
5
growth was 3.2 per cent in 1978, but Bangkok City was growing at a rate of 6 per cent. In Peninsular Malaysia during the period 1931 to 1970, the urban population increased from 16 to 49 per cent of the total. All these countries are undergoing a re la ti vely high rate of urbanization with severe housing shortages and comparatively low incomes in their primate cities.
Smith (1981:6) has noted that there has been a sharp decline in mortality, particularly infant mortality, in developing countries, indicating that the demographic transistion has begun in most of these countries. In the past it was observed that in developing countries, modernization caused a decline in mortality while births remained at a high level (Coale 1974:51). Presently,
there is growing opinion that the lower mortality rates in developing countries are due to the advancement of medical facilities and improvements in nutrition and general levels of living (Lim 1983:19 and 21)
In the analysis of housing, the population can be classified according to various characteristics. The link between housing and population characteristics such as household size, which are indirectly influenced by social and economic forces, is seen as inevitably stimulating housing needs and demand. Household size, or the number of persons in a dwelling unit, and the availability of space for them is significant in deriving the need for housing. Large household size, low income and inadequate space have led to squatter and slum settlements. Laquain (1979:60) indicated that in developing countries, due to economic and other social reasons, large families have caused doubling up in single
Asia, the average household size ranges from 5
dwellings. In persons to 7 persons. In slum and squatter areas surveys have shown that a majority of the housing units had two or more families, resulting
in overcrowding (Laquian 1979:60).
modernization have an effect on the structure and function of the
family and on the relationship with kin, where there is a
redirection of the traditional family system towards conjugal
households (Goode 1963:1). In the United States, the small average
household size is viewed largely as a result of the decline in fertility and the process of nucleation (Kobrin 1976:127).
There is evidence that in Peninsular Malaysia, prior to 1980
among the Malays, the nuclear family was not uncommon. However
Palmore et al (1970:376-378) observed that among the Chinese and
Indians, the extended family is still prevalent. In 1980, the
Housing and Population censuses indicated that in Peninsular Malaysia, the nuclear family is becoming prevalent among all the
main ethnic group. The census has also indicated a decline in average household size.
1.3 Statement of Issues
The provision of housing forms an integral component of the
New Economic Policy objective of restructuring society and
eradicting poverty. In the urban areas, ·housing is quite
inadequate. The 1980 census indicated that there were some 10 per
cent more households than housing uni ts. The problems might be
related to the formation of more nuclear households, a rise in the household headship rate, increases in the number of single person
households, increases in urban migration of selected low income
groups, and a poor supply of housing.
In April 1984, a new population policy was enunciated (The New
Straits Times, 1984:1). This policy seeks to achieve a targeted
population of 70 million in 115 years. There is no doubt that if
this policy were to be implemented, comprehensive measures will
have to be taken to increase the population. In such circumstances,
there would be an increase in urban population resulting from
natural increase and rural to urban migration. With the expected
change in the household type, headship rates and an increase in
rural to urban migration, this would imply that greater provision
7
1.4 The Study Approach
The study is planned around three interlinked stages. The first stage consists of examining the historical and existing trends of population change. It will look into the changes in mortality and fertility patterns, age structure, and marital status classified by ethnicity and region. This examination should provide a demographic perspective of household structure for the estimation of housing needs. The analysis will also look into national development objectives in conjunction with population changes and housing needs.
The second stage deals with the projection of the urban population. The urban population will be projected by each ethnic group. For the projection, several assumptions regarding fertility, mortality and migration will be made. Derivation of the assumption will be based on demographic trends as identified in the first stage. The urban population will be projected at five-year intervals from 1980 - 2010, however for the purpose of projecting housing needs, the projected population at ten-year intervals will be used. At this stage, the study will look at the differences in the projected population according to the different projection variants used.
1.5 Problems and Limitation
In the course of this study, there were several problems and
limitation that have handicapped a detailed approach for analysis
and projections. In carrying out the study, the basic data used
are published government reports and other related studies by
various individuals and researchers. In the study, the main
problems and limitations noted were as follows:
1 • In projecting the population for urban areas, there were
no data available on life-expectancy at birth of each ethnic group
and thus the life-expectancy of the urban populace is assumed to be similar to the life-expectancy of the whole population of the
Peninsula by ethnic groups.
2. Rural to urban migration is one of the main components of the urban population growth. However, there were no data available
on the age and ethnic distribution of rural to urban migrants •• To estimate rural to urban migration for the projections, the recent
rural to urban migration rates (i.e. between 1970-1980) were obtained by comparing the expected 1980 urban :population (using a
projection of the 1970 urban population) and the enumerated 1980
urban population.
3. For the analysis of households structure there were no
data available from the 1970 census on household headships rates
comparable with 1980 data. Furthermore, in the 1980 census the
only household headship rates available were the rates by
age-group, sex, ethnic group and by stratum. There were no headship
rates available by marital status. Because of this, constant
headship rates were used to project the number of household heads
9
Figure 1-1: Urban Areas in Peninsular Malaysia
L
-~. ~
r-1
-~----··--...
\;
;-··-;
.. ..;"\ ..~ ··- "' I
/ :
' '{fl"'
\_..'\.-)
_I lUl'V'Al'I ALOR STAR8
c.'.'~
!
eKOTA BAHARUN
~
~o100 KM
100 MllE~
PAS! R MAS• \
I / 01'!.RINGAl "-"-··-~-··-·· INTERNATIONAL BOUNOARY ,.. ,_ .. ...-.-, j 9PANGK~~KALONG
i... _..; ' ' ---:....- STATE BOUNOARY
SUNG
.
I PETAHI \ , I '·/'./ // \./ ( (
fAllJOltG TO'KC»4G---, - , \ ) I
. I I l - I
•
•
•
•
•
•
•
I ( -. I
• I I \ KAMPONG
:•KU~I~,, ,..._.,.\ I l'\AlllR
I / r I
I• / I \
-.J / I '
\ / I ~
I I
SUNGEI SIPUT ~ 1-...,
AIPING • I I
• ..KUALA KANGSAR (\, / - ' \ ~.... f',
I J \I )~-...I _,. - - ,
IPOH \-v,._ - J
BATU GAJAH S _,, \
KAllPAR (" -"\
PERSONS
10,000 • 20,000 20,000 - 30,000 35,000 45,000
0 TE LUK ANSON
( JJ
I I
\ _ J
<. I
" \
[image:21.574.33.568.42.745.2]\.""'
-
...-\ \ <>RAUB ..._,
"'
...,
...-,
I
I
: oBENTONG e 1£NTAKAB
\
',,...,
\ \_,,
LUMPUR I ---...
K~·
-+
KAJANG ",,PETAJ.HlG JAYA r -J ',"
KUALA T REHGGANU
CENTRAL
KUALA DUNGUN
50,000 60,000 80,000
60,000 70,000
SERDA;;G)AHRU 11 • KUA~ p I LAH / ... '
"'---...,, / SEREMBAN j
SEGAl'A~',
.- ..., "\~ I II ...,_.,,. '
PORT DICKSON~----... J ; BUKIT ry
BAHARU I e TANGKAK
MALACCA•..._J) KLUANG
95,000
110,000 . 140,000
- 240,000 . 270,000
MUAR·~
e452,000
BATU PAHAlf»~ KU~AI
~JOHO
CHAPTER 2
DEMOGRAPHIC BACKGROUND OF PENINSULAR MALAYSIA
2.1 Introduction
Malaysia
Southeast Asia.
is located within the area commonly known as
It is a Federation of 13 states, 11 of which were the former Federation of Malaya, now called Peninsular or West
Malaysia, and two were the former British Colonies of North Borneo
now called Sabah and Sarawak, and collectively known as East
Malaysia. East and West Malaysia are separated by the South China
Sea.
The total land area of Malaysia is about 331 ,000 sq km.
Peninsular Malaysia is smaller than East Malaysia, with an area of
132,000 sq km. Peninsular Malaysia is bordered by Thailand in the
north, while in the south and west the Straits of Malacca separate
it from the Indonesian island of Sumatra.
Malaysia has a diversity of community groups and cultures. In Peninsular Malaysia, the population consists of three main ethnic
groups: Malays (55 per cent), Chinese (39 per cent) and Indians (11
per cent). The other community groups, predominantly Eurasians and
Europeans, constitute less than one per cent of the total
population.
In Malaysia, the agricultural and manufacturing sectors have
been the main economic strength of the country, with 22.2 and 20.5
per cent respectively of the 1980 G.D.P. Mining, accounted for a
further 4.6 per cent of the G.D.P. The service sector, which
comprises among other things wholesale and retail
and government services contributed 41.9 per
trade, finance
11
1981:11). As compared to other less developed countries, Malaysia is undergoing a substantial rate of economic expansion.
2.2 Population Structure in Peninsular Malaysia
2.2.1 Growth and Distribution
The first census, which covered all the Malaysian states at the same time, was carried out in 1970 by the government of Malaysia. Prior to that, there were seven population censuses during the time of British colonial government, 1891 , 1901 , 1911 , 1921, 1931, 1947 and 1957. The first two covered only four of the states in the Peninsula, which were at that time known as the Federated Malay States. It was only from 1911 onwards that population counts for the whole Peninsula became available.
The population of Peninsular Malaysia has increased from 2.3 million in 1911 to 11.4 million in 1980, with average growth rates of 2. 2 per cent or more per annum in most of the intercensal periods. The periods 1911 to 1931 and 1947 to 1970 had higher growth rates, averaging about 2.5 per cent per annum. In the intercensal period of 1931 to 1947 the growth rate declined to 1.6 per cent per annum (refer Table 2-1).
Rapid growth rates prior to the 1930's Depression were due to substantial in-migration. This was the period during British colonial rule when Indians were brought in to work in the rubber plantations and Chinese in the tin mines (Malaysia, Department of Statistics 1977:268). In the period 1911 to 1931, various states in the Peninsula experienced high growth rates. These were the states of Johor, Kedah, Negri Sembilan, Perak and Selangor which have large establishments of plantations and mines.
---Population ('O(X)'S) Annual Percentage Change
---Year 1 911 1921 1931 1947 1 957 1970 1980 1911-1921 1921-1931 1931-1947 1947-1957 1957-1970 1970-1980
---Joh or 180 282 505 738 927 1277 1638
Kedah 246 339 430 554 702 702 1116
Kelantan 287 309 362 449 506 506 893
Malacca 124 154 187 239 291 291 464
Negeri Sembilan 130 179 234 268 365 365 573
Pa hang 119 146 180 250 313 313 790
Penang 271 292 340 446 572 572 954
Perak 502 611 786 954 1221 1221 1805
Perl is 33 40 49 70 91 91 148
Selar.gor 294 401 533 711 1013 1013' 2492
Trengganu 154 154 180 226 278 278 541
Total 2339 2907 3788 4908 6279 8809 11426
Source: Malaysia, Department of Statistics 1975:269
Malaysia, Department of Statistics 1983b: 15
4.4 5.7 2.3 2.3 2.4 2.5
3.2 2.4 1. 6 2.4 2.3 1.6
0.7 1.6 1. 3 1.2 2.3 2.6
2 .1 1. 9 1. 5 2.0 2.5 1. 4
3.2 2.7 0.8 3.1 2.1 1.8
2.0 1.1 2.0 2.2 3.6 4.5
0.6 1. 5 1. 7 2.5 2.3 2.1
2.0 2.5 1.2 2.4 1.9 1.4
1.S 2.0 2.2 2.6 2.8 2.0
3. 1 2.8 1.8 3.5 3.6 4.2
o.c 1. 6 1. 4 2.1 2.9 2.9
2.2 2.6 1. 6 2.4 2.6 2.6
[image:24.809.137.681.52.540.2]13
Table 2-2: Population of Peninsular Malaysia by Ethnic Group at Various Censuses, 1911-80
Ethnic
Group Malay Chinese Indians Others Total
---Years Number % Number
%
Number%
Number%
Number---1911 1369844 58.6 693228 29.6 239169 10.2 36810 1.6 2339051
1921 1568588 54.0 855863 29.4 439172 15.1 43068 1.5 2906691
1931 1863872 49.2 1284888 33.9 570987 15. 1 68011 1.8 3787758
1947 2427834 49.5 1884534 38.4 530638 10.8 65080 1.3 4908086
1957 3125474 49.8 2333756 37.2 735038 11. 7 84490 1.3 6278758
1970 4663284 53.1 3117896 35.5 933250 10.6 66298 0.8 8780728
1980 6315572 55.3 3865431 33.8 1171135 10.2 74475 0.7 11426613
Source: Malaysia, Department of Statistics 1977:271
Malaysia, Department of Statistics 1983b:17
Second World War, when Malaysia was under Japanese occupation.
At the time of the depression, there was wide-spread unemployment
and consequently many migrants returned to their homeland. The
war, on the other hand, caused thousands of casualties and a decline in the birth rate (Siddhu and Jones 1981 :31; Malaysia,
Department of Statistics 1970:268). The current trend in
population growth in the Peninsula is that natural increase is the
principal factor and international in-migration is no longer
2.2.2 Age,Sex and Ethnicity
The Malay community has always been predominant in the Peninsula. In 1931 , the Malay proportion was just under 50 per
cent, and this increased gradually to more than 55 per cent in 1980. The percentage of Chinese increased from 34 per cent in 1931
to 38 per cent in 1947, and then declined to 34 per cent in 1980.
Between 1931 and 1947 the number of Indians declined in absolute
terms and their proportion of the total population fell from 15 per
cent to 10 per cent (Table 2-2). A high proportion of the
population was in the younger age groups in 1970 and 1980 (Table
2-3). In 1970, about 46 per cent of the population were below the age of 14 and 25. The proportion of persons above age 65 has not
been more than 5 per cent. In 1980 there was a slight increase in the percentage of those aged 15-29 and a slight decline in those
aged less than 14, which is due to a decline in the birth rate.
These figures indicated that between 1970 and 1980 the population aged slightly, however Peninsular Malaysia still has a relatively
young population with a median age of 19.8 in 1980 (Table 2-4). There was not much variation in the age distributions between males
and females.
2.2.3 Fertility and Mortality
2.2.3.1 Mortality Pattern
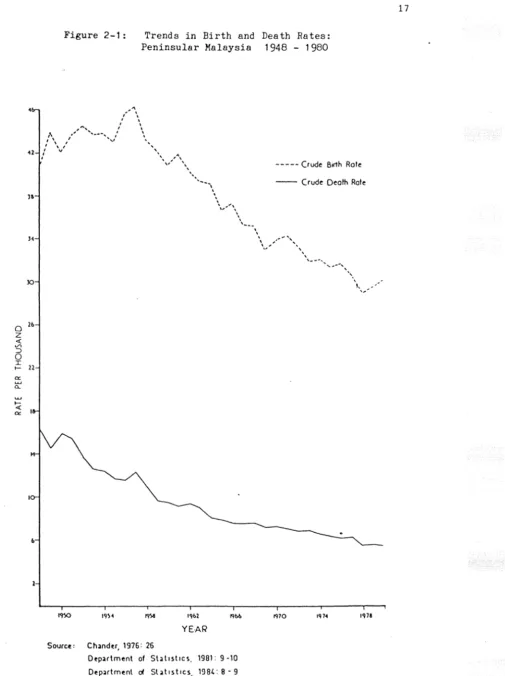
Mortality in the Peninsula has declined steadily since 1948.
The crude death rate declined from 16.4 per thousand in 1948 to
12.4 in 1957, and continued to decline to 7.3 in 1970 and 5.5 in
1980 (Figure 2-1). The decline in the crude death rate has occured
in spite of the ageing of the population.
Patterns of change similar to the overall mortality levels may
be observed in the life table values for the expectation of life at
birth (Table 2-5). By 1980 this parameter for the population of
Peninsular Malaysia as a whole had reached 68 years for males and
72 years for females, figures which were comparable to those in
15
Table 2-3: Percentage Distribution of Population by
Age-Group, Sex and Ethnic Group, Peninsular Malaysia: 1970 - 1980
Age Group
0-14
15-29
30-44
45-59
60+
Malay
M
46
25
15
9
5
Chinese
F M F
1970
45 44 42
25 27 27
16 15 1 5
9 8 9
5 7 6
Indian Total
M F F
43 47 44 45
24 27 25 26
15 15 15 15
12 8 10 9
6 3 6 5
---ALL AGES 100 100 100 100 100 100 100 100
---19800-14 42 40 38 36 37 38 ..J.J c::a 38
15-29 28 30 28 29 31 33 29 31
30-44 16 16 19 18 16 16 17 16
45-59 9 9 9 10 10 9 a J 9
60+ 5 5 6 8 6 4 6 6
---ALL AGES 100 100 100 100 100 100 100 100
note:
M - males F - females
[image:27.580.62.471.127.558.2]Table 2-4: Median Age by Sex and States: Peninsular Malaysia 1970-80
1970 1980
STATES
---Males Females Persons Males Females Persons
---Johor 16. 1 ,16.5 16.3 18.7 19.3 19.0
Kedah 17 .5 17.8 17 .6 19.0 20.1 19. 5
Kelantan 17.8 18.4 18.1 17.8 18.9 18.4
Malacca 15.7 17.3 16.5 18. 7 20.3 19. 4
N.Sembilan 16.0 16.7 16.3 18.6 19.6 19. 1
Pahang 17 .6 16.7 17 .1 19.0 18.2 18. 6
Penang 18.5 . 19. 2 18.9 21.5 22.4 22.0
Perak 16.9 17 .6 17.2 18.8 19. 9 19.3
Perlis 19.2 19.7 19.5 21.5 22.4 21.9
Selangor* 18.2 17.9 18. 1 20.4 20.5 20.4
Fed.Ter** 22.1 22.1 22.1
Trengganu 17.0 17 .6 17 .3 18.7 18.7 18.4
P.Malaysia 17 .3 17 .6 17 .4 20.1 20.1 19.8
*
In 1970 the Federal Territory was included in the state of Selangor.**
For 1980 the median age in Selangor excludes the Federal Territory.
Federal Territory.
[image:28.576.76.441.54.545.2]0 z ..: VI ;:) 0 I t-ex: ... a.. ... t-..: <>::
Figure 2-1: Trends in Birth and Death Rates: Peninsular Malaysia 1948 - 1980
....
, ', '
' \
, '
1'' ... -... ,' \
1\ I ' ' '
I \ I ' ' "'
I \ I '
12 : v \. "'
, \~·\\
JO
2b
22
b
Source: Ch4ndtr, 1976: 26
... _, ' \ ' ' ' , ... , ,, ' YEAR ' ' ' , __ _
Dep4rlmenl of Sl4l1st1cs. 1981: 9 -10
Oep4rtmenl cJ Sl4t1stics, 1984:8-9
' '
---Crude Birtn Rote
- - Crude Death Role
\ ,
...
.,,.. '' ...\," ',
\
mo
,_
--
...... ... , ' I, ,,
improvement in expectation of life at birth while Indian males showed a much slower rate of change.
Table 2-5:
Years
Life Expectancy by Sex and Ethnic Group Peninsular Malaysia, 1957-80
1957 1970 1980
Sex Males Females Males Females Males Females
Malay 50.2
Chinese 59.5
Indian 57.5
Others
All Communities 55.8
Source: Chander 1976:29
Malaysia 1981:73
2.2.3.2 Fertility Pattern 53.4
66.7
54.6
58.2
63.7
65. 1
60.2
63.5
65.5
73.4
63.9
68.5 68.0 72.0
Prior to World War II fertility in Peninsular Malaysia, as in
most less-developed countries, was high, and the crude birth rate reached a peak of 46 per thousand after the war. From 1957 onwards
a sustained decline in fertility has occurred in Peninsular
Malaysia to 33 per thousand in 1980 (figU:re 2-1 ). The rate of
decline in the" age-specific fertility rate and the percentage
decline in the main ethnic groups are highlighted in Table 2-6. The
fall in the total fertility rates between 1970 and 1980 was more
marked among the Chinese and Indians than the Malays. Between 1970
to 1980, the total fertility rate for the Malay ethnic group declined by only 12 per cent, while the Chinese and Indian rates
declined dramatically by 31 and 27 per cent respectively. For the
19
decline, while for the Chinese and the Indians the largest declines were in the older age groups. These changes indicate a decline in
marital fertility among all ethnic groups in the Peninsula.
2.2.4 Urban Growth
In the Housing and Population censuses, urban areas have been
defined as those gazetted areas having populations of more than 10,000. The same definition was used for both 1970 and 1980
censuses.
Peninsular Malaysia has been undergoing rapid urbanisation in
the period 1911 to 1980. During this period, the urban population
grew at a faster rate than the total population (Table 2-7). The
proportion of the population living in urban areas rose from 10.7
to 35.0 per cent within 69 years. Prior to 1931, urban population
growth was influenced by substantial international immigration,
causing rapid growth in those urban areas near the tin mines (Lim,
1978). From 1947 to 1957, the high rate of urban growth has been attributed to the declaration of a state of emergency in 1948.
During this period, the urban population grew .very rapidly due to
the establishment of "new villages" - a relocation scheme mainly
for security purposes - and also due to the high rate of rural to
urban movement for work and for security reasons (United Nations
1982:33; Wegelin 1978:24-25).
Urban growth in the Peninsula has slowed down somewhat in the
period from 1957 to 1970. The rural-urban drift for security
reasons ceased and economic and social factors become the primary
cause of internal migration. Between 1970 and 1980 the urban
po.pulation in the Peninsula grew at 4. 7 per cent per year, but by contrast the rural population grew by only 0.9 per cent per year,
indicating a significant redistribution of the population in favour
of the urban areas. However the high rate of urban population
growth might also be due to the changes in the gazetted areas
whereby places previously classified as rural areas were changed to
Table 2-6: Age-Specific Fertility Rates by Ethnic Group:
Age Group
Malays
Peninsular Malaysia, 1970-80 [Rates per 1000]
Chinese Indians Total
1970 1980 1970 1980 1970 1980 1970 1980
15 - 19 75 41 26 24 72 46 57 36
20 - 24 250 195 199 159 279 210 234 185
25 - 29 265 256 292 230 264 240 275 245
30 - 34 226 211 229 159 202 148 224 185
35 - 39 150 146 140 66 117 55 142 108
40 - 44 75 66 70 23 54 18 71 46
---TotalFertility Rate
Percentage Declined of T.F.R:1970-80
5. 21 4.58
12. 1
4.78 3. 31 4.94 3.59 5.02
30.8 27.3
Source: Tabulated from Malaysia, Department of Statistics
1983a:48
4.03
[image:32.576.71.438.76.510.2]21
Table 2-7: Percentage of Population Living in Urban and Rural Areas and Annual Growth Rates : Peninsular Malaysia,
1911-80
Urban-Rural Population (Percentage)
Year 1 911 1921 1 931 1947 1957 1970 1980
Urban 10.7 14.0 1 5. 1 15.9 26.5 28.8 35.0
Rural 89.3 86.0 84.9 84.1 73,5 71.2 65.0
Annual Growth Rate (Percentage)
Year 1911-21 1921-31 1931-47 1947-57 1957-70 1970-80
Urban 4,9 3,3 3.0 5.8 3.2 4,7
Rural 1.8 2.5 1.3 1. 5 2.4 0.9
Pen.Malaysia 2.2 2.7 1.6 2.5 2.6 2.2
Source: Tabulated from Malaysia, Department of Statistics
1977:275, and
[image:33.577.68.468.67.456.2]In Peninsular Malaysia, Chinese and Indian communities are largely located in the urban areas and Malays are mainly found in
the rural areas. In 1947, Malays only accounted for 19 per cent of
the urban dwellers. However, this proportion has increased
dramatically to nearly 38 per cent in 1980 (Table 2-8). In 1947, due to the effect of the "new village scheme" the Chinese comprised
more than 63 per cent of all urban dwellers. However, after 1957,
this figure declined steadily, reaching 50 per cent in 1980. The
proportion of the urban population which was Indians declined from
15 per cent in 1947 to 11 per cent in 1980.
Table 2-8: Percentage of Urban and Rural Population by Ethnic Group : Peninsular Malaysia, 1947-80
Urban Areas Rural Areas
Year 1947 1957 1970 1980 1947 1957 1970 1980
---Malay 19. 0 21.0 27.6 37.9 56.6 60.1 63.5 65.2
Chinese 63. 1 62.6 58.4 50.3 32.7 28.0 26.2 24.7
Indians 14.7 12.8 12.7 11.0 9.9 11. 3 9.7 9.5
Others 3.2 3.6 1.3 0.8 0.8 0.6 0.6 0.6
Total 100.0 100.0 100.0 100.0 100.0 100.0 100.0 100.0
Stratum 15.9 26.5 28.8 35.6 84 .1 73.5 71.2 64.4
Source: Malaysia, Department of Statistic 1975:109,
Malaysia, Department of Statistic 1959:53-67
Malaysia, Department of Statistic 1983b:112-119
During the intercensal periods 1957-70 and 1970-80, urban population growth was more rapid among the Malays then among the
23
the ethnic groups in urban and rural areas suggests that a substantial rural to urban migration has taken place.
Table 2-9: Average Annual Population Growth by Ethnic Group: Peninsular Malaysia, 1957-80
Urban Areas Rural Areas All Areas
1957-70 1970-80 1957-70 1970-80 1957-70 1970-80
---Malay 5.5 6.5 2.9 2.2 3. 1 2.9
Chinese 2.7 3.4 1.9 0.8 2.3 2. 1
Indian 3.0 3.8 1.2 1.2 1.8 2.2
Others 3.3 4.0 2.4 0.8 2.6 1. 5
Source: Same as for Table 2-8
2.3 Household Structure in Peninsular Malaysia
2.3.1 Introduction
This section analyses the trends, patterns and differentials
in household size, structure and headship over time and between the main ethnic groups. The terms "family" and "household" must be
clarified first, based on the definitions used in the 1980
Population and Housing Census of Malaysia. Family is defined to
include persons who are related through kinship, marriage or
adoption, while household is defined as persons related or
unrelated or a combination of both living together and making
common provision for eating and other essentials of living. In
this study the household concept used is based on households
occupying private living quarters,
institutional households.
[image:35.577.81.462.505.704.2]2.3.2 Growth and Size of Households
In 1980, there were 2.2 million living quarters in Peninsular Malaysia. Of this, 88.7 per cent (1.96 million) were occupied private housing units. Between 1970 and 1980, the number of private households grew by an average rate of 2.8 per cent, a greater average growth rate than that of the total population. Within the same period, the average household size decreased both in the urban and rural areas as well as overall, from 5.6 persons in 1970 to 5.4 in 1980 (Table 2-10). The average household size in urban areas was higher than that in rural areas in 1970 but not in 1980. In the inter-censal period, the average number of households per occupied private housing unit increased slightly from 1.05 in 1970 to 1.07 in 1980.
It is interesting to note that, while both the number of households and occupied living quarters increased in urban areas from 1970 to 1980, the average number of households per occupied living quarter and the number of persons per household decreased. This indicates a significant shift away from a larger to a smaller family, which is a reflection of the decline in fertility. By contrast, an increase in the average number of households per housing unit is probably due to the influence of the extended family and is also associated with the tendency for sharing accommodation.
2.3.3 Type of Household
In the 1980 census, there were five different types of household classification based on the composition of household membership. The household types are:
1. single person households
2. nuclear family households
Year
Table 2-10: Population, Private Households, Nwnber of Living
Quarters and Household Size in Urban and Rural Areas Peninsular Malaysia, 1970-80
1970 1980
Stratum Urban Rural Pen • .Malaysia Urban Rural Pen • .Malaysia
Population 2525.2 6284.4 8809.6 4073.1 7353,5 11426.6
Nwnber of Households 415.5 1155.1 1570.6 777.9 1319.7 2097.6
Nwnber of Occupied Living 346.2 1155 .1 1501.3 678.3 1285.4 1963.7
Quarters
Average No. of Households 1.20 1.00 1.05 1. 15 1.03 1.07
Average Households Size 6.1 5,4 5.6 5.2 5,5 5,4
per Occupied Living Quarter
Annual
Growth Rate
1970-1980
2.5
2.8
2.6
---Source: Malaysia, Department of Statistics 1976:67-73
Malaysia, Department of Statistics 1983b:21
Malaysia, Department of Statistics 1983c:10 and 18
Malaysia, Department of Statstics 1983e:22-25
N
[image:37.816.83.738.81.554.2]4.
households containing related persons5. households containing unrelated persons
In 1980, more than 55 per cent of households were nuclear
family households. There are a higher proportion of nuclear family
households in rural areas than in urban areas. The percentage
distribution of household types also indicates that in urban areas
there was a higher concentration of single person households and
also a considerble percentage of the extended family type of
household as compared to rural areas (Table 2-11). The
concentration of the higher number of households per living quarter
in the urban areas, as indicated in the previous section, is
associated with the tendency for extended families to live in urban
areas.
There is considerable variation in household types when the
data are analysed by ethnic groups, as shown in Table 2-11.
Fifty-nine per cent of Malay households are classified as nuclear
family households, which is a higher figure than for the Chinese and Indian ethnic groups ( 50 and 53 per cent). On the other hand, the Chinese and Indians recorded a much higher percentage of
extended family households (32 and 31 per cent respectively) as
compared to the Malay (25 per cent).
In the urban areas, it is noted that the Malay groups recorded a markedly higher percentage of nuclear families (51.6 per cent),
followed by extended families ( 26. 5 per cent) , single families ( 11. 6 per cent) and related and unrelated families, 5. 9 per cent and
4.4
per cent respectively. An almost similar pattern was notedamong the urban Chinese and urban Indians. In 1980, among the
Chinese who were in urban areas, 48. 7 per cent lived in nuclear
families, 31. 3 per cent in extended families, 10. 5 per cent in single families, while related and the unrelated families accounted for 6.8 per cent and 2.7 per cent respectively. Among the Indians
27
Table 2-11: Percentage of Household by Type, Ethnicity of Head of Household and Stratum Peninsular Malaysia, 1980
Household-Type
Malays Urban
Rural
Total
Chinese Urban
Rural
Total
Indians Urban
Rural
Total
Single Nuclear
Person Family
11.6 7.8 8.7 1o.5 7.9 9.4 10.1 7.2 8.5 51.6 60.9 58.7 48.7 50.8 49.6 50.8 55.2 53.4 Extended Family 26.5 24.0 24.6 31.3 32.7 31.9 29.9 21.6 30.5 Related Persons 5.9 5.6 5.6 6.8 6.8 6.7 6.1 4.4 5.6 Unrelated Persons 4.4
1. 7
2.4 2.7 1.8 2.4 3.1 1. 5 0.2
---Total Urban 10.9 50.2 29.2 6.3 3.4
Rural 7.8 58.3 26.4 5.8 1. 7
Total 8.9 55.3 27.4 6.0 2.3
Source: Tabulated from Malaysia, Department of Statistics
followed by 29.9 per cent in extended families , 10.1 per cent in single families, while the related and unrelated families accounted
for 6.1 per cent and 3.1 per cent respectively.
2.3.4 Marital Status
The distribution of the population aged 15 and over by marital
status is shown in Table 2-12. These data indicate that between
1970 and 1980 there has been a significant growth in the percentage
of persons married among all ethnic groups and for both sexes. On
the other hand, the other marital status categories had lower
percentages in 1980 than in 1970. However, within the intercensal period, there was a slight increase in the percentage of widowed
women in all ethnic groups, with the exception of Malay widowed.
There were some marital status differences between the main
ethnic groups in 1980. The proportion of single person was lower for both sexes for the Malays, than for the other ethnic groups.
Conversely, the proportion of marrie.d persons was higher for both
sexes for the Malays, probably because of earlier marriage among
the Malay ethnic group. There was not much variation between the
main ethnic group in the proportion of widows and widowers.
2.3.5 Heads of Households
In the Peninsula, an overwhelming proportion of households
were headed by males, over 80 per cent in 1980 according to Table 2-13. In rural areas, males were even more dominant. There was not
much variation in the proportion of male heads of household between
the main ethnic groups, ranging from 79 per cent for the Chinese to
85 per cent for the Indians.
A useful statistic for analysing households is the
age-specific household headship rates. Unfortunately there are no
data available from the 1970 census on this, so it is not possible
to see trends in headship rates between 1970 and 1980. In 1980,
29
Table
2-12:
Distribution of Marital Status of Age15+
by Sex, Ethnic Group and Marital StatusMarital Malay Chinese Indians Others Total
Status M F F M F M F M F
1970
Never Married
45.8 36.1
53.6 44.1
47.0 42.2 40.8 32.1
48.7 39.6
Married
51. 1 5 2. 1 4 3 . 3 4 5 . 9 48. 5 4 9. 1 5 5 . 1 58. 2 48. 0 4 9 . 6
Widowed
2.2 10.1
2.5 9.5
3.4 7.9
2.7 8.5
2.5 9.7
Divorced
0.9 1.7
0.6 0.5
1.1 0.8
1.4 1.2
0.8 1.1
Total
49.2 50.8 49.8 50.2 54.0 46.0 51.5 48.5 49.9 50.1
1980
Never Married
38.6 29.4 42.5 33.0 41.5 34.4 34.9 24.2 40.2 31.1
Married
Widowed
Divorced
Total
59.0 58.3 54.8 56.3 54.9 55.1
61.1 64.4 57.1 57.3
1.6 9.3
2.3 9,9
3.0 9.4
2.5 8.7
2.0 9.5
0.8 3.0
0.4 0.8
0.6 1.1
1.5 2.7
0.6 2.1
48.6 51.4 49.1 50.9 51.4 48.6 50.2 49.8 49.0 51.0
N.B. M - Males
F - Females
Source: Computed from Malaysia, Department of Statistics
1975:335-359;
and [image:41.577.73.468.66.618.2]Table 2-13: Percentage Distribution of Head of Household by Sex, Ethnic Groups and Stratum, 1980
Ethnic Group Malay Chinese Indians Persons
Sex M F M F M F M F
Urban 81.3 18. 7 78.7 21. 3 85.9 14. 1 80.5 19.5
Rural 82.3 17.7 80.4 19. 6 86.2 13.8 82.3 17 .5
P.M'sia 82.1 17 .9 79.4 20.6 85 .1 13.9 81.6 '18.4
Source: Malaysia, Department of Statistics 1983a:145-147
were important differences between the ethnic groups. The headship
rates of Chinese and Indian males were lower than those of Malay males in every age-group. The differences in headship rates between
ethnic groups was most marked in the younger ages: whereas 75. 9
per cent of the Malay males aged 30-34 headed households, the
corresponding figures for Chinese and Indians were 54. 9 per cent
and 63.3 per cent respectively (Table 2-14). This pattern would
suggest that, among the Chinese and Indians, average household sizes were larger, and also that a higher proportion of the
households of these two ethnic groups consisted of extended
families, as noted earlier. One implication of this is that, if it
is assumed that the new households found in these ethnic groups
have a preference for nuclear family arrangements, there will be a
greater need for housing among these two groups. Al though there
are no comparable data to show the trend in headship rates, future
changes in social values, continuing urbanization and the influence and expansion of pension and retirement schemes will probably lead
to increases in the headship rate, especially among the younger
[image:42.574.79.467.117.308.2]31
Table 2-14: Headship Rate by Ethnic Group, Sex and Age: Urban Areas, 1980
---Ethnic Malay Chinese Indians Persons
Group
---AgeGroup M F M F M F M F
---15
-
19 3,97 2.33 3.82 2.17 2.36 0.69 3,70 2.1020 - 24 22.29 8.92 13.93 5,44 13.92 2.58 17.58 6.61
25
-
29 55, 17 10.25 32. 51 6.18 38.12 4,09 32.37 40.8430 - 34 75,90 10.24 54,93 8.16 63.35 6.63 63.65 8.71
35 - 39 84.59 11.93 70.17 11 • 18 74, 81 10.34 75,55 11 • 50
40 - 44 87.65 14.87 77.80 15.47 81 ,45 16.07 81 ,45 15. 34
45 - 49 89.08 18.57 82.22 20.00 80.95 19.78 84.35 19.69
50 - 54 89.27 24.49 84.79 25.29 77,45 24.28 85.06 24,92
55
-
59 87.50 28.29 84.09 28.25 72.94 22.81 83.07 27. 6160 - 64 84.76 31.30 80.81 29.13 70.59 21.43 80.05 28.95
65+ 77 .27 31.46 67 .19 24.82 58.16 18.64 68.01 25.97
15 above 50.33 11.54 45,75 111.73 46.17 8.63 4 7. 50 11 • 31
N.B.
M - Males
F - Females
[image:43.577.66.473.82.545.2]3.1 Introduction
CHAPTER 3
PROJECTION OF THE POPULATION
For the purposes of this study, projections are made in two
phases: the projection of the population for all of Peninsular Malaysia and the projection of the the urban population in the
Peninsula. The projections for all of Peninsular Malaysia were made in order to provide an overview of the population growth in the
Peninsula, and, by comparison with the projection for urban areas,
the expected urbanization trends. The projections were made using
the FIVFIV program (Shorter and Pasta 1974). This program uses a
modified. cohort-component method for projecting the population,
which takes into account the effect on population growth of the
patterns of mortality, fertility and migration~ Projections were
made for each sex and ethnic group by five-year age-groups for
five-year intervals from 1980 to 2010.
Aside from the total numbers, the principal characteristics to be examined in these projections are age, sex, and ethnicity, all
of which vary across the projections according to the fertility,
mortality and migration assumptions. Three alternative assumptions
were used for making the projections for each ethnic group for the
whole of Peninsular Malaysia.
1. Constant fertility and declining mortality,
2. Declining fertility and mortality according to past
trends, and
33
according to past trends. International migration and net
migration from East Malaysia are considered to be insignificant,
and thus the projections reflect the natural increase of the base
year population in Peninsular Malaysia.
For the projection of the urban population, similar
assumptions regarding fertility and mortality were used. However,
since the growth of the urban population not only reflects changes through natural increase but also rural to urban transfers, the
level of net annual rural to urban change by age and ethnic group will be incorporated into this projection. As stated earlier, such
changes involve not only actual migrants, but also persons who.
shift from one category to the other due to changes in urban
boundaries or in the classification of places.
The purpose of these projections is to illustrate the
consequences of population growth under various assumptions. These
projections are not intended to be actual predictions of future
population growth, but rather as estimates that can be used as a basis for the projection of the number of households and thus
housing needs in the Peninsula for a 30-year period (1980-2010).
3.2 Limitations of the Assumptions and Projections
The limitations of this exercise are largely due to the
simplicity of the assumptions. In the model, the fertility
distributions for all ethnic groups are assumed to be constant over
the projection period. This assumption might be too crude in view
of changes in the marriage patterns and the reproductive behaviour
of each of the ethnic groups, but the effect on total numbers
probably is not great.
In the first model, the total fertility rate is constant from
the base year while in the other two projections it is assumed to
decline lineally. This assumption may also be too simplistic, as
changes in the total fertility rate, which are generally influenced
show a consistent pattern over a period of time, but such
fluctuations are difficult to predict and incorporate into
projection assumptions.
In projecting the urban population, the assumptions regarding
fertility and mortality are similar to those used for the whole
Peninsula. Throughout the projection period, the age and sex
distribution of net rural-urban changers, which was calculated by comparing the 1970 and 1980 census age distribution, is assummed to
remain constant, although this distribution also can be expected to
change over time. Again, such changes probably will have only a
minor effect on the resulting numbers. More serious if the
incorporation of rural to urbn transfers through boundary changes
and reclassification, but their inclusion was necessary in order to make some estimate of the age and sex distribution of all changes,
including true migrants.
In spite of these limitations, this model is still considered useful as a guide to indicate the extent of the expected increase
in population, which will then be used to project the number of
households and housing needs.
3.3
Assumptions3.3.1
Mortality for Peninsular Malaysia and Urban AreasFor the whole of Peninsular Malaysia, the available data on crude death rates since World War II indicate that there has been a
gradual reduction in mortality, as noted Figure 2-1. Similar patterns of change are observed for expectation of life at birth as
shown in Table 2-5. In line with the fall in mortality,
life-expectancy values have risen by 10.4 years and 7.4 years for
females and males respectively between 1957 to 1980. The current
high expectation of life at birth places Peninsular Malaysia in the
same group of countries as Singapore, Hong Kong and the Republic of