COMMISSION
OF THE EUROPEAN COMMUNITIES
eporf by
the
Commission
on
the
behaviour
of
the
oil companies
in the Community during
the period horn October 1973
to March 1974
The Commission's report on the behaviour of the oil companies in the community during the period from October 1973 to March 1974 analyses both the structure of the oil industry and the considerable modifications to it which were brought about by the Israelo-Arab conflict.
It also studies the relations between the oil companies and the public authorities during the period of several months when shortage threatened.
Report by the Commission
on the behaviour of the oil companies
in the Community during the period
from October 1973 to March 1974
STUDIES
© Copyright EEC, Brussels, 1976 Printed in Belgium
INTRODUCTION
st
On 21 December 1973 "the Commission issued a Press Statement the text of which was as follows :
"Investigations "by the Commission in the oil sector
In the present circumstances of the oil products market, the Commission is disturbed about the supply position of oil products distributing firms independent of the integrated groups which have their own refining facilities. These independent firms often encounter grave supply difficulties in connection with the common market
refineries and some are in an alarming situation.
The Commission considers that arrangements should be made to ensure that the present circumstances do not give rise to the
elimination of independent trading or its absorption by the big companies.
Refusal by the big companies to supply the independent distributors in an equitable manner may give rise to an application of the competition rules of the Treaty and in particular Article 86
thereof.
The same holds good for practices which consist in the big companies applying to their trading partners different conditions for the provision of equivalent services or subjecting the signature of contracts to the acceptance by their partners of extra services.
The Commission has decided to make the requisite investi-gations with the firms ".
The circumstances to which the Commission referred were those which resulted from the events following the war between Israel and Arab countries of 6 to 16 Octob«
disrupted the international oil market.
+ Vi +Vi
and Arab countries of 6 to 16 October, 1973 and which completely
This report contains the results of the enquiry undertaken by the Commission and provides at the same time information requested by the European Parliament.
In no way does the report replace any procedures' which the Commission has commenced, or may commence,in application of
P A R T I
THE ENQUIRY BY THE COMMISSION
A. SCOPE AND OBJECTS OF THE ENQUIRY
The Commission's intention to commence investigations was widely reported particularly since public interest in the oil
companies had, since before the crisis, been whetted by several enquiries pursued in other countries. Particular mention may be made of the hearings before a Senate Committee in the United
States on the market performance and competition in the petroleum industry, the enquiry by a French parliamentary committee into oil companies operating in France and enquiries undertaken by the Swiss Commission on Cartels. However, the only enquiry which was concerned directly with events during the oil crisis was that undertaken in Germany by the Bundeskartellamt, which conducted public hearings on the activities of oil companies in Germany.
Even before December 1973 however, the Commission had observed in the Second Report on Competition Policy ^ when dealing with the price trends of crude oil and petroleum products and the competitive situation in that market, that is was watching carefully
(2) a very unstable situation. In the Third Report on Competition Policy , the Commission referred to its decision to open necessary investigations into producer companies and dealers in the oil industry and expressed its concern that the price trends would give rise to circumstances in which anti-competitive practices might develop. It mentioned
particularly the danger of the application by member states of national regulations concerning prices of oil products. Although effective in slowing down the tendency of prices for such products to rise, these regulations might nevertheless open up possibilities of some national markets becoming more profitable, thus making it attractive for operators of refining capacity to treat these markets advantageously at the expense of controlled markets. The Commission drew attention to the difficulties facing independent dealers and stressed that
it would be able, in particular, to apply Articles 85 and 86 of the Treaty of Rome, in any cases of distortion of competition or anticompetitive practices.
The aims of the general series of investigations initiated by the Commission in December 1973 were to allow it to obtain data and other information concerning a number of
companies within the oil industry which would enable the Commission to determine whether the comportment of companies was compatible or not with the provisions of Article 85 or 86 of the Treaty of Rome. Because of the special circumstances of, and its concern for
the position of independent dealers, the Commission ensured that such firms were included in the planning and conducting of the enquiries.
So far as Article 85 is concerned, the enquiries were to seek evidence of the existence of agreements between undertakings, decisions by associations of undertakings and concerted practices which might affect, or had affected, trade between member states and which had as their object or effect, the prevention, restriction or distortion of competition within the common market during the period of the crisis. Particularly in mind was the possible existence of agreements or concerted practices between oil companies concerning the sharing of markets or the fixing of prices or other conditions for transactions concluded by the parties concerned.
The Commission was concerned at the possibility that major oil companies ivhich occupied a dominant position in respect of a customer might have either restricted their deliveries or imposed prices for continued supplies of oil products which were unfair, even taking into account the spiralling costs of crude oil, or might have been able to make xhe conclusion of supply
contracts subject to the acceptance by the customer of supplementary obligations which were unconnected with the object of the contracts. Where oil companies were likely to occupy a dominant position collective-ly, the Commission was anxious to ensure that markets, production or prices had not been manipulated in a way which would prejudice the interests of consumers.
The various possibilities of abuse of a dominant position arising out of the structure and economics of the oil markets during the crisis period were given special attention by the Commission. The first one concerned the survival of the independent distributors. In most cases, these independent distributors obtained, and indeed relied on, supplies from major oil companies who themselves opera/ted distri-bution or retail networks in competition with the independents. It was therefore possible that because of shortage of supplies these major
companies might have restricted supplies to independent companies, either by direct refusal to. supply or by the imposition of purchase prices whichjbecause of the maximum retail prices imposed by the governments of the countries concerned,did not allow a viable margin for the independents. Although the oil companies might have been able to act in this way to ensure the maintenance of adequate supplies to their own networks, this would have been done at the expense of independent enterprises whose continued existence was threatened.
Another aspect which drew the attention of the Commission was the fact that during the crisis, certain member states had
Β. ORGANISATION OF THE ENQUIRY
a) Choice of countries and companies
The Commission decided to commence its enquiries in those countries which had excess refining capacity and which accordingly
were sources of supply to countries with insufficient refining capacity. In the years 1972 and 19731 the Netherlands, Italy and to a lesser
extent Belgium and France showed positive export balances. Exports from the Netherlands for example went mainly to other countries of the Community and especially to Germany. According to the energy statistics in Eurostat 2/75 » pages 61 and 63, Germany imported in 1973 about 30$ of its domestic consumption of oil products and the quantity involved was equivalent to the total exports of such products from the Netherlands.
In the Netherlands besides member companies of the large international groups such ás EXXON, SHELL, B..P. and CHEVRON (which belongs to the group of enterprises of the Standard Oil Company of California), independent oil companies who were leading exporters of light fuel oil to Germany were included in the investigations.
In Belgium the investigations covered two refineries : Albatros and the Société Industrielle Belge des Pétroles (SIBP), both of which undertook process refining of crude oil made available to them by other companies, who were either shareholders of these refineries or hirers of refining capacity. Other Belgian companies were investigated, among them Elf (Belgique).
In Italy and France besides the large international companies, enquiries were undertaken at the national companies
Azienda Generale Italiana Petroli (Aon3) and Compagnie Française
des Pétroles (C.F.P.) whose operations, although international, are less so than those of the former companies. Esso Italiana and two independent Italian refineries were also investigated.
(* ) Eurostat = Statistical Office of the Communities : Luxembourg.
In France, besides C.F.P., the Société Française des Pétroles Β. P. and several independent companies were included in the investigations.
In the United Kingdom, B.P. Trading Ltd. which handles the international commercial interests of the B.P. Group was investigated.
Investigations were not pursued at that time in Germany in view of the enquiries and public hearings which were then being carried out üj the Bundeskartellamt into "siispicions of abusive advantage of dominant positions in prices sought for petrol, diesel fuel and light fuel oil".
The main oil companies operating in Germany were invited to these hearings which took place in the period 22 March to 4 April 1974· In. view of the special situation concerning the market for oil products in Germany and considering particularly the shortage of refinery capacity in that country, the Commission
estimated that their appraisal of the position in Germany should be based principally on information obtained in other member states where oil products were produced for export to Germany. Information in respect of refining operations carried out in Germany was supplied by the companies or groups who operated those refineries.
The investigations, and the discussions which took place with the companies were generally conducted in an atmosphere of
cooperation, and considerable efforts were made to produce promptly the various documents and information requested by the Commission's inve st igat ors.
b) Choice of period
The enquiries were concerned with the activities of the companies from October 1972.
The first investigations took place in January 1974 at which time the average F.O.B. price for crude oil from the Persian Gulf had reached its highest point.
The period from 1s t October 1973 "to 31s t March 1974
was more precisely analysed by comparison with the corresponding period of the previous year.
c) Choice of products
The following products were covered by the enquiries
- crude oil
- petrol - normal - petrol - super - naphtha
- middle distillates : diesel oil, gas-oil, light fuel oils. - residual fuel oils.
The enquiry was extended to cover aviation jet fuel by the supplementary questionnaire referred to below. This enquiry therefore covered the principal mineral oil products (other than those in gaseous form ), which constitute a significant percentage of the products derived per tonne of crude oil in an average refinery in Europe.
The information received in the course of the enquiry suggested the need to focus further attention on some particular aspects of the activities of the oil companies. It was decided that this supplementary information should be requested from companies under the provisions of Article 11 of Regulation 17·
The questionnaire was aimed at covering the movements of crude oil and oil products between refineries and affiliates of each company on the one hand and, on the other, between these and third-companies. It contained a section on sales prices
practised by that company on the German market. This information was obtained from companies established within the Community as well as from parent companies in third countries.
This is the first time that an enquiry of this magnitude has been undertaken by the Commission in respect of oil companies in connection with the rules of competition of the Treaty of Rome. It is also the first time that a report has been published
following suoh an enquiry. The Commission considered that it would be useful to recall some background information concerning the European oil industry and accordingly one part of the report
examines the structure and organization of the oil industry in the Community and outlines the events leading up to the oil crisis.
PART II
A. STRUCTURE OF THE OIL INDUSTRY IN EUROPE 1. Classification of oil companies
The oil industry in Europe is made up of oil companies of varying sizes whose structures are often very different but which
can be grouped into various categories.
Traditionally the oil industry is divided into two parts: the seven international companies - often referred to as the seven majors — with their subsidiary companies throughout the world,on the one part, and, on the other part, those companies which are not attached to these and which might therefore be described generally as independents.
However this division is arbitrary and no longer reflects the present structure of the oil industry, especially in Europe.
Ir a communication to the Council dated 18 December 1968, entitled "The First Guidelines for a Community Energy Policy" from the Commission, "the Commission attempted to develop a classification which might correspond more closely with the actual situation of the oil industry in Europe. Under this classification, the enterprises which operate en the European oil market fall into three principal categories as follows :
(a) The large international integrated companies operating worldwide · In this category are placed seven fully integrated companies ; five American - Standard Oil Company of New Jersey (Esso or Exxon), Texaco Inc. (Texaco), Gulf Oil Corporation (Gulf), Standard Oil
Company of California (Chevron) and Mobil Oil Corporation (Mobil) - and two European : Royal Dutch Shell (Shell) and British
Petroleum Company (B.P.)
(b) The integrated oil companies of which the activities are to a greater or lesser degree concentrated in one or several member states. There are in this category two French companies : Compagnie Française des Pétroles (CFp/ïotal) which is often included among the large international companies and the Enterprise de Recherches et d'Activités Pétrolières (Elf/ERAP); one Italian company : Ente Nazionale Idrocarburi (ENI); one German company : Veba
Aktiengesell-schaft and one Belgian company : Petrofina S.A. (Fina).
With t h e exception of t h e last-named, a l l t h e s e companies belong t o t a l l y or p a r t l y t o the corresponding member s t a t e .
(c) Smaller companies which import and d i s t r i b u t e o i l products and of which some have t h e i r own r e f i n e r i e s . Oil companies of t h i s type may be f u r t h e r divided i n t o t h r e e groups from t h e point of view of s i z e and t h e extent of t h e i r operations.
In t h e f i r s t group one could place c e r t a i n i n t e r n a t i o n a l companies most of which are of United S t a t e s o r i g i n and which operate r e f i n e r i e s and d i s t r i b u t i o n networks, such as t h e Marathon Oil Company ( U . S . ) , CONOCO ( U . S . ) , t h e Burmah Oil
Company Ltd. (U.K.) and P h i l i p s Petroleum Company ( U . S . ) .
Besides t h e s e i n t e r n a t i o n a l companies one^ finds European companies whose a c t i v i t i e s axe l a r g e l y l i m i t e d t o one country i n the EEC. In t h i s group i s Anonima P e t r o l i I t a l i a n a - API ( I t a l y ) which has a r e f i n e r y and d i s t r i b u t i o n network.
The t h i r d group might include a very large number of small or medium-sized o i l companies which s p e c i a l i s e in t h e wholesale or r e t a i l d i s t r i b u t i o n of o i l products and which have no r e f i n e r i e s
(Commission of t h e European Communities : " Small and medium-sized o i l companies in the European Communities ", XVIl/415/74
-19 December, -1974)·
In each country of t h e EEC,about t e n of t h e l a r g e o i l
companies from t h e above t h r e e categories (a) , (b) and (c) are a c t i v e , each possessing one or more r e f i n e r i e s and/or a dense d i s t r i b u t i o n network. Alongside t h e s e l a r g e r companies the majority of t h e small
or medium-sized o i l companies are concentrated at t h e l e v e l of d i s t r i b u t i o n . Their importance i s u s u a l l y regional or even more l o c a l . Altogether,
however, they hold about 20 fo of t h e market for o i l products in the
ECC (See Part V ) .
Vihat has j u s t been s a i d points t o t h e heterogeneous n a t u r e of the s t r u c t u r e of t h e o i l companies operating on t h e market in the EEC. This heterogeneity i s primarily a function of t h e extent t o which t h e various o i l companies have access t o supplies of crude o i l but also
stems from the degree of i n t e g r a t i o n which i s extensive in c e r t a i n undertakings but minimal in o t h e r s .
The following t a b l e (Table l ) shows t h e p r i n c i p a l f i n a n c i a l and operational s t a t i s t i c s in rospect of t h e companies in t h e f i r s t category of e n t e r p r i s e mentioned above :
Animal raralt» of the lar.f international InttfitmUt. coarpani —
Ρ· Ο β* Ρ
5 3 S'S CX) Λ η α "SB-1 < S3
χ " - s £
Ο β
11
I 9.
ς s
H u e of Oil Croup
ESSO ( D X « )
* l a c r e e
Chevron ( 3 o e a l )
* inore-a.«
Oalf
i increaa«
Mobil
i increase
T o t e o
* increase
Rojal Daten Shell
£ i n c r a a a .
B r i t i . h P e t r o l · « ·
* inortaea
Total of tb« eeven large i n t e r n a t i o n a l integrated ecnpaliie.
% i n e r t u í
1968 19T1 1972 1973 1974 1971/1972 1972/1973 1973/1974 1968 1971 1972 1973 1974 1971/1972 1972/1973 1973/1974 1968 1971 1972 1973 1974 1971/1972 1972/1973 1973/1974 1968 1971 1972 1973 1974 1971/1972 1972/1973 1973/1974 1968 1971 1972 1973 1974 1 9 7 1 / 1 9 7 2 1972/1973 1973/1974 1968 1971 1972 1973 1974 1971/1972 1972/1973 1973/1974 1968 1971 1972 1973 1974 1971/1972 1972/1973 1973/1974 1968 1971 1972 1973 1974 1971/1972 1 9 7 2 / 1 9 7 3 1973/1974
Het i n c o a .
(.)
1.277 1.462 1.532 2 . 4 4 3 3 . 1 4 2 5 * 59 ? 2 9 * 452 511 547 844 970 7 * 54 ï 1 5 * 626 561 197 800 I.O65 - 6 5 *
3 0 6 * 3 3 * 431 541 574 849 1 . 0 4 7 6 * 4 8 * 2 3 * 820 904 889 1 . 2 9 2 I . 5 8 6 - 2 *
4 5 * 2 3 * 865 901 735 2 . 1 1 4 3 . 3 6 1 - 1 8 *
1 8 8 * 5 9 * 310 «04 185 953 1 . 4 1 0 - 5 4 *
415 * 4 8 * 4 . 7 8 I 5-284 4 . 6 5 9 9 . 2 9 5 1 2 . 5 8 1 - 1 2 *
100 * 3 5 *
Inount d i s t r i b u t e d
785 851 852 952 1.119 0 1 2 * 1 8 * 218 237 246 263 327 4 * 7 * 2 4 * 291 312 311 296 307 0 - 5 *
4 * 208 259 269 285 326 4 * 6 * 1 4 * 394 436 452 470 571 4 * 4 * 2 1 * 370 454 456 620 727 0 3 6 * 1 7 * 173 196 162 171 191 - 1 7 *
6 * 1 2 * 2 . 4 3 9 2 . 7 4 5 2 . 7 4 8 3 . 0 5 7 3 . 5 6 8 0 1 1 * 1 7 *
Amount r e t a i n e d
U n i o n 492 611 680 1.491 2 . 0 2 3 1 1 * 119 *
3 6 * 234 274 301 581 543 1 0 * 9 3 * - 7 * 335 249 ( - 1 1 4 ) 504 758 - 1 5 4 *
5 4 2 * 5 0 * 223 282 305 564 721 β * 8 5 * 2 8 * 426 468 437 822 1.015 - 7 *
88 * 2 3 * 495 447 279 1 . 4 9 4 2 . 6 3 4 - 3 8 *
435 * 7 6 *
137 208 23 782 1 . 2 1 9 - 8 9 * 3 . 3 0 0 * 5 6 * 2 . 3 4 2 2 . 5 3 9 1 . 9 1 1 6 . 2 3 8 8 . 9 1 3 - 2 5 *
226 * 4 3 *
D e p r e c i a t i o n
I - * 849 1 . 0 6 0 1.136 1.265
' 7 * u * 314 377 406 510 ' β * 2 6 * 420 576 610 609 ' 6 *
0 365 444 493 570
i i *
1 6 * 322 427 551 646 2 9 * Π * 670 1 . 0 3 4 1.257 1 . 3 2 0 22 *
5 * 223 315 394 475 2 5 * 2 1 * 3 . 1 6 3 4 . 2 3 3 4 . 8 4 7 5 . 3 9 5
¡5*
π * C a p i t a l «spendi t u r .
00
1.944 1.811 1 . 9 8 4 2 . 2 3 5 2 . 9 1 0 1 0 * 13 Í 3 0 * 651 722 597 739 1 . 1 4 4 - 1 7 *
2 4 * 5 5 * 1.064
908 71& 823 1.406 - 2 1 *
" Í 7 1 * 603 911 1 . 0 3 0 1.186 1 . 4 5 0 1 3 * 1 5 * 2 2 * I.O65 1.047 1 . 1 1 3 1 . 2 4 1 I . 8 5 9 „
6 * 1 2 * 5 0 * 1 . 3 2 8 1.909 1.993 1.925 2 . 8 4 3 4 * - 3 * 4 8 *
511 955 868 1 . 1 1 5 1.737 - 9 *
2 8 * 5 6 * 7 . 1 6 6 8 . 2 7 1 8 . 3 0 3 9 . 2 6 4 1 3 . 3 4 9 0 1 2 * 4 4 *
Long t . m debt ( e )
2 . 0 8 3 2 . 6 7 9 2 . 6 1 7 2 . 6 7 1 3 . 0 5 2 - 2 *
2i
1 4 * 6 0 4 I . 0 5 4 I . 0 3 2 I . 0 6 4 I.O15 - 2 *
3 *
- 5 *
I . 3 0 5 2 . 1 0 0 1 . 9 4 1 1 . 6 0 8 1.471 - 8 * - 1 7 * - 9 * 748 1 . 1 3 4 1.083 I.O87 1.729 - 4 *
0 5 9 * 1.095 1 . 2 9 0 1.360 1 . 7 7 8 1.897 5 * 317 * Í
1.447 2 . 4 6 1 3 . 5 8 3 3 . 9 9 0 4 . 1 4 0 4 6 * 1 1 * 4 * 607 993 969 1.265 1.456 - 2 *
31 Í 1 5 * 7 . 8 8 9 1 1 . 7 1 1 1 2 . 5 8 5 1 3 . 4 6 3 14.76O 7 * 7 * 1 0 *
Value of f i x e d a e o e t e
( 0 )
1 0 . 0 7 7 1 1 . 9 3 0 1 2 . 6 4 5 1 3 . 4 6 2 1 4 . 8 3 7 6 *
βί
1 0 * 3.491 4.400 4 . 5 3 2 4.831 5.329 3 * 7 * 1 0 * 4.622 5.793 5-418 5.468 6.035 - 6 *
1 * 1 0 * 3.389 4.425 4.979 5.635 6.311 1 3 * 1 3 * 1 2 * 5-960 7.223 7.849 8.477 9 . 5 9 3 _
9Í β * 1 3 * 8 . 1 5 9 1 0 . 3 6 0 1 1 . 4 3 6 1 2 . 8 2 6 1 4 . 0 4 2 1 0 * 1 2 * 9 * 2 . 0 8 0 2 . 9 1 1 3 . 3 5 4 4 . 1 0 3 5 . 0 6 0 1 5 * 2 2 * 2 3 * 3 7 . 7 7 8 4 7 . 0 4 2 5 0 . 2 1 3 5 4 . 8 0 2 6 1 . 2 0 7 7 * 9 * 1 2 *
Return on ■har«· ( d )
13 í u *
13 í
1 9 * 2 1 *
11 í
11 í 11 í lli
1 6 *
1 4 * 1 0 *
Bí
1 5 * 1 8 *
11 í 1 2 * 1 2 * 1 6 * 1 7 . *
1 6 * 1 4 *
13 í 17 í
1 9 *
1 2 * 1 0 * 7 * 1 7 * 2 4 *
9 * 1 0 * 5 * 1 6 * 2 0 *
R e f i n i n g runa ( 0 )
( i l l l o n 231 258 257 288 259 0 1 2 * - 10 *
73 95
105 112 107 11 *
7 * - 4 * 7 4 82 97 99 98 1 8 *
2Í
- 1 * 83 95 110 118 107 1 6 *
7 * - 9 * 120 144 148 153
1533 * ^
3 * -219 251 258 278 244 3 * 8 * - 1 2 *
91 100 114 108 97 1 4 * - 5 *
1 0 * 891 1.025 1.089 I . I 5 6 I.O65 6 * 6 * - 8 *
Product s a l e o
t . - * 244 279 285 309 275 li 8Í
- 11 * ICO 102 108 113 "Ί, 6 *
4 * - 4 * 73 77 84 90 84 9 * 7J - 7 *
94 112 120 124 114 7 * li
- 8 * 129 157 169 174 172 8Í 3 * - 1 * 223 260 272 290 256 5 * 7 * - 1 2 * ·
88 103 115 110 98 1 2 * - 4 * - 1 1 * 951 I.O90 1.153 1.210 1.108 6 * 5 * - 8 *
Saturai Ca. s a l e a ( f )
« i l l i o n . 1 * 53.988 86.925 9 5 . 0 4 0 99.565 IOO.332 9 * s í 1 * 15-485 17.004 17.034 16.097 15.322 0 - 5 * - 5 * 30.521 36.077 3 6 . 4 5 4 34.110 30.205 1 * - 6 * - 1 1 * 27.340 36.138 36.648 37.535 36.505 1 * 2 * - 3 * 33.253 42.621 47.759 46.037 44.273 1 2 * - 4 * - 4 * 34.803 54.488 6 0 . 4 8 2 6 4 . 7 4 3 69.187
This report i s not concerned with the f i n a n c i a l r e s u l t s of the large o i l groups and w i l l limit i t s e l f here t o some comments relevant t o the r e s u l t s given in the t a b l e .
I t must f i r s t be s t r e s s e d t h a t these are consolidated r e s u l t s which include a l l the operations of the companies in the various i n d u s t r i a l sectors and in the different p a r t s of the world where they are a c t i v e .
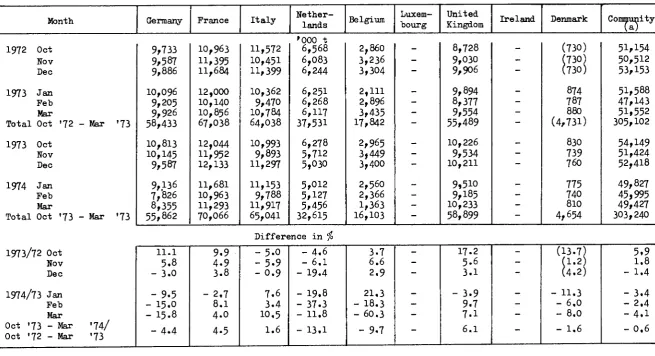
In 1973. the economic expansion and the r e s u l t i n g pressure on the market for o i l products gave r i s e t o increased demand and an increase in the companies' p r o f i t margins. After four years of
stagnation, the increase in the net revenue of the large i n t e r n a t i o n a l companies of American origin from 1972 t o 1973 was 66.6 $ . This improvement was due t o t h e i r operations outside the U.S.A. and, in
p a r t i c u l a r , in Europe. The large European companies enjoyed spectacular increases in t h e i r revenues but reduced the sums d i s t r i b u t e d to permit investments without unduly increasing t h e i r long term debt.
In I974, the net revenues increased on average by 25.4 %
compared with 1973 for the five American majors and by 59 $ and 48 %
respectively for Shell and B.P. The r e s u l t s are a l l the more s t r i k i n g because, in the same period, the sales of products of a l l these companies diminished; in the case of the two European majors the regression was more pronounced, 11.8 fo and 10.9 7>* This i n c r e a s e , unlike that in 1973, stemmed mainly from operations in the U.S.A.
and from very favotirable r e s u l t s in the chemical sector.
Nevertheless, despite the increase in net revenues, the long term debt of companies of which the grovrth had been generally halted in 1973, again swelled s i g n i f i c a n t l y .
According t o company r e p o r t s , the s i t u a t i o n reversed during the t h i r d quarter of 1974 and in the fourth quarter the l o s s e s were replaced by p r o f i t s .
The development of p r o f i t s in 1973 was therefore not
continued in 1974: the margin of p r o f i t on concession o i l (see Page 63) was reduced. The considerable increase in the prices of products
curbed consumption. The weather was favorable to fuel economy. The under-employment of transport and r e f i n i n g capacity increased
c o s t s .
2. The role of companies in oil production
Until the middle of the 1950's practically all the production of crude oil in the world, less China, the USSR and Eastern Europe, was produced by the large international companies which were accordingly in a position to determine prices. Since about 1955 however, the structure of the oil industry has been modified slightly. Attracted by the considerable increase in the demand for oil, and by the advantageous conditions of concession agreements granted by new producing countries ^ ', several newcomers have entered the business at the production stage, particularly in the Middle East and in Africa: Occidental Oil, Continental Oil,
Phillips Petroleum, Marathon and ENI are examples of such enterprises. Advantageous conditions of access to production agreed by producing
countries for light crude oil, giving a higher yield, allowed these companies to break into the European market for the sale of light products - petrol and gas oil - without big investments.
Ten years after the creation in September i960 of the Organization of Petroleum Exporting Countries (OPEC), a. collection of circumstances brought an end to a long period of abundance of cheap oil and permitted the producing countries to join together in
controlling production and prices. Among these circumstances were an exceptionally high and maintained increase in the demand for oil in Europe and in Japan and the factors which arose, in the sectors concerned, from the future energy supply in the United States,and, from the aspect of supply, the temporary withdrawal from service of Tapline (the trans-Arabian pipeline from the Persian Gulf to Sidon on the Mediterranean) and the reductions of production in Libya and in Nigeria.
The pressure on the oil market at this period v/as temporary. Nevertheless it was sufficient to change the balance of power in favour of the oil producing countries. Since then the oil companies have had to concede to the oil producing countries on several issues in the course of the series of conferences called by these countries concerning proposals for increasing their revenues as well as their participation in concessions : among these conferences were thoso held at Caracas, December 1970; Teheran, February 1971; Tripoli,.March 1971;
(l) Libya, particularly, had granted concessions on very
advantageous terms in order to break into markets. For several years, taxes were calculated on the actual pries instead of the postea price (see Page·82) and rebates ware granted which were parüiaiiy subsidized by the state.
Algiers, June I97I and Geneva, 1972. However, until 1973 this process of evolution of power had been somewhat slow "because of the differences in the economic situation of the oil producing
countries. The further turmoil between Israel and the Arab countries had injected a fresh political solidarity into the relationship between the oil-producing countries in the Kiddle East which served to accelerate this process of change and which attempts by the oil companies and consumers were unable to curb.
Nevertheless, in 1973 the large oil companies still
controlled 60 % of the oil production in the world, less China, the USSR and Eastern Europe. This percentage was greater - reaching as much as 100 fo in some instances - in most of the Middle East
countries, and in Africa, which areas were of particular importance for the supplies to Europe (see Table 2).
TOTAL PRODUCTICM OF CRUDE OIL DY THE SEVEN f.AJOR OIL COMPANIES 1973
a) Tabel 2
Country of origin
Column
Western Europe
Kolland No-vav
Fed. Rep. of Germany
Africa
jab on
Nigeria
.v.id-!le East Abu Dhabi
Sut il
Cr.an
'.Tu rice y
Oceania Australia 3-un»i Malaysia Latin America/ Caribbean Ecuador Venezuela North Anerica
World total (a)
Total production of crude oil
(1) 15.042 2.578 1.255 1.494 1.579 111 93 6.711 276.795 8.112 8.389 101.496 100.767 1.029.958 61.708 3.396 5.608 293.908 92.586 119.053 14.421 27.491 364.392 3.553 113.152 13.380 11.183 69.934 4.335 262.934 21.961 9.539 10.626 4.178 7.656 174.769 613.043 2.310.924 Cru^: Esso (2) 2.204 -520 747 -937 10.921 _ _ 10.921 -109.389 4.461 -18.845 3.036 -1.059 81.983 -9.729 8.143 -1.586 -82.029 891 -_ 81.138 70.291 284.563
e oil production of th Chevron (3) 28 -28 -202 _ _ -202 102.531 1.698 -18.845 -81.988 -23.990 -23.990 -3.242 992 -2.250 31.222 161.215 Gulf Í4) 151 -151 -25.462 7.276 _ -18.186 71.598 -18.845 -52.753 -10.944 -10.944 33.651 141.806
e seven ma' Mobil (5) I.O35 183 -852 14.664 -3.814 10.850 55.073 4.461 -18.845 3.036 -1.059 27.329 343 1.586 -1.586 -5.890 -5.890 24.822 103.070
or oil companies Texaco (6) 1.417 -28 -1.389 259 57 -202 103.092 1.698 561 18.845 -81.988 -24.540 550 -23.990 -2.860 5.241 9 2.259 6.296 52.292 198.265 Shell (7) 1.836 183 19 747 -937 45.847 -2.590 10.463 32.794 81.565 8.922 -37.690 6.072 -12.258 14.605 -2.018 16.068 550 11.183 -4.335 90 889 -371 44.824
40. 6 37
232.177 B.P. (8) 81_ -80 1 32.794 -32.794 199.952 17.775 -107.687 6.072 66.3OO -2.118 -~ -127 -- -1.600 231.554 Total (2) (3' (9) 6.802 366 690 1.494 -56 80 4.116 130.149 7.333 2.590 25.198 95.028 723.200 35.619 3-396 561 239.6O2 18.216 119.053 12.2S8 18.841 273.293 2.361 75.913 9.243 11.183 51.152 4.335 90 5.759 5.241 9 2.630 151.342 254.515 1.355.650
(9) as a
% of (1) (10) 45,2 14,2 55,0 100,0 -50,5 86,0 61,3 47,0 90,4 29,1 24,8 94,3 70,2 57,7 100,0 10,0 Bl,5 19,7 100,0 85,0 68,5 75,0 66,5 67,1 50,3 100,0 73,1 100,0 62.6 0,4 61,7 49,3 0.2 34,4 86,6 41 ,_5_ 58,7
(a) Excluding China, the U.S.S.R. and Eastern Europe. The total production of this group is approximately 500 million tonnes.
Source: Petroleum Times, July 26, 1974.
3· Structure of refining and distribution in the Community
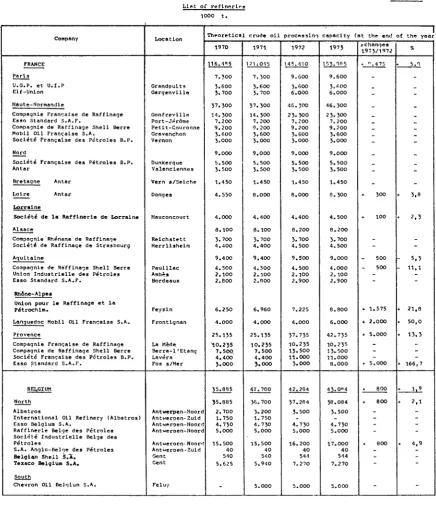
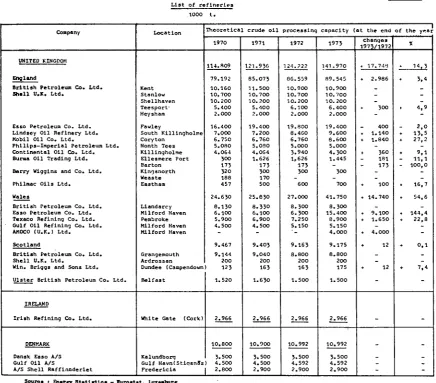
It will oe seen from Table 3 that the oil companies belonging to the first two categories mentioned in Paragraph 1
above control a large share of the refining capacity of the Community.
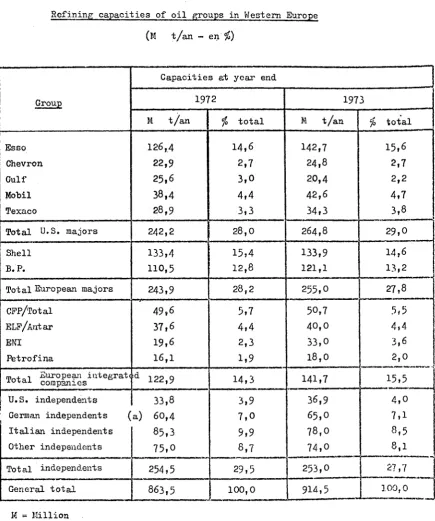
Table 4 sets out the refining capacities in Western Europe of various categories of enterprises.
Two characteristics which are noticeable in respect of the refining capacity of the EEC are the geographical concentration of the refineries and the existence of a number of refineries which are shared by several oil groups. The refineries of the oil companies are situated in particular regions of the Community which are advantageous for the rec'eipt of crude oil and the onward flow inland of oil products, such, as the areas of Rotterdam, Antwerp, the valley of the Seine and the region of Berre,near Marseilles. At the same time, other regions, such as Ireland, Denmark and the south of Germany have insufficient refining capacity.tó meet their domestic needs.
The ownership of some refineries is shared by several oil groups: for example, the refinery operated by S.I.B.P. at Antwerp is owned by B.P. and Petrofina and the Caltex refinery at Rotterdam is owned jointly by Texaco and Chevron. In addition, extensive arrangements exist between oil companies for the exchange of refining capacity.
This joint operation of refineries by some oil companies and the
exchange of refining capacity cannot be without effect on the solidaritjr
of the oil companies concerned.
The exchanges of refining capacity between companies occur particularly between regions where excess refining capacity exists in large facilities (10 million tonnes and above)$ they allow economies of scale in refining costs and avoid the costs of cross-transporting oil products.
So far as exchanges of products are concerned, which also illustrate the solidarity between companies, these are usually complementary to exchanges of refining capacity. They allow companies, particularly those which have no refineries in a particular region,; to avoid the burden of transport in making available products from their own refineries. Petrofina, for example, has developed
particularly such a network of exchange agreements in respect of its share of the products of SIBP at Antwerp and of other refineries in the common market.
r>f re 11 neries
Company
G E R M A N y
S c h l e s w i g H o l s t e i n
D e u t s c h e T e x a c o A . G . O c c i d e n t a l Oel G . m . b . H .
H o m b u r q
B . P . Benzin und P e t r o l e u m A . G . D e u t s c h e Shell A . G .
Esso A . G .
O l w e r k e J u l i u s S c h i n d l e r
B r e m e n M o b i l Oil A . G .
N i e d e r s a c h s e n
G e w . E r d ö l R a f f . D e u r a g N e r a g M i n e r a l ö l w e r k e Peine W i n t e r s h a l l A . G . W i n t e r s h a l l A . G . E r d ö l w e r k e F r i s i a A . G .
N o r d r h e i n W e s t f a l e n
G e l s e n b e r g A k t i e n g e s e l l s c h . U n i o n K r a f t s t o f f
D e u t s c h e Shell A . G . O c c i d e n t a l Oel G . m . b . H . Fina Bitumenwerke G.m.b.H. V E B A C h e m i e A . G . Esso A . G .
Erdöl R a f f . Duisburg G . m . b . H . B . P . B e n z i n und P e t r o l e u m A . G . D e u t s c h e S h e l l A . G .
H e s s e n C a l t e x D e u t s c h i . G . m . b . H .
R h e i n l a n d P f a l z
Elf M i n e r a l ö l G.m.b.H. M o b i l Oil R a f f . W o r t h G . m . b . H .
B a d e n W ü r t t e m b e r g
E s s o A . G .
O b e r r h . M i n e r a l ö l w e r k e G . m . b . H . E r d ö l r a f f i n e r i e M a n n h e i m
B a y e r n
D e u t s c h e S h e l l A . G . Esso A . G .
E r d ö l r a f f i n e r i e I n g o l s t a d t A . G . E r d ö l r a f f . N e u s t a d t G . m . b . H . a C o . B . P . B e n z i n und P e t r o l e u m A . G . D e u t s c h e M a r a t h o n P e t r . G . m . b . H .
S a a r l a n d S a a r l a n d R a f f . G.m.b.H.
N E T H E R L A N D S
W e s t (Noord en Z u i d H o l l a n d )
A s p h a l t en c h e m i s c h e f a b r i e k e n M o b i l Oil N . v .
C h e v r o n P e t r o l e u m ( C a l t e x ) Esso N o d e r l a n d
Shell N e d e r l a n d G u l f
British P e t r o l e u m
L o c a t i o n
H e l d e / H o l s t e i n Brunsbiittel
HaraburgFinkenwerder H a m b u r g H a r b u r g H a m b u r g H a r b u r g Hamburg
B r e m e n
Misburg / H a n n o v e r Peine
S a l z b e r g e n L l n g e n / E m s Emden
G e l s e n k i r c h e n W e s s e l i n g / K ö l n Monheira/Rhoin Essen r.ülhelm/Ruhr G e l s e n k i r c h e n B u e r Köln
Duisburg D i n s l a k e n G o d o r f
R a u n h e i m
S p e y e r W ö r t h / R h e i n
K a r l s r u h e K a r l s r u h e M a n n h e l m
I n g o l s t a d t Ingolstadt I n g o l s t a d t N e u s t a d t / B a y e r n V o h b u r g / D o n a u B u r g h n u s e n
K l a r e n t h a i
A m s t e r d a m A m s t e r d a m
P e r n i s R o t t e r d a m R o t t e r d a m Botlek Perni, sRotterdam R o t t e r d a m E u r o p o o r t R o t t e r d a m F.uropoort
T h e o r e t i c s :
1 9 7 0
1 2 0 . 2 6 3
3.550
5.000
550
1 2 . 5 6 0
4.3O0 4.300 3.600 360 1.800 9.053 2.SSO 18 335 3.750 2.400
3 9 . 5 5 0
7.000 5.600 400 750 500 4.400 5.600 2.000 5.000 8 . 3 0 0
4.500
5.800
2.500 3.500
1 9 . 2 S O
8.90O 6.750 3.600
2 1 . 9 0 0
3.000 4.800 3.200 5.500 4.400 5.000 2.5OO
6 8 . 4 7 2
6 8 . 4 7 2
300
4.000
1 2 . 9 0 0 1 6 . 0 0 0 2 4 . 5 0 0 4.972 5.800
c r u d e o i l
1971
1Γ6.50Π
3.550
3.000
550
1 3 . 3 8 0
5.100 4.300 5.600
380
1.800
9. 0 7 8
2.550
18 360
3.750 2.400
4 5 . 8 5 0
7.000 6.000 500 750 500 7.400 5.700 2.000 5.000 9.OO0
4 . 5 0 0
6.050
2.550 3.500
1 9 . 6 O 0
9.000 7.00O 3.600
2 2 . 4 0 0
3.000 4 . 9 O 0 3.200 3.500 4.800 3.000
2.30O
7 7 . 6 9 7
7 7 . 6 9 7
300
6.000
1 2 . 9 0 0 1 6 . 0 0 0 2 1 . 7 2 5 4.972 1 5 . 8 0 0
p r o c e s s i n g
1972
1 3 5 . 1 6 0
3.550
3.000
550
1 5 . 3 0 0
5.100 4.300 5.500
400
1.800
1 0 . 0 6 0
2.550
360
4.750 2.400
4 3 8 5 0
7.000 6.O00 500 750 500 7.400 5.700 2.000 5.000 9.000 4.500 6.300 2.800 5.500
2 1 . 6 0 0
9.000 7.0O0 5.600
2 3 . 8 0 0
3.000 5.OCO 5.000 5.000 4.800 5.000 2.400
9 9 . 1 3 0
9 9 . 1 3 0
200
6.500
1 5 . 9 0 0 1 6 . 0 0 0 3 0 . 0 0 0 4 . 7 JO 2 5 . 8 0 0
c a p a c i t y (at the end
1973
1 4 5 . 6 1 0
6.000
5.600
400
1 5 . 3 0 0
5.100 4.3OO 5.500
400
1.800
1 0 . 0 6 0
2.550
360
4.750 2.400
5 1 . 5 5 0
7.000 6.000
500 750 500
1 0 . 0 0 0 5.700 2.0OO 9.900 9.000 4.500 6.50O 2.800 5.500
2 1 . 6 O 0
9.000 7.000 5.600
2 6 . 3 0 0
3.000 5.000 3.000 7.000 5.1O0 3.200
2 . 4 0 0
9 9 . 1 3 0
9 9 . 1 3 0
200
6.500
1 5 . 9 0 0 1 6 . O 0 0 5 0 . 0 0 0 4.730 2S.Í100
yChani^s 1 9 7 3 / 1 9 7 2
. Λ?.Α·;Ο
» 2.4 5 0
♦ 2.60O
150 _
♦ 7.500
.
. 2.600
» 4 . 9 0 0
4 2.500
♦ 2 . 0 0 0 * 3 0 0 ♦ 2 0 0
_ ~ 1
of the yeac
%
* 6 9 , 0
♦ 8 6 , 7 - 27,3 _
* 17,1
♦ 35,1
. 8 0 , 0
_
* 10,5
♦ 4 0 , 0 ♦ 6,5 4 6,7
Table 3 h. List of refineries
1000 t.
Company T h e o r e t i c a l c r u d e o i l p r o c e s s i n g c a p a c i t y ( a t t h e end of t h e y e a r ) 1970 1971 1972 1973 é c h a n g e s 1 9 7 3 / 1 9 7 2
U . G . P . e t U . I . Ρ E l f - U n i o n
Haute-Normandle
Compagnie Française de Raffinage Esso standard S.A.F.
Compagnie de Raffinage Shell Berre Mobil Oil Française S.A.
Société Française des Pétroles B.P.
Nord
Société Française des Pétroles B.P. Antar
Bretagne Antar
Loire Antar
Lorraine
Société de la Raffinerie de Lorraine
Compagnie Rhénane de Raffinage Société de Raffinage de Strasbourg
Aquitaine
Compagnie de Raffinage Shell Berre Union Industrielle des Pétroles Esso Standard S.A.F.
Rhone-Al pea
Union pour le Raffinage et la Pétrochim.
Languedoc Mobil Oil Française S.A.
Provence
Compagnie Française de Raffinage Compagnie de Raffinage Shell Berre Société Française des Pétroles B.P. Esso Standard S.A.F.
Grandpults Gargenville Gonfreville Port-Jérôme Petit-Couronne Gravenchon Vernon Dunkerque Valenciennes Vern s/Seiche Donges Haueoncourt Relchstett Herrlishein Pauillac Ambès Bordeaux Feyzin Frontignan
La Mède 3 e r r e - l ' E t a n g L a v e r a Fos s/Mer
3 . 6 0 0 3 . 7 0 0 37.500 1 4 . 5 0 0 7 . 2 0 0 9 . 2 0 0 5-600 3 . 0 0 0
9.000 5 . 5 0 0 5 . 5 0 0
7.300 3 . 6 0 0 3 . 7 0 0
3 7 . 5 0 0 1 4 . 3 0 0 7 . 2 0 0 9 . 2 0 0 3 . 6 0 0 3.000
9 . 0 0 0 5 . 5 0 0 3 . 5 0 0
3 . 6 0 0 6 . 0 0 0 46.300 2 5 - 5 0 0 7 . 2 0 0 9 . 2 0 0 5 . 6 0 0 3 . 0 0 0
9.000 5 . 5 0 0 3 . 5 0 0
153.1RS
3 . 6 0 0 6 . 0 0 0 4 6 . 3 0 0 23.300 7.200 9.200 3.600 3.000
9 . 0 0 0 5 . 5 0 0 3 . 5 0 0
3.70O 4.400 9.400 4.5O0 2.100 2.800 5.700 4.400 9.400 4.500 2.100 2.8O0
6 . 2 5 0
4 . 0 0 0 25.135 1 0 . 2 5 5 7 . 5 0 0 4 . 4 0 0 3 . 0 0 0
6.960
4.000
25.135
1 0 . 2 3 5 7 . 5 0 0 4 . 4 0 0 3 . 0 0 0
3 . 7 0 0 4 . 5 0 0 9 . 5 0 0 4.500 2.100 2.900 4.000 37.755 10.255 13.500 11.000 3.000 3.700 4.500
4 . 0 0 0 2 . 1 0 0 2 . 9 0 0
42.735 10.255 13.500 ll.OOO 8.000 500 500 1.575
2 . 0 0 0
5 . 0 0 0
3 , 8
2 , 3
5,3 1 1 , 1
♦ 21,8
♦ 5 0 , 0
» 1 3 . 5
♦ 1 6 6 , 7
BELiGIUM N o r t h A l b a t r o s
International Oil Refinery (Albatros) Esso Belgium S.A.
Raffinerie Belge des Pétroles Société Industrielle Belge des Pétroles
S.A. A n g l o - B e l g e d e s P é t r o l e s
Belgian Shell S.A. Texaco Belgium S.A.
South
Chevron Oil Belgium S.A.
Antwerpen-Noord Antwerpen-Zuid Antwerpen-Noord Antweroen-Noord Antweroen-Noord Antweroen-Zuld Gent Gent
Pe luy
55.B8S
35.885
2 . 7 0 0 1.750 4 . 7 3 0 5 . 0 0 0
1 5 . 5 0 0 40 540 5 . 6 2 5
3 6 . 7 0 0 200 750 730 000
1 5 . 5 0 0 40 540 5 . 9 4 0
37.2R4 3.500
4.73O 5.000
544 7 . 2 7 0
430°4 38.084 3.500
4 . 7 3 0 5 . 0 0 0
1 7 . 0 0 0 40 544 7 . 2 7 0
2 , 1
[image:29.541.52.489.48.555.2]List of refineries 1000 t.
Tahi» 3 c.
Company ITALY Piemonte Sarpora S.p.A.. Rol B.P. Italiana Liguria
Garrone Raff. Petroli San Quirico S.p.A. Fina Italiana S.p.A. Iplom Shell It. SPI S.p.A. Delle T.lane Lombardia AGI? S.p.A. Amoco Italia S.p.A.. Ante S.p.A. Shell It.
Gulf Italiana S.p.A. Fina Italiana S.p.A -I.C.I.P. S.p.A. Lisca S.p.A.
Lombarda Petroli S.p.A.
Veneto Irom S.p.A.
Friuli-Venezia Giulia Aquila S.p.A.
Emilia-Romagna
Sarom
Montecatini Edison
Toscana Stanic S.p.A.
Marche Api
Lazio
Raffineria di Roma Getty Oli Italiana
Campania Mobil Oli Italiana
Puglia
Stanic S.p.A,
Montecatini Edison Shell It.
Sicilia
Mediterranea S.p.A. A.B.C.D. S.p.A.
Anic Gela Mineraria S.p.A. Esso Rasiom Sincat S.p.A. . Sardegna Saras Sardoil Location Trecate Viguzzolo Volpiano Genova Genova Genova Busalla La Spezia Areola Genova Cortemaggiore Cremona Sannazzaro Rho Bertonico Milano Mantova Valmadrera Villasanta Venezia Trieste Ravenna Ferrara Livorno Falconara
Pantano di Grano Gaeta Napoli Bari Brindisi Taranto Milazzo Ragusa Gela Augusta Priolo Sarroch Porto Torres
Theoretical crude oli
1970 1971
169.880 12.050 7.800 ■ SO 5.000 16.650 6.700 1.700 1.600 5.700 850 100 21.820 140 5.000 6.500 5.700 330 2.600 450 1.100 5.300 3.000 7.960 7.700 260 4.600 3.300 6.000 4.000 2.O00 7.300 10.360 3.800 1.560 5.000 47.010 10.000 200 5.040 10.770 13.000 23.730 18.000 5.730 processing 1972 173.7110 12.850 7.800 50 5.000 16.650 6.700 1.700 1.600 5.7O0 850 100 25.720 140 5.000 6.500 5.700 3.900 330 2.600 450 1.100 5.300 3.000 7.960 7.700 260 4.600 3.300 6.000 4.000 2.000 7.300 10.360 3.800 1.560 5.000 47.010 1Í.000 200 5.040 10.770 13.000 25.730 10.000 5.730
capacity /at the end
1973a) 170.G5O 12.850 7.800 50 5.OO0 16.7O0 6.750 1.700 1.600 5.700 850 100 28.390 140 5.000 6.500 5.700 5.800 3.!-00 450 1.300 5.3OO 3.000 7.960 7.700 260 7.400 3.300 6.450 4.000 2.450 7.3OO 9.260 3.800 1.560 3.900 47.010 18.000 2O0 S.040 10.770 13.000 23.730 18.000 5.750 changes 1973/1972
• 4.870
;
4 50 4 50
* 2.670
♦ 1.900 330 4 900
« 200
4 2.800
4 450
4 450
- 1.100
- 1.100
-~
1
of the yea
%
2,0
~
0,3 0,7
4 10,4
4 40,7 - 100,0 4 34,6
4 18,2
_ .
4 60,9
4 7,5
4 22, S
10,6 22,0 "
(a) 1 July 1973
Table 3 d. List of refineries
Company UNITED KINGDOM England
British Petroleum Co. Ltd.
Shall U.K. Ltd. Esso Petroleum Co. Ltd. Lindsey Oil Refinery Ltd. Mobil Oil Co. Ltd.
PhilipsImperial Petroleum Ltd. Continental Oil Co. Ltd. Burma Oil Trading Ltd. Berry Wiggins and Co. Ltd. Philmac Oils Ltd. Wales
British Petroleum Co. Ltd. Esso Petroleum Co. Ltd. Texaco Refining Co. Ltd. Gulf Oil Refining Co. Ltd. AMOCO (U.K.) Ltd. Scotland
British Petroleum Co. Ltd. Shell U.K. Ltd.
Win. Briggs and Sons Ltd. Ulster British Petroleum Co. Ltd.
IRELAND
Irish Refining Co. Ltd. DENMARK
Dansk Esso A/S Gulf Oil A/S
A/S Shell Raffinaderiet
Location Kent Stanlow Shellhaven Teesport Heysham Fawley
South Killingholme Coryton Nonth Tees KlUlngholme Ellesmere Port Barton Kingsnorth Weaste Eastham Liandarcy Mllford Haven Pembroke Milford Haven Milford Haven Grangemouth Ardrossan Dundee (Campendown Belfast
White Gate (Cork)
Kalundborg Gulf Havn(Stiqsn£s Fredericia
Theoretical crude oil 1970 114.809 79.192 10.160 10,700 10.200 5.400 2.000 16.400 7.000 6.750 5.080 4.064 300 173 320 188 457 24.630 8.130 6.100 5.9O0 4.500 9.467 9.144 200 ) 123 1.520
2.966 10.800 3.500 ) 4.500 2.8O0 1971 121.936 85.073 11.500 10.700 10.200 5.400 2.000 19.400 7.200 6.760 5.030 4.064 1.626 173 300 170 500 25.830 8.550 6.100 6.900 4.500 9.405 9.040 200 163 1.630 2.966 10.900 3.500 4.500 2.900 processine 1972 124.222 86.559 10.900 10.700 10.200 6.100 2.000 19.800 8.460 6.760 5.000 5.940 1,626 173 300 600 27.000 8.500 6.300 7.250 5.150 9.163 8.800 200 163 1.500 2.966 10.992 3.500 4.592 2.900
capacity (at 1973 141.970 89.545 10.900 10.700 10.200 6.400 2.000 19.400 9.600 8.60O 5.000 4.300 1.445 300 700 41.750 8.300 15.400 8.900 5.150 4.000 9.175 8.800 200 175 1.500 2.966 10.992 5.500 4.592 2.900 the end changes 1973/1972 , . 4 _ 4 4 » * 4 4 4 4 4 + 17.748 2.986 _ 300 400 1.140 1.B40 360 181 173 100 14.740 9.100 1.650 4.000 12 _ 12 _ _ 1 of the year
t
♦ 14,5 3,4 _ 4,9 2,0
* 1 3 , 5
4 27,2
9,1 11,1 100,0
4 16,7 4 54,6
_
4 144,4 4 22,8
* 0,1
_ 7,4 _ _
Souro« : Energy S t a t i s t i c · - Eurostat. Luxemburg
[image:31.541.53.490.52.435.2]Table 4
Refining capacities of oil groups in Western Europe
(M t/an - en %)
Group Esso Chevron Gulf Mobil Texaco
Total TJ«S. majors
Shell B.P.
Total European majors
CFP/Total ELP/Antar ENI Petrofina
Φ . ·, European i n t e g r a t i ioxa± companies
J U.S. independents
1
: German independents (
I t a l i a n independents Other independents Total independents
General t o t a l
Capacities at year end
1972
M t / a n
126,4 22,9 25,6 38,4 28,9 242,2 133,4 110,5 243,9 49,6 37,6 19,6 16,1
id 1 2 2 j 9
33,8 a) 60,4 85,3 75,0 254,5 863,5
% t o t a l
14,6 2,7 3,0 4 , 4 3,3 28,0 15,4 12,8 28,2 5,7 4 , 4 2,3 1,9
14,3
3,9 7 , 0 9,9 8,7
29,5
100,0
1973
M t / a n
142,7 24,8 20,4 42,6 34,3 264,8 133,9 121,1 255,0 50,7 40,0 33,0 18,0 141,7 36,9 65,0 78,0 74,0 253,0
9 H , 5
% t o t a l
15,6 2,7 2,2 4,7 3,8 29,0 14,6 13,2 27,8 5,5 4,4 3,6 2,0 15,5
4 , 0 7,1 8,5 8,1
27,7
100,0
M = Million
(a) details for VEBA 26,8
NB.: The expression VEBA refers to the into being during the crisis. Source : Statistics published by the
3,1 29,4
VEBA GBAG group which came
Direction des Carburants, Prance.
3,2
Β. THE OIL CRISIS
1. Trends i n t h e demands for energy i n t h e Community between i960 et 1973
During t h e p e r i o d i960 t o 1973 t h e gross domestic energy consumption of t h e n i n e c o u n t r i e s of t h e Community i n c r e a s e d at an
annual r a t e of 4· 7 Ì0> But w h i l s t t h e consumption of hydrocarbons
( o i l and n a t u r a l gas) i n c r e a s e d a t an average r a t e of annual growth of almost 13 $ , t h e consumption of s o l i d f u e l s ( c o a l s and l i g n i t e )
reduced a t a r a t e of about 3.4 f> p e r annum.
The d i s p a r i t y between t h e s e r a t e s l e d t o a d i s t i n c t change
i n t h e p a t t e r n of dependance on t h e v a r i o u s sources f o r t h e energy
consumption of t h e Community. In i960 s o l i d f u e l s s t i l l accounted f o r
about 67.4 Ì° of t h e t o t a l energy consumption as compared with 26.9 Ì°
f o r hydrocarbons. In 1973 t h e s i t u a t i o n was r e v e r s e d . Hydrocarbons t h e n
accounted f o r 71· 9 f° of t h e t o t a l energy consumption, w h i l s t s o l i d
f u e l s accounted f o r no more t h a n 23.7 /» (See Table 5 ) ·
T^ble S
Domestic consumption of primary energy i n — ¿
t h e enlarged European Economic Community
Energy sources
Coal and e q u i v a l e n t s
L i g n i t e and équivalents Oil and e q u i v a l e n t s
N a t u r a l gas Other f u e l s
E l e c t r i c a l
energy-Tot a l
I960
M t e c
463 33 185 13 1 41 736 %
t o t a l
62.9
4-5-2 5 . I
1.8 0 . 1
5r6
100.0
1970
M t e c
333 35 674 88 2 57 1.189 7" t o t a l
28.0
2.9 56.7
7 . 4 0.2
4.8
100.0
1971 M t e c
299 34 704 114 2 53 1.206 %
t o t a l
24.8
2 . 8
58.4
9.4 0.2
4 . 4
100.0
1972
M t e c
27I 35 750 147 2 57 1.262 * t o t a l
21.5 2 . 8
59.4 11.6 0.2 4-5 100.0 1973 M t e c
280 37 793 163 2 57 1.337 %
t o t a l
20.9
2.8
59-3 12.6 0 . 1
4-3
ro.c
t o o = tonnes of coal e q u i v a l e n t
Source : B u l l e t i n of Energy S t a t i s t i c s - EUROSTAT, Luxembourg.
The explanation of t h i s development l i e s i n t h e f a c t t h a t
during t h e decade i960 t o 1970, o i l was abundant and cheap. This
s i t u a t i o n had t h e e f f e c t of a c c e l e r a t i n g t h e shrinkage of t h e coal
i n d u s t r y and slowing down t h e development of n u c l e a r energy i n t h e
Community.
As a result, in 1973 almost 60 % of the energy needs of the Community was covered by oil of which about 98$ was imported (see Table 6 ) . Almost 95 % of this oil came from the Middle East and from Africa : Table 6 shows clearly the dependence of the energy requirements of the Community on the countries in these regions of the world.
Table 6 Oil supplies of the European Economic Community
Origin of crude o i l
A. Production of t h e Community
B. Imports from the Near and Middle East
Africa
Rest of t h e world
Total imports
C. TOTAL supplies
(A + B)
I97O M/t 13 265 219 34 518 531 t o t a l
2.4
49.9
4 I . 3
6.4 97.6 100.0 I97I M/t 12 321 183 33 537 549
t o t a l
2.2 58.5 33.3 6.0 97.8 100.0 1972 M/t 11 360 I70 30 56O 571 t o t a l
1.9 63.O 29.8 5-3 98.1 100.0 1973 M/t 11 421 161 28 610
6 2 1 lo
t o t a l
1.8 67.8 25.9 4.5 98.2 100.0 1974 M/t 10 415 137 19 571 581 * t o t a l
I . 7
71.4
23.6
3.3
98.3
100.0
Source : Bulletin of Energy Statistics EUROSTAT, Luxembourg. The countries who, in 1973 depended least on oil for their energy requirements, were the Netherlands and the United Kingdom where, in both cases, dependence on oil was below 5° foi in the case of the Netherlands this is attributable to their resources
of natural gas which has been extensively developed as an alternative fuel whilst the economy of the United Kingdom is strongly and
traditionally related to coal. The countries most dependent on oil were Italy, Ireland and Denmark : in the first two cases 75 % ^¿L in
the third case almost 90 f° of the domestic consumption of prime energy was satisfied by oil (see Table 7 ) .
H
Table 7
Domestic consumption of primary energy in the European Economic Community 1973
Country
Germany Prance
I t a l y
Netherlands Belgium Luxem »òurg
Unixed Kingdom
I r e l a n d Denmark
Community Total !
Hard co
M t e c
8 5 4 0 11 4 17 3 115 1 3 279 a l 37 Ρ
t o t a l
30,5
1 4 , 3
3 , 9
1 , 4
6 , 1
1 , 1
4 1 , 2
0 , 4
1 , 1
100,0
L i g n i t
M t e c
34 1 1 0 0 0 -2 0 38 3 %
t o t a l
8 9 , 5
2 , 6
2 , 6
0
0
0
-5 , 3
0
100,0
Crude o i l
M t e c
209 177 136 4 2 39 2 155 8 25 793 , |M| ,
t o t a l
26,4 22,3 17,·2
5 , 3
4 , 9
0 , 2
19,5
1 , 0
3 , 2
100,0
II,!
N a t u r a l gas
M t e c
39 2 0 21 4 1 10 0 37 -168
t o t a l
23,2
11,9
12,5
24,4
6 , 0
0
2 2 , 0
-100,0
Other
M t e c
1 0 0 -0 0 -™ " 1
| „ 1
f u e l s
4, 7°
t o t a l
100,0 0 0 -0 0 -~ 100,0 Primary e l e c t r i c i t y
,M t e c
12 19 14 0 0 1 12 0 0 58 °/o
t o t a l
20,7 32,8 24,1 0 0 1,7 20,7 0 0 100,0 1
T o t a l consumption
M t e c
380 257 183 87 66 6 319 11 23 1.337 1°
t o t a l
28,4 19,2
13,7
6 , 5
4 , 9
0 , 5
23,9
0 . 8
100,0
m = Million
tec = tonnes equivalent of coal
The differences between the data in Table 5 for 1973 and the data set forth in Table 7 as the "Community total" arise« from the rounding off of the figures.
Sourco f Bulletin of Energy Statistics : EUROSTAT Luxembourg. .
2. The events in 1973
During 1973 there gradually developed a market situation which was particularly favourable to sellers. This was due to events which influenced both the demand and the supply of oil.
During this year, the total world needs had increased by some 8 % which was more rapid than had been envisaged : in Japan and in the United States the increase was 15 % and 4·5 % respectively. Paced with a serious shortage in domestic resources, the national production having decreased slightly, and with inadequate refining capacity, the Government of the United States authorized an increase in imports of crude oil and refined products. Thus the United States for the first time became an important buyer of crude oil from the Middle East and Africa. As a consequence of the restrictions imposed by the U.S. legislation concerning environmental protection, this extra demand was concentrated almost exclusively on the market of crude oil from Africa which has a low sulphur content (Algerian, Libyan and Nigerian oil) as well as that of light products and middle distillates.
These products had been purchased by the United States partly from Europe and this fact, together with a brisk domestic demand, did not fail to cause pressure on the markets for petrol and gas oil,
particularly during the first three months of 1973· Por the whole year, the total demand for oil products in the Community of nine increased by about 6 fo, the demand for gas oil exceeding by 12 fo that of 1972.
All these events influencing demand came about at a moment when the supply situation on the world market was relatively weak. This was attributable to several reasons. Firstly, certain producer countries, particularly Kuwait, Libya, Nigeria and Bahrain had reduced their production for technical reasons or with the aim of conserving their resources. Thus despite the production effort of Saudi Arabia and Iran, the resulting increase in supply was not entirely able to cover the inorease in the demand for oil.
There were, in addition, various factors of a technical and economic character which had the consequence of delaying the development of the capacity of production installations and port facilities for the transport and loading of crude oil in oertain producer countries. These delays were partly due to delays in manufacture and delivery of material for exploitation and, on the other hand, to the postponement by the oil companies of certain investments because of the uncertainty concerning conditions of production which had existed since 1970.