L
eurostat
Theme 2
Economy and finance
Series Β
Short-term trends
ISSN 1011-0844
ECU-EMS information
5 D 1991
Monthly
SWEDISH KRONA OFFICIALLY PEGGED TO ECU FROM 17 MAY
1991
The Swedish authorities have announced their decision to link the Swedish krona to the ecu as of 17 May 1991. The krona will have a fluctuation margin of 1.50% around a central rate of 7.40054 krona to the ecu.
The parity of the Swedish krona was previously maintained by the Swedish authorities at a value based on a basket of 15 currencies, in which the US dollar had a 21.0% weighting and other non-Community currencies had a combined weighting of 24.1%.
The move follows a similar decision by Norway in October 1990 (see ECU-EMS Ν 11/90). A notable feature of the Swedish decision is that the fluctuation margin, which is the same as that which applied to the basket of currencies previously used, is smaller than the narrow exchange rate band of the ERM (2.25% vis-à-vis one another, ie between approximately 2.2 and 2.9% vis-à-vis the ecu, according to the currency, depending on the weight of the currency in the ecu and the different fluctuation margins).
On the domestic markets, the French Treasury offered to exchange its ecu-denominated 8.5% fungible Treasury bonds (OATs) dated 12 May 1997 for ecu-denominated 8.5% OATs dated 15 March 2002. This offer was accepted by the holders of ecu 1.004 billion of bonds, which represented 53.5% of the total outstanding of this issue. Three Greek ecu-linked bonds with maturities of 2, 3 and 4 years were issued on 29 March 1991 for a total amount equivalent to ecu 319 million. Another bond of this type with a maturity of 1 year was launched on 15 April for the equivalent of ecu 368 million.
Two series of Italian ecu-denominated Treasury bills maturing in just over 1 year were issued on 11 April and 16 May for ecu 500 million each. The UK Treasury continued its monthly auctions of 1,3 and 6-month ecu bills, raising a total of ecu 1 billion.
Details of these national issues are available on request from Eurostat.
eurostat
OFICINA ESTADÍSTICA DE LAS COMUNIDADES EUROPEAS DE EUROPÆISKE FÆLLESSKABERS STATISTISKE KONTOR STATISTISCHES A M T DER EUROPÄISCHEN GEMEINSCHAFTEN ΣΤΑΤΙΣΤΙΚΗ ΥΠΗΡΕΣΙΑ ΤΩΝ ΕΥΡΩΠΑΪΚΩΝ ΚΟΙΝΟΤΗΤΩΝ STATISTICAL OFFICE OF THE EUROPEAN COMMUNITIES OFFICE STATISTIQUE DES COMMUNAUTÉS EUROPÉENNES ISTITUTO STATISTICO DELLE COMUNITÀ EUROPEE
BUREAU VOOR DE STATISTIEK DER EUROPESE GEMEENSCHAPPEN SERVIÇO DE ESTATÍSTICA DAS COMUNIDADES EUROPEIAS
L-2920 Luxembourg - Tél. 43011 - Télex: Comeur Lu 3 4 2 3
B-1049 Bruxelles, bâtiment Berlaymont, rue de la Loi 2 0 0 (bureau de liaison) - Tél. 2351111
Note
For any information on
tel. 4301-4785
4301-3288
4301-4770
Fax 4301-4150
the statistics in this bulletin contact Luxembourg:
T. Mathisse
G. Thouvenin
S. Ansion
Contents
IV.
V.
VI.
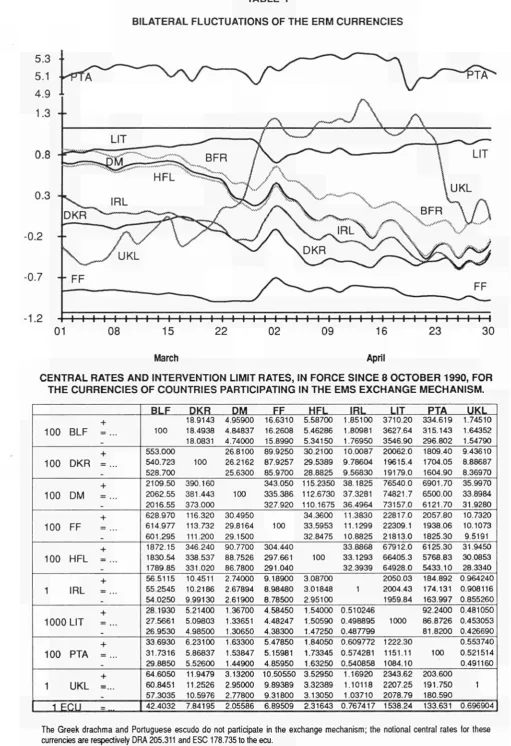
A graph of the bilateral fluctuations of the ERM currencies.
Yearly and monthly issues of ecu bonds.
EMCF rate, interest rates on ecu deposits and yields on ecu bonds.
Last month's ecu bond issues.
Consumer price indices in national currencies.
Consumer price indices in ecus.
VII. Yearly, monthly and daily ecu exchange rates.
© ECSC-EEC-EAEC, Brussels · Luxembourg, 1991
Reproduction is authorized, except for commercial purposes, provided the source is acknowledged.
TABLE I
BILATERAL FLUCTUATIONS OF THE ERM CURRENCIES
I I I I I I I I I I I I I I I I I I I I I I I I I I I I I I I I I I I I I I I I
01
08 15 22 02 09 16 23 30
March
April
CENTRAL RATES AND INTERVENTION LIMIT RATES, IN FORCE SINCE 8 OCTOBER 1990, FOR
THE CURRENCIES OF COUNTRIES PARTICIPATING IN THE EMS EXCHANGE MECHANISM.
+
100 BLF =...
+
100 DKR =...
+
100 DM =...
+
100 FF
+
100 HFL =...
+
1
IRL =...
+
1000 LIT =...
+
100 PTA =...
+
1 UKL »...
1 FOU =
BLF DKR DM FF HFL IRL LIT PTA UKL
18.9143 4.95900 16.6310 5.58700 1.85100 3710.20 334.619 1.74510 100 18.4938 4.84837 16.2608 5.46286 1.80981 3627.64 315.143 1.64352 18.0831 4.74000 15.8990 5.34150 1.76950 3546.90 296.802 1.54790 553.000 26.8100 89.9250 30.2100 10.0087 20062.0 1809.40 9.43610 540.723 100 26.2162 87.9257 29.5389 9.78604 19615.4 1704.05 8.88687 528.700 25.6300 85.9700 28.8825 9.56830 19179.0 1604.90 8.36970 2109.50 390.160 343.050 115.2350 38.1825 76540.0 6901.70 35.9970 2062.55 381.443 100 335.386 112.6730 37.3281 74821.7 6500.00 33.8984 2016.55 373.000 327.920 110.1675 36.4964 73157.0 6121.70 31.9280 628.970 116.320 30.4950 34.3600 11.3830 22817.0 2057.80 10.7320 614.977 113.732 29.8164 100 33.5953 11.1299 22309.1 1938.06 10.1073 601.295 111.200 29.1500 32.8475 10.8825 21813.0 1825.30 9.5191 1872.15 346.240 90.7700 304.440 33.8868 67912.0 6125.30 31.9450 1830.54 338.537 88.7526 297.661 100 33.1293 66405.3 5768.83 30.0853 1789.85 331.020 86.7800 291.040 32.3939 64928.0 5433.10 28.3340 56.5115 10.4511 2.74000 9.18900 3.08700 2050.03 184.892 0.964240 55.2545 10.2186 2.67894 8.98480 3.01848 1 2004.43 174.131 0.908116 54.0250 9.99130 2.61900 8.78500 2.95100 1959.84 163.997 0.855260 28.1930 5.21400 1.36700 4.58450 1.54000 0.510246 92.2400 0.481050 27.5661 5.09803 1.33651 4.48247 1.50590 0.498895 1000 86.8726 0.453053 26.9530 4.98500 1.30650 4.38300 1.47250 0.487799 81.8200 0.426690
33.6930 6.23100 1.63300 5.47850 1.84050 0.609772 1222.30 0.553740 31.7316 5.86837 1.53847 5.15981 1.73345 0.574281 1151.11 100 0.521514 29.8850 5.52600 1.44900 4.85950 1.63250 0.540858 1084.10 0.491160 64.6050 11.9479 3.13200 10.50550 3.52950 1.16920 2343.62 203.600
60.8451 11.2526 2.95000 9.89389 3.32389 1.10118 2207.25 191.750 1 57.3035 10.5976 2.77800 9.31800 3.13050 1.03710 2078.79 180.590
42.4032 7.84195 2.05586 6.89509 2.31643 0.767417 1538.24 133.631 0.696904
TABLE II
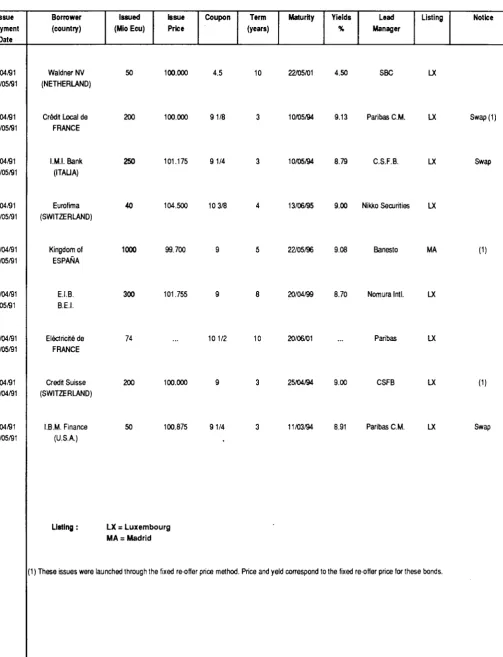
ECU BOND ISSUES (Mio ECU) *
1985 1986 1987 1988 1989 1990 1989 1990 1991 III IV I II III IV I February March April TOTAL 9 462 6 840 7 236 9 188 11 127 15 040 2 700 2 910 2 575 5 510 2 105 4 850 11 645 4 495 6 0 0 0 1 785 European Community Total 5 301 4 226 4 303 5 275 6 461 10 525 1 485 1 610
1 3 7 5 3 720
1 805 3 625
9 610 3 410 5 2 0 0
1 585 Business sector 3 361 2 358 2 058 3 230 4 400 3 9 9 0
1 285 1 250
615 1 4 4 5 805 1 125 950 0 450 1 535 Govern-ments 1 040 558 900 2 5 0 0 500 5 0 0 0
0 0
200 1 300 1 000 2 5 0 0
6 250 2 5 0 0 3 750 0 Insti-tutions 900 1 310 1 3 4 5 1 8 4 5 1 561 1 535 200 360 560 975 0 0 2 410 910 1 000 50 Total 4 161 2 6 1 4 2 933 3 9 1 3 4 6 6 6 4 5 1 5
1 215 1 300 1 200 1 790 300 1 225 2 035 1 0 8 5 800 200 Non-Europea Business sector 3 401 2 204 2 180 3 138 4 141 3 5 6 5
1 140 1 000
1 0 2 5 1 265
300 975
1 535 1 0 8 5
300 200 n Community Govern-ments 200 350 453 575 425 550 75 200 0 300 0 250 500 0 500 0 Insti-tutions 560 60 300 0 100 400 0 100 175 225 0 0 0 0 0 0
Q Recording based on the payment date
TABLE III
OPERATIONS RATES OF THE EMCF (CALCULATION MONTH) AND INTEREST RATES AND YIELDS OF ECU INVESTMENTS (%)
1987 1988 1989 1990 1990 April May June July August September October November December 1991 January February March April
EMCF Deposits
1 month 6.77 7.00 6.71 6.67 9.25 9.10 10.52 10.07 10.50 10.19 10.50 10.03 10.25 9.84 10.25 9.77 10.50 9.90 10.25 9.66 10.25 9.59 10.50 9.64 10.75 10.33 10.75 10.11 10.50 9.62 10.25 9.28 10.00 9.23 3 months 7.10 6.88 9.30 10.32 10.37 10.22 10.05 10.08 10.17 9.97 9.86 9.94 10.39 10.41 9.78 9.30 9.28 6 months 7.16 7.05 9.41 10.55 10.69 10.47 10.30 10.27 10.40 10.28 10.02 10.01 10.42 10.48 9.86 9.33 9.33 1 year 7.27 7.18 9.49 10.69 10.89 10.66 10.47 10.42 10.52 10.50 10.28 10.07 10.39 10.52 9.94 9.34 9.39 Bonds
< 5 years
7.85 7.70 8.86 10.83 11.50 11.04 10.47 10.27 10.41 10.86 10.90 10.69 10.66 10.55 10.04 9.70 9.63 5-7 years 8.24 7.89 8.70 10.42 10.93 10.60 10.33 10.03 10.23 10.46 10.42 10.20 9.97 9.99 9.30 9.20 9.07
> 7 years
TABLE IV
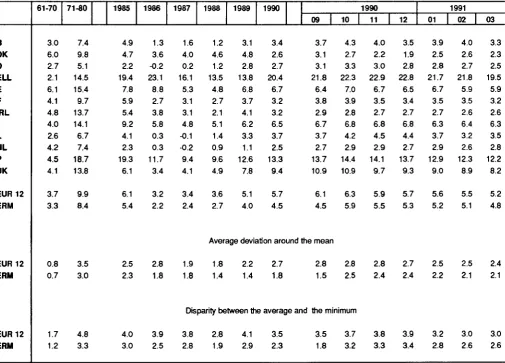
LAST MONTH'S ECU BOND ISSUES
Issue Payment
Date
.704/91 22/05/91
.704/91 10/05/91
.704/91 10/05/91
.704/91 21/05/91
19/04/91 22/05/91
24/04/91 .705/91
25/04/91 10/05/91
.704/91 25/04/91
.704/91 10/05/91
Borrower (country)
Waldner NV (NETHERLAND)
Crédit Local de FRANCE
I.M.I. Bank (ITAUA)
Eurofima (SWITZERLAND)
Kingdom of ESPANA
E.I.B. B.E.I.
Electricité de FRANCE
Credit Suisse (SWITZERLAND)
I.B.M. Finance (U.S.A.)
Listing :
Issued (Mio Ecu)
Issue Price
Coupon
50 100.000 4.5
200 100.000 91/8
250 101.175 91/4
40 104.500 10 3/8
1000 99.700 9
300 101.755 9
74 ... 101/2
200 100.000 9
50 100.875 91/4
LX = Luxembourg MA = Madrid
(1 ) These issues were launched through the fixed re-offer price method
Term (years)
Maturity
10 22/05/01
3 10/05/94
3 10/05/94
4 13/06/95
5 22/05/96
8 20/04/99
10 20/06/01
3 25/04/94
3 11/03/94
Yields %
4.50
9.13
8.79
9.00
9.08
8.70
9.00
8.91
Lead Manager
Listing
SBC LX
Paribas CM. LX
C.S.F.B. LX
Nikko Securities LX
Banesto MA
Nomura Intl. LX
Paribas LX
CSFB LX
Paribas CM. LX
. Price and yeld correspond to the fixed re-offer price for these bonds.
Notice
Swap(1)
Swap
(1)
(1)
TABLE V
CONSUMER PRICE INDICES IN NATIONAL CURRENCY
1985=100 B DK D ELL E F IRL I L NL Ρ UK EUR 12 ERM 1970 34.9 26.8 50.4 10.3 13.5 25.3 15.6 14.2 37.0 40.0 6.4 19.6 25.4 29.8
1980 1985
71.2 100.0 68.3 100.0 82.6 100.0 39.1 100.0 56.2 100.0 63.3 100.0 56.1 100.0 52.5 100.0 70.3 100.0
81.8 100.0 35.2 100.0 70.7 100.0 65.3 100.0 66.7 100.0
1986 101.3 103.6 99.9 123.0 108.8 102.7 103.8 105.8 100.3 100.2 111.7 103.4 103.5 102.3 1987 102.9 107.8 100.1 143.2 114.5 105.9 107.1 110.9 100.2 99.8 122.2 107.7 106.9 104.7 1988 104.1 112.7 101.4 162.5 120.0 108.7 109.4 116.5 101.7 100.6 133.9 113.0 110.7 107.6 1989 107.3 118.1 104.2 184.9 128.2 112.7 113.9 123.7 105.1 101.7 150.8 121.8 116.4 111.9
1990 1990
09 111.0 112.4 121.2 122.7 107.0 107.5 222.6 232.3 136.8 139.2 116.3 117.5 117.6 118.0 131.8 133.2 109.0 109.7 104.2 105.3 170.9 175.1 133.3 136.7 123.0 124.6 116.9 117.5
10 113.1 122.9 108.2 237.9 140.5 118.2 118.0 134.3 110.8 105.6 177.0 137.7 125.5 120.0 11 112.7 122.8 108.0 241.3 140.2 117.9 118.7 135.1 111.4 105.6 178.2 137.4 125.6 119.9 12 112.6 122.4 108.1 247.4 140.5 117.9 118.7 135.4 111.3 105.4 179.7 137.3 125.7 119.9 1991 01 113.4 122.5 108.8 244.9 142.2 118.4 118.7 136.3 111.4 105.5 181.4 137.6 126.3 120.3 02 113.8 122.8 109.1 245.3 142.0 118.6 119.6 137.5 111.4 105.6 184.6 138.4 126.8 120.7 03 113.3 123.0 109.0 249.7 142.5 118.7 119.6 137.9 111.6 106.1 185.5 138.9 127.1 120.8
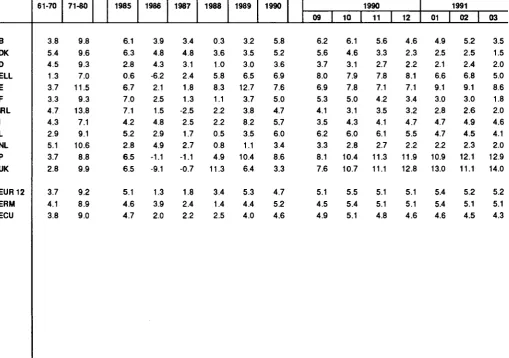
Annual rate of Increase (%)
Β DK D ELL E F IRL I L NL Ρ UK EUR 12 ERM
EUR 12 ERM EUR 12 ERM 61-70 3.0 6.0 2.7 2.1 6.1 4.1 4.8 4.0 2.6 4.2 4.5 4.1 3.7 3.3 0.8 0.7 1.7 1.2
71-80 1985
7.4 4.9 9.8 4.7 5.1 2.2 14.5 19.4 15.4 7.8 9.7 5.9 13.7 5.4 14.1 9.2 6.7 4.1 7.4 2.3 18.7 19.3 13.8 6.1 9.9 6.1 8.4 5.4
3.5 2.5 3.0 2.3
4.8 4.0
3.3 3.0
1986 1.3 3.6 -0.2 23.1 8.8 2.7 3.8 5.8 0.3 0 3 11.7 3.4 3.2 2.2 2.8 1.8 3.9 2.5 1987 1.6 4 0 0 2 16.1 5.3 3.1 3.1 4.8 -0.1 -0.2 9.4 4.1 3.4 2.4 1.9 1.8 Dis 3.8 2.8 1988 1.2 4.6 1.2 13.5 4.8 2.7 2.1 5.1 1.4 0.9 9.6 4.9 3.6 2.7 Aver 1.8 1.4 parity be 2.8 1.9 1989 3.1 4.8 2.8 13.8 6.8 3.7 4.1 6.2 3.3 1.1 12.6 7.8 5.1 4.0 age devi. 2 2 1.4 tween th 4.1 2.9
1990 1990
09 3.4 3.7 2.6 3.1 2.7 3.1 20.4 21.8 6.7 6.4 3.2 3.8 3.2 2.9 6.5 6.7 3.7 3.7 2.5 2.7 13.3 13.7 9.4 10.9 5.7 6.1 4.5 4.5 aüon around the mea
2.7 2.8 1.8 1.5
e average and the m 3.5 3.5 2.3 1.8
TABLE VI
CONSUMER PRICE INDICES IN ECU
1985=100 Β DK D ELL E F IRL I L NL Ρ UK EUR 12 ERM ECU 1970 30.9 28.0 30.0 35.2 24.5 30.1 16.4 32.2 32.5 27.1 28.3 27.0 29.4 30.3 30.2
1980 1985
78.7 100.0 70.0 100.0 72.9 100.0 69.7 100.0 72.8 100.0 73.1 100.0 58.5 100.0 63.9 100.0 77.7 100.0 74.4 100.0 65.9 100.0 69.8 100.0 70.9 100.0 71.2 100.0 71.7 100.0 1986 103.9 104.8 104.3 93.8 102.1 102.5 101.5 104.8 102.9 104.9 98.9 90.9 101.3 103.9 102.0 1987 107.4 109.7 107.5 96.1 103.9 103.8 98.9 107.3 104.6 107.7 97.8 90.0 103.1 106.4 104.2 1988 107.6 113.7 108.6 102.5 112.6 105.0 100.6 109.7 105.2 108.3 102.5 100.2 106.8 107.9 106.8 1989 111.1 117.7 112.1 107.5 126.8 108.9 104.5 118.5 108.8 109.4 112.9 106.5 112.5 112.6 111.1
1990 1990
09 117.5 119.1 123.7 125.0 116.1 116.1 114.9 119.3 136.4 138.8 114.3 115.7 109.3 109.9 125.2 125.2 115.4 116.2 113.1 113.7 122.6 124.3 110.0 115.3 117.8 119.3 118.5 118.5 116.1 117.2 io | 119.7 125.3 116.9 119.7 139.3 116.3 109.7 125.8 117.3 114.1 126.5 116.7 120.1 121.1 118.7 11 119.6 125.2 117.1 119.4 139.2 116.0 110.5 126.6 118.1 114.5 128.1 115.1 120.0 121.3 118.6 12 119.6 124.9 117.8 120.1 138.9 115.4 110.7 127.3 118.3 114.8 128.9 114.1 120.1 121.8 118.6 1991 01 120.7 124.5 118.2 117.5 142.0 115.6 110.8 128.0 118.6 114.7 129.2 115.4 121.1 122.2 118.7 02 121.2 124.9 118.6 116.3 142.9 115.7 110.9 129.3 118.4 114.8 133.1 115.7 121.4 122.3 119.2 03 120.4 125.2 118.3 117.4 143.9 115.5 111.1 130.3 118.7 115.2 134.6 116.8 121.8 123.1 119.3
Annual rate of Increase (%)
Β DK D ELL E F IRL I L NL Ρ UK EUR 12 ERM ECU 61-70 3.8 5.4 4.5 1.3 3.7 3.3 4.7 4.3 2.9 5.1 3.7 2.8 3.7 4.1 3.8
71-80 1985
9.8 6.1 9.6 6.3 9.3 2.8 7.0 0.6 11.5 6.7 9.3 7.0 13.8 7.1 7.1 4.2 9.1 5.2 10.6 2.8 8.8 6.5 9.9 6.5 9.2 5.1 8.9 4.6 9.0 4.7 1986 3.9 4.8 4.3 -6.2 2.1 2.5 1.5 4.8 2.9 4.9 -1.1 -9.1 1.3 3.9 2.0 1987 3.4 4.8 3.1 2.4 1.8 1.3 -2.5 2.5 1.7 2.7 -1.1 -0.7 1.8 2.4 2.2 1988 0.3 3.6 1.0 5.8 8.3 1.1 2.2 2.2 0.5 0.8 4.9 11.3 3.4 1.4 2.5 1989 3.2 3.5 3.0 6.5 12.7 3.7 3.8 8.2 3.5 1.1 10.4 6.4 5.3 4.4 4.0
TABLE VII
ECU EXCHANGE RATES
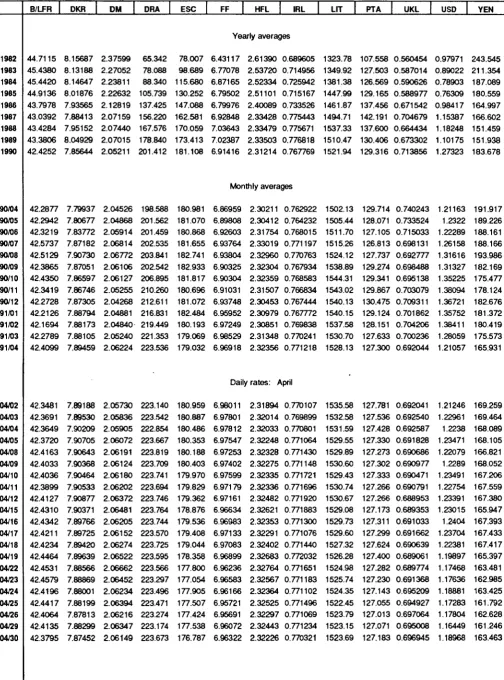
1982 1983 1984 1985 1986 1987 1988 1989 1990 90/04 90/05 90/06 90/07 90/08 90/09 90/10 90/11 90/12 91/01 91/02 91/03 91/04 04/02 04/03 04/04 04705 04/08 04/09 04/10 04/11 04/12 04/15 04/16 04/17 04/18 04/19 04/22 04/23 0424 04/25 04/26 04/29 04/30 B/LFR 44.7115 45.4380 45.4420 44.9136 43.7978 43.0392 43.4284 43.3806 42.4252 42.2877 42.2942 42.3219 42.5737 42.5129 42.3865 42.4350 42.3419 42.2728 42.2126 42.1694 42.2789 42.4099 42.3481 42.3691 42.3649 42.3720 42.4163 42.4033 42.4036 42.3899 42.4127 42.4310 42.4342 42.4211 42.4234 42.4464 42.4531 42.4579 42.4196 42.4417 42.4064 42.4135 42.3795 DKR 8.15687 8.13188 8.14647 8.01876 7.93565 7.88413 7.95152 8.04929 7.85644 7.79937 7.80677 7.83772 7.87182 7.90730 7.87051 7.86597 7.86746 7.87305 7.88794 7.88173 7.88105 7.89459 7.89188 7.89530 7.90209 7.90705 7.90643 7.90368 7.90464 7.90533 7.90877 7.90371 7.89766 7.89725 7.89420 7.89639 7.88566 7.88869 7.88001 7.88199 7.87813 7.88299 7.87452 DM 2.37599 2.27052 2.23811 2.22632 2.12819 2.07159 2.07440 2.07015 2.05211 2.04526 2.04868 2.05914 2.06814 2.06772 2.06106 2.06127 2.05255 2.04268 2.04881 2.04840 2.05240 2.06224 2.05730 2.05836 2.05905 2.06072 2.06191 2.06124 2.06180 2.06202 2.06372 2.06481 2.06205 2.06152 2.06274 2.06522 2.06662 2.06452 2.06234 2.06394 2.06216 2.06347 2.06149 DRA 65.342 78.088 88.340 105.739 137.425 156.220 167.576 178.840 201.412 198.588 201.562 201.459 202.535 203.841 202.542 206.895 210.260 212.611 216.831 219.449 221.353 223.536 223.140 223.542 222.854 223.667 223.819 223.709 223.741 223.694 223.746 223.764 223.744 223.570 223.725 223.595 223.566 223.297 223.496 223.471 223.274 223.174 223.673 ESC 78.007 98.689 115.680 130.252 147.088 162.581 170.059 173.413 181.108 180.981 181.070 180.868 181.655 182.741 182.933 181.817 180.696 181.072 182.484 180.193 179.069 179.032 180.959 180.887 180.486 180.353 180.188 180.403 179.970 179.829 179.362 178.876 179.536 179.408 179.044 178.358 177.800 177.054 177.905 177.507 177.424 177.538 176.787
FF HFL IRL
Yearly averages 6.43117 6.77078 6.87165 6.79502 6.79976 6.92848 7.03643 7.02387 6.91416 2.61390 2.53720 2.52334 2.51101 2.40089 2.33428 2.33479 2.33503 2.31214 0.689605 0.714956 0.725942 0.715167 0.733526 0.775443 0.775671 0.776818 0.767769 Monthly averages 6.86959 6.89808 6.92603 6.93764 6.93804 6.90325 6.90304 6.91031 6.93748 6.95952 6.97249 6.98529 6.96918 2.30211 2.30412 2.31754 2.33019 2.32960 2.32304 2.32359 2.31507 2.30453 2.30979 2.30851 2.31348 2.32356 0.762922 0.764232 0.768015 0.771197 0.770763 0.767934 0.768583 0.766834 0.767444 0.767772 0.769838 0.770241 0.771218
Daily rates: April
EXPLANATORY NOTES
Bilateral currency deviation (graph on page 3).
The various curves should be compared in pairs. To find the differential between two currencies, subtract the (positive or negative) values along the y-axis corresponding to each currency.
The graph is drawn with the curve of the strongest currency above that of the weakest. It shows therefore the relative position of each currency vis-à-vis the other currencies.
When two curves intersect or merge over a period of time there is no differential between the two currencies and their market exchange rate equals their bilateral central rate.
The graph is drawn within a horizontal band corresponding to the maximum 2,25% margin of fluctuation applying at any given moment to market exchange rates and the bilateral central rates of the ERM currencies, with the exception of the PTA and Sterling, which have a maximum authorized fluctuation of 6%. This band is divided symmetrically by a horizontal axis along which the points would be plotted if all currencies were at their bilateral central rate and there were therefore no fluctuations. The daily market exchange rates of all currencies are compared with the relevant bilateral central rates and the differentials between the two calculated.
The maximum fluctuation between two currencies (with the exception of the PTA and Sterling) is shown within the band, symmetrical with the horizontal axis. The fluctuations of the other currencies in relation to either of the two currencies in question are shown within the maximum permissible fluctuation.
The curves are drawn by linking the daily points showing the relative positions of each currency.
Exchange rate grid (Table I).
The intervention limit rates fixed in the official grid do not always correspond exactly to + or - 2.25% (+ or - 6% for the peseta and Sterling) of the central rates, since for each currency pair (whose exchange rates are inversely proportional to one another) the lower limit of the one corresponds to the upper limit of the other.
Ecu bond issues (Table II & IV).
In table II, issues are recorded as at the payment date. This bulletin only covers international and foreign issues in ecus, including ecu issues offering the option of conversion into other currencies. Main source: International Financing Review
Table II shows, under the headings:
Business sector and Governments: national issuers,
both private and public.
Institutions: the European Investment Bank and the
Commission of the European Communities (EEC, ECSC, Euratom).
Organizations: the specialist institutions of the United Nations, the W o r l d Bank, the Council of Europe, etc
Table IV shows detailled information of the latest known issues, whatever the payment date.
The interest rates for 1, 3 and 6 month and 1 year deposits are calculated on the basis of the Friday London market rates (source: Financial Times, London Money Rates, ECU Linked Deposit Bid).
The bonds are classified according to three types of maturities: under 5 years, from 5 to 7 years and more than 7 years. The redemption yields of ecu bonds are calculated each Wednesday from a sample of fixed interest bonds, denominated in ecus and listed on the Luxembourg Stock Exchange. These yields are weighted by the amounts in circulation, (source: Luxembourg Stock Exchange).
The monthly and yearly averages are the arithmetic means of these weekly interest rates and bond yields.
Operations rates of the EMCF (Table III).
The interest rate for transactions in EMCF (European Monetary Cooperation Fund) ecus, is the weighted average of the most representative rates on the domestic money market of the countries whose currencies make up the ecu basket. It is based on the weighting of the currencies in the ecu basket as derived from the ecu central rates in force. The rate thus calculated for a given month applies to EMCF transactions for the following month. In table 3, this rate relates to the month upon which the calculations are based and not to the (following) month during which it is used by the EMCF.
Consumer price indices in national currency (Table V).
The consumer price indices in the national currency of each country measure changes in the purchasing power of one unit of national currency spent in the country concerned.
Two composite indices are calculated, covering all the Member States of the Community (EUR 12) and the ten Member States with currencies participating in the European Monetary System exchange rate mechanism (ERM). (Although the peseta has been participating in the exchange rate mechanism since 19/06/89 and has been included in the calculation of the ecu since 21/09/89, it is only taken into account in the indices relating to the ERM which are included in this bulletin for data after 30/09/89.)
These indices are calculated as weighted arithmetic means (chain indices) of the national indices, the weighting for each Member State being its relative share in the final consumption of households of the group of countries in question (EUR 12, ERM), expressed in purchasing power standards, at current prices and purchasing power parities.
At the foot of the table, the average weighted fluctuations around the mean and the minimum are given for the same groups of countries, with the same weightings. (These are calculated as weighted averages of the absolute fluctuations in relation to the mean and the minimum respectively). They show the degree to which price movements in the Member States in the Community converge.
Consumer price indices In ecus (Table VI).
For each country the index of consumer prices in ecus is calculated by dividing the national consumer price index by the average movement of the national currency in relation to the ecu during the month. It measures the change in the purchasing power of one ecu in the country concerned.
Three composite indices are calculated, covering all the Member States of the Community (EUR 12 and ECU), the 10 Member States participating in the European Monetary System exchange rate mechanism (ERM). Although the peseta has been participating in the exchange rate mechanism since 19/06/89,
and the peseta and the escudo have been included in the calculation of the ecu since 21/09/89, these two currencies are only taken into account in the indices contained in this bulletin for data after 30/09/89.)
These three indices are calculated as weighted arithmetic means (chain-indices). The weightings are defined as follows: for the EUR 12 and ERM indices, the relative share of each Member State in the final consumption of households for the group of countries in question (EUR 12 or ERM), expressed in ecus at current prices and exchange rates (annual weighting). For the ecu index, the relative share of each Member State's currency in the calculation of the ecu (monthly weighting).
Ecu exchange rates (Table VII).
The exchange rates for the ecu against the national currencies of the Member States of the Community, the USD and yen are shown as annual averages, monthly averages (for the current year), and daily rates (for the latest available month).
1 ecu = Σ
100= Σ
BFR DKR DM D R A * ESC* FF HFL IRL LFR LIT PTA
From 21/09/89 the ecu basket has been made up made as follows :
3.301 0.1976 0.6242 1.44 1.393 1.332 0.2198 0.008552 0.13 151.8 6.885
Ecu central rates from 08/10/90.
42.4032 7.84195 2.05586 205.311 178.735 6.89509 2.31643 0.767417 42.4032 1538.24 133.631
Weights of currencies on 08/10/90, calculated on the basis of current central rates, expressed in %:
7.78 2.52 30.36 0.70 0.78 19.32 9.49 1.11 0.31 9.87 5.15
UKL
0.08784
0.696904
12.60
* does not participate in the exchange rate mechanism
Venta y suscripciones · Salg og abonnement · Verkauf und Abonnement · Πωλήσεις και συνδρομές
Sales and subscriptions · Vente et abonnements · Vendita e abbonamenti
Verkoop en abonnementen · Venda e assinaturas
BELGIQUE / BELGIË FRANCE UNITED KINGDOM Moniteur belge / Belgisch Staatsblad
Rue de Louvain 42 / Leuvenseweg 42 1000 Bruxelles/ 1000 Brussel Tél. (02)512 00 26
Fax 511 01 Θ4
CCP / Postrekening 000200550227 Autres distributeurs / Overige verkooppunten Librairie européenne /
Europese Boekhandel Avenue Albert Jonnart 50 / Albert Jonnartlaan 50
1200 Bruxelles/ 1200 Brussel Tél. (02) 734 02 81
Fax 735 08 60 Jean De Lannoy
Avenue du Roi 202 /Koningslaan 202 1060 Bruxelles/ 1060 Brussel Tél. (02) 538 51 69
Télex 63220 UNBOOK Β CREDOC
Rue de la Montagne 34 / Bergstraat 34 Bte 11 / Bus 11
1000 Bruxelles/ 1000 Brussel
DANMARK
J. H. Schultz Information A/S EFPublikationer
Ottiliavej 18 2500 Valby Tlf. 36 44 22 66 Fax 36 44 01 41 Girokonto 6 00 08 86
BR DEUTSCHLAND Bundesanzeiger Verlag Breite Straße
Postfach 10 80 06 5000 Köln 1 Tel. (0221) 20 290 Fernschreiber:
ANZEIGER BONN 8 882 595 Fax 20 29 278
GREECE
G.C. Eleftheroudakis SA International Bookstore Nikis Street 4 10563 Athens Tel. (01) 322 63 23 Telex 219410 ELEF Fax 323 98 21
ESPANA
Boietfn Oficial dei Estado Trafalgar, 27
28010 Madrid
Tel. (91) 4 4 6 60 00
M LindiPrensa Libros,'S.A. Castellò. 37
28001 Madrid
Tel. (91) 431 33 99 (Libros) 431 32 22 (Suscripciones) 435 36 37 (Dirección) Télex 49370MPLIE
Fax (91)275 39 98 Sucursal:
Librería Internacional AEDOS Consejo de Ciento, 391 08009 Barcelona Tel. (93) 301 86 1 5 Fax (93) 317 01 41 Generalität de Catalunya: Llibreria Rambla deis estudie Rambla, 118 (Palau Moja) 08002 Barcelona Tel. (93) 302 68 35
302 64 62
Journal officiel
Service des publications des Communautés européennes 26, rue Desaix
75727 Paris Cedex 15 Tél. (1) 40 58 75 00 Fax (1) 40 58 75 74 IRELAND
Government Publications Sales Office Sun Alliance House
Molesworth Street Dublin 2
Tel. 71 03 09 or by post
Government Stationery Office EEC Section
6th floor Bishop Street Dublin β Tel. 78 16 66 Fax 78 06 45 ITALIA Licosa Spa
Via Benedetto Fortini, 120/10 Casella postale 552 50125 Firenze
Tel. (055) 64 54 15
Fax 64 12 57
Telex 570466 LICOSA I CCP 343 509
Subagenti:
Libreria scientifica Lucio de Biasio AEIOU Via Meravigli, 16
20123 Milano Tel. (02) 80 76 79 Herder Editrice e Libreria Piazza Montecitorio, 117120 00186 Roma
Tel. (06) 679 46 28/679 53 04 Librerìa giuridica
Via 12 Ottobre, 172/R 16121 Genova Tel. (010) 59 56 93
GRANDDUCHÉ DE LUXEMBOURG Abonnements seulement
Subscriptions only Nur für Abonnements Messageries Paul Kraus 11, rue Christophe Plantin 2339 Luxembourg Tél. 499 88 88 Télex 2515 CCP 4924263 NEDERLAND SDU uitgeverij
Christorfel Plantijnstraat 2 Postbus 20014
2500 EA 'sGravenhage Tel. (070) 78 98 80 (bestellingen) Fax (070) 47 63 51
PORTUGAL Imprensa Nacional Casa da Moeda, EP
Rua D. Francisco Manuel de Melo, 5 1092 Lisboa Codex
Tel. (01) 69 34 14
Distribuidora de Livros Bertrand, L d . ' Grupo Bertrand, SARL
Rua das Terras dos Vales, 4A Apartado 37
2700 Amadora Codex Tel. (01) 493 90 50 494 87 88 Telex 15798 BERDIS Fax 491 02 55
H M SO Books (PC 1β) HMSO Publications Centre 51 Nine Elms Lane London SW8 5DR Tel. (01) 873 9090 Fax GP3 873 8463 Subagent: Alan Armstrong Ltd 2 Arkwright Road Reading, Berks RG2 OSO Tel. (0734) 75 18 55 Telex 849937 AAALTD G Fax (0734) 75 51 64
SCHWEIZ / SUISSE / SVIZZERA OSEC
Stampfenbachstraße 85 8035 Zürich
Tel. (01) 365 51 51 Fax (01) 365 52 21 ÖSTERREICH Manz'sche Verlags
und Unlversitatsbuchhandlung Kohlmarkt 16
1014 Wien Tel. (0222) 531 610 Telex 11 25 00 BOX A Fax (0222) 531 6181 TURKIYE
DOnya super veb ofset A.c. Narlibahce Sokak No. 15 Cagaloglu
Istanbul Tel. 512 01 90 Telex 23822 DSVOTR UNITED STATES OF AMERICA UNIPUB
4611 F Assembly Drive Lanham. MD 207064391 Tel. Toll Free (800) 274 4888 Fax (301) 459 0056 Telex 7108260418 CANADA
Renouf Publishing Co., Ltd 61 Sparks Street
Ottawa Ontario K1Ρ 5R1
Tel. Toll Free 1 (800) 267 41 64 Ottawa Region (613) 238 89 856 Telex 0534936
JAPAN
Kinokuniya Company Ltd 177 Shinjuku 3Chome Shiniukuku
Tokyo 16091 Tel. (03) 354 01 31 Journal Department PO Box 55 Chitóse Tokyo 156 Tel. (03) 439 01 24 SVERIGE BTJ Box 200 22100 Lund Tel. (046) 18 00 00 Fax (046) 18 C1 25 AUTRES PAYS OTHER COUNTRIES ANDERE LÄNDER
Office des publications officielles des Communautés européennes 2. rue Mercier
L2985 Luxembourg Tél. 49 92 81
Télex PUBOF LU 1324 b Fax 48 85 73
Price (excl. VAT) in Luxembourg: Single copy ECU 6 · Subscription ECU 56
. * . OFICINA DE PUBLICACIONES OFICIALES DE LAS COMUNIDADES EUROPEAS I C C M 1 Ι Ί 1 1 Γ Ι Ο / Μ , " H ' . KONTORET FOR DE EUROPÆISKE FÆLLESSKABERS OFFICIELLE PUBLIKATIONER i O O I N I U I I " U O t 4
· * « AMT FÜR AMTLICHE VERÖFFENTLICHUNGEN DER EUROPÄISCHEN GEMEINSCHAFTEN ΥΠΗΡΕΣΙΑ ΕΠΙΣΗΜΩΝ ΕΚΔΟΣΕΩΝ ΤΩΝ ΕΥΡΩΠΑΪΚΩΝ ΚΟΙΝΟΤΗΤΩΝ
OFFICE FOR OFFICIAL PUBLICATIONS OF THE EUROPEAN COMMUNITIES OFFICE DES PUBLICATIONS OFFICIELLES DES COMMUNAUTÉS EUROPÉENNES UFFICIO DELLE PUBBLICAZIONI UFFICIALI DELLE COMUNITÀ EUROPEE BUREAU VOOR OFFICIËLE PUBLIKATIES DER EUROPESE GEMEENSCHAPPEN SERVIÇO DAS PUBLICAÇÕES OFICIAIS DAS COMUNIDADES EUROPEIAS