This is a repository copy of A review of pumped hydro energy storage development in significant international electricity markets.
White Rose Research Online URL for this paper: http://eprints.whiterose.ac.uk/98992/
Version: Accepted Version
Article:
Barbour, E., Wilson, I.A. orcid.org/0000-0003-4083-597X, Radcliffe, J. et al. (2 more authors) (2016) A review of pumped hydro energy storage development in significant international electricity markets. Renewable and Sustainable Energy Reviews, 61. pp. 421-432. ISSN 1364-0321
https://doi.org/10.1016/j.rser.2016.04.019
Article available under the terms of the CC-BY-NC-ND licence (https://creativecommons.org/licenses/by-nc-nd/4.0/)
eprints@whiterose.ac.uk https://eprints.whiterose.ac.uk/
Reuse
This article is distributed under the terms of the Creative Commons Attribution-NonCommercial-NoDerivs (CC BY-NC-ND) licence. This licence only allows you to download this work and share it with others as long as you credit the authors, but you can’t change the article in any way or use it commercially. More
information and the full terms of the licence here: https://creativecommons.org/licenses/
Takedown
If you consider content in White Rose Research Online to be in breach of UK law, please notify us by
0
A review of Pumped Hydro Energy Storage development in significant international electricity markets
Edward Barboura,*, I.A. Grant Wilsonb, Jonathan Radcliffea, Yulong Dinga and Yongliang Lia,¤ aBirmingham Centre for Energy Storage, The University of Birmingham
bEnvironmental and Energy Engineering Group, Department of Chemical and Biological Engineering, The University of Sheffield
*corresponding author: edward.r.barbour@gmail.com
¤corresponding author: y.li.1@bham.ac.uk
Abstract
1
1. Introduction
In the last decade, interest in bulk Electrical Energy Storage (EES) technologies has grown significantly as a potential solution to some of the challenges associated with decarbonising electrical energy systems. The transition from systems that are primarily reliant on carbon-intensive fossil fuels to those which use greater amounts of lower-carbon energy sources like renewables and nuclear energy is a broadly accepted policy choice of many countries around the world, although the exact technology choices, the speed of the transition and the level of ambition vary widely. The decarbonisation policies are a response to the compelling evidence around the risks of anthropogenic climate change, and the need to decouple economic growth from environmentally damaging impacts.
2
The limited ability of wind and solar technologies to load-follow is one of the main challenges that bulk EES seeks to address. Several academic studies have highlighted energy storage as an important method of adding the flexibility that is required to integrate large proportions of low carbon energy in electricity networks. An extensive report by Denholm et al. (2010) [2] for the National Renewable Energy Laboratory, USA concludes that high penetrations of variable generation increases the need for all flexibility options, including energy storage. Eyer and Corey (2010) [3] also conclude that renewables integration is one of the major drivers for energy storage while Beaudin et al. (2010) [4] concludes that large scale renewables integration will be a more difficult challenge without energy storage. Steinke et al. (2013) [5] investigates a 100% renewable Europe and finds that without grid and storage extensions the necessary backup generation amounts to roughly 40% of the demand. Cochran et al. (2012) [6] study the best practices for integrating variable renewable generation and
concludes that while there is no one size fits all approach, market mechanisms that promote increased storage should be developed. Although it is generally accepted that smaller percentages of renewable generation can be integrated into many electricity systems without very significant operational changes [2], [7], the scale of transition required to meet the climate change challenge means that additional flexibility is likely to be universally required. This increasing need for flexibility [8] due to the planned increase in the penetration of variable renewable energy sources is, we believe, a major driver for interest in bulk EES.
3
The delays in the development and deployment of CCS or more flexible nuclear technologies in comparison to the speed of recent deployments of solar and wind generation is also a major reason why bulk EES has attracted a growing level of interest from public and private funding sources. Bulk EES also has many other benefits throughout the electrical supply chain, and several studies have discussed these [2]Ð[4], [12]Ð[15]. They include:
¥ facilitating increased deployment of low-carbon generation ¥ facilitating time of use energy management
¥ increasing reliability for end-users
¥ reducing the volatility of electricity prices ¥ increasing system reliability
¥ increasing system flexibility
¥ reducing the need for transmission upgrades/new transmission infrastructure ¥ reducing overall pollutant emissions.
Novel bulk EES technologies under development include Adiabatic Compressed Air Energy Storage (ACAES) [16], secondary (rechargeable) batteries [17], flow batteries [18], Cryogenic Energy Storage (CES) [19], Pumped Thermal Energy Storage (PTES) [20] and Hydrogen energy storage [21].
This paper focuses on the established bulk EES technology Pumped Hydroelectric Energy Storage (PHES), as over 99% of the existing bulk EES capacity worldwide is PHES, comprising a global installed capacity in excess of 125 GW [9]. Compressed Air Energy Storage (CAES) has the next largest installed capacity of 440 MW with two operational plants; Huntorf, Germany and McIntosh, USA [22], [23]. This paper builds on the paper by Anuta et al. (2014) [24] that provides an extensive review of the regulatory and policy environments
4
2.
Pumped Hydroelectric Energy Storage (PHES)
[image:6.612.91.565.295.490.2]PHES stores gravitational potential energy by elevating water. The charging process converts electrical energy into mechanical energy and eventually into gravitational potential energy by pumping water from a lower reservoir to a higher reservoir. The discharging process is the reverse; it converts gravitational potential energy into mechanical energy and then to electrical energy by allowing water to flow down from the higher reservoir to the lower reservoir, driving a turbine that in turn drives an electrical generator. Table 1 gives some of the typical technical characteristics of PHES plants and Table 2 shows several of the countries with the largest installed PHES capacities.
Table 1: Technical characteristics of PHES. Information obtained from [4], [12], [13]
Power 10-4000 MW
Discharge duration at rated power 1-24+ hours
Round-trip efficiency 70-85%
Self-discharge Generally negligible
Response time Minutes
Power capital cost 2000-4300 $/kW
Energy Capital cost 5-100 $/kW
Lifetime 40-60+ years
Suitable storage duration Hours - days
Table 2: Installed PHES capacity by country and current (2014) capacity under construction. Percentage of
total installed generation corresponding to PHES is also given. Data compiled from [9], [25]Ð[28].
Country Installed PHS
Capacity (GW)
Under Construction (GW)
PHES power capacity as a % of installed electrical generating capacity
Japan 24.5 3.3 8.5
China 22.6 11.6 1.8
USA 20.5 - 1.9
[image:6.612.92.560.560.714.2]5
Spain 6.8 - 6.6
Germany 6.3 - 3.5
France 5.8 - 4.4
India 5.0 1.7 2.2
Austria 4.8 0.2 21
Great Britain 2.7 - 3.0
Switzerland 2.5 2.1 12
Portugal 1.1 1.5 6.1
At a country level Japan has the largest installed capacity of PHES at ~25GW [25], which represents over 8.5% of its installed electricity generating capacity. China has the second largest capacity of PHES followed by the USA, however PHES constitutes only 1.8% and 1.9% respectively of their total installed electric generation capacity.
2.1. Historical development of PHES
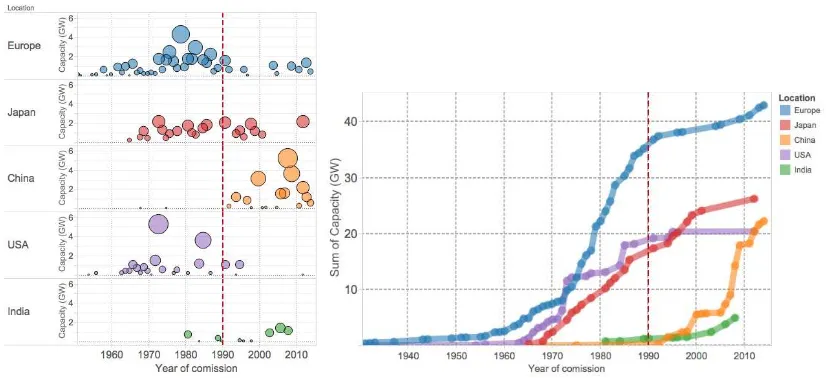
Figure 1: (left) Historical PHES deployment in Europe1, Japan, China, USA and India (GW). The dots
represent each year in which at least one PHES plant was commissioned, and have an area proportional to the
capacity commissioned in that calendar year. (right) Cumulative sum of PHES deployment power capacity
(GW). The list of PHES plants included is available to download [29].
1
Europe in Figures 1 and 2 includes Austria, Belgium, Czech Republic, France, Germany, Ireland, Italy,
[image:7.612.99.512.380.569.2]6
2.1.1. Europe
Figure 1 shows that Europe has the most PHES capacity and that over 80% of it was commissioned between 1960 and 1990. The majority of the schemes are located in the mountainous regions of Austria, France, Germany, Italy, Spain and Switzerland. Although in many countries development was aligned with significant increases in nuclear capacity, some countries like Austria installed significant PHES capacities despite having no nuclear power at all. As Figure 1 shows, the rate of development of PHES in Europe has slightly increased since 2008, which is thought to have been a response to the increasing energy demand during the 90Õs and early 2000Õs (PHES projects have long construction times) and anticipation of increased wind generation. The 430 MW Reisseck II scheme in Austria (commissioned in 2014) and the expansion of the Spanish La Muela pumped storage facility by 852 MW (in 2013 - giving it a total capacity in excess of 2GW) are some of EuropeÕs most recent PHES developments [30].
2.1.2. Japan
7
that Japan is actively pursuing other EES storage options and has developed as a leader in sodium sulphur (NaS) grid-scale electrochemical battery installations [33].
2.1.3. China
Compared to Europe, the USA and Japan, the development of PHES in China occurred relatively recently (Figure 1). Although the first PHES scheme (11MW) was constructed in 1968 and the second in 1975, development after this remained dormant until the 1990Õs. Since then it has progressed rapidly for a number of reasons. Electricity consumption has been growing with ChinaÕs rapid economic development and PHES is seen as particularly useful to bridge the valley-to-peak gap and increase grid-reliability. Governmental and regional targets for carbon reduction have increased the installed capacity of renewable energy, and pumped hydro is regarded as a way to aid integration. The rapid development of wind energy in north and west China with insufficient transmission infrastructure can also be considered as a significant driver for increased PHES development [34]. By the end of 2013, the total installed wind capacity in China was 91.4GW; however the national curtailment rate for wind was 11%, and in some areas this exceeds 25% at certain times [35]. ChinaÕs high share of coal based power generation is another driver for more flexible generation, as most plants are large scale (>300MW) and less efficient and less economic to operate at partial load (the economic factors are exaggerated by high coal prices). The increase in PHES capacity is occurring alongside significant expansions of conventional hydro generation (China has over 280 GW of installed Hydro as of 2013) [36].
2.1.4. USA
8
benefits that EES can provide [2]. Subsequent decreases in the price of oil and gas as well as large decreases in the capital costs of Combined Cycle Gas Turbine (CCGT) peaking units then led to a hiatus in energy storage interest and since 1990 there has been minimal deployment of PHES in the USA. This is not thought to be due to a lack of suitable sites; some articles have suggested that the USA has a PHES potential greater than 1000 GW [9].
2.1.5. India
In India the first pumped storage plant was the 770 MW Nagarjunasagar plant which was fully commissioned in 1981. Between 1981 and 1998 a further 742 MW of PHES was added, and an additional 3450 MW was added between 2003 and 2008 (the ninth and tenth five year plans of the Wholesale Electricity Market of India (WEMI) [37]). The motivation to use pumped hydro in India comes primarily from the desire to meet peak electrical demand; the peak power capacity is short of the peak demand in most states by 10-15%. The aim for pumped hydro plants is therefore to shift electricity from off-peak to peak hours. However most PHES plants have been unable to perform to their full potential due to insufficient availability of off-peak electricity, which is often less than the pumping capacity of the plants [37]. This has meant that many mixed PHES stations have achieved much less than their designed pumping time, and thus their energy output has been lower than projected.
2.2. Market status at commissioning
9
Figure 2: Capacity (GW) of PHES commissioned under different market structures.
2.3. Current ownership of PHES
We find that the largest owner of PHES capacity (in GW) is the State Grid Corporation of China, with over 15 GW of pumped storage capacity. Tokyo Electric Power Corporation has the next largest capacity and operates in Japan, while ENEL has the largest capacity in Europe and owns PHES plants in both Italy and Spain (through its majority stake in the Spanish Utility Endesa). Table 3 shows the ten largest owners of PHES on a GW basis.
Table 3:Ownership of PHES on a per GW basis and number of plants
Ownership company Location Number of
plants
Total Installed Capacity (GW)
SGCC China 17 15.2
ENEL Europe 24 8.3
Tokyo EPCO Japan 9 7.3
[image:11.612.99.577.616.710.2]10
J-Power Japan 7 5.0
Kansai EPCO Japan 4 4.9
CSPSG China 3 4.9
Iberdrola Europe 11 4.9
GDF Suez Europe & USA 8 4.7
Chugoku EPCO Japan 5 3.2
11
3. PHES revenue mechanisms in different markets
3.1. Main revenue classes for Energy Storage
There appear to be three broad classes of revenue model under which EES can operate in an electricity market. A specific bulk EES scheme may include aspects from all of these classes; however for explanatory purposes it is useful to broadly classify the models in this manner. A fuller description of business models for energy storage and risk mitigation aspects is given in Masiello et al. (2014) [38].
3.1.1. The ‘cost-of-service’ business model
2In this business model the cost of a project is remunerated in a regulated manner, typically to cover the cost of the projectÕs operating costs plus an agreed (with the regulator) rate of return on the projectÕs capital costs. This is a business model that would be common for a monopoly provider operating in either an unbundled liberalised market or a non-liberalised market with little or no unbundling. Although this model is frequently used for Transmission or Distribution infrastructure in unbundled liberalised markets, regulators have been reluctant to adopt it for EES due to the concern that EES could also derive revenue in the competitive part of the market too, which they rightly conclude could provide an unfair advantage. However, it also seems perverse that if bulk EES, or for that matter more distributed energy storage, is used as a transmission/distribution asset it should not be managed and remunerated in a regulated manner. Therefore the challenge is finding a policy mechanism that provides investment in energy storage but manages to curb the potential for market abuse.
3.1.2. Direct participation in a competitive market
In the competitive part of a liberalised electricity market an EES operator would have to compete with other market participants (unless special treatment is afforded by policy). Typically PHES schemes derive part of their revenue from the time-shifting of electrical energy, by charging at off-peak times when the price is low and discharging at peak times when the price is higher. Their participation then reduces the price spread between off-peak
2
12
and peak slightly (or the price for whichever service they were offering Ð for example fast reserve, frequency response etc.) and in doing so should increase the global surplus, that is the consumer surplus plus the producer surplus. Consumer surplus is the difference between what consumers would be willing to pay and the market price, and producer surplus is the difference between the market price and the price they would be willing to accept (for a rigorous description of these concepts in power markets see [39]). This market participation could include entering long term Power Purchasing Agreements (PPA's) with other market players and/or contracting services to other market players [24].
Ultimately this model relies on EES being able to provide competitive market-services at a similar or better level than the alternatives. However, market based incentives can be introduced by policy to encourage investment in certain technologies, as is the case with renewable incentives in the EU [40], [41] and the USA, to encourage the deployment of renewable generation at different scales. Arguably, market based incentives could also be developed for bulk EES too. It is worth noting that deployment with incentives reaches scale only after a period of successful R&D investment has proven fruitful in actually delivering technologies worth deploying [42]. The deployment at scale then accelerates modular technologies down their cost-curves and provides a virtuous spiral of decreasing costs through learning. With this type of reasoning, Germany has already introduced an energy storage subsidy for residential batteries up to 30 kW [43]. In the case of PHES however, the costs are biased towards civil engineering that is determined on a project-by-project basis, and so the scope to reduce costs along the supply chain may seem rather limited.
3.1.3. ‘Behind-the-meter’ energy storage
13
provided there were no regulatory barriers to market entry from this point (for example as a form of demand response). An example of a hybrid model of Ôbehind-the-meterÕ and Ôcompetitive market participationÕ would be the case of an EES plant which was part of a single large utilityÕs generation portfolio, used not only to offer market services but also as an internal balancing and trading mechanism.
3.2. Difficulties with rewarding EES in electricity markets
Despite large recent increases in research and development funding for bulk EES, new investment in bulk EES in the liberalised markets reviewed in this paper has been limited, including those where the proportion of renewable generation has markedly increased. The investment in recent years in PHES has mainly happened in the markets that are still under public ownership. A major reason for this is thought to be due to the regulatory and financial uncertainty surrounding the integration of PHES into liberalised electricity markets, which increases the risk, without providing the certainty of rewards over longer-time frames. This is a necessary pre-condition of attracting private sector investment into high capital cost long-lived assets such as PHES. There is also little international agreement on the optimal policies to incentivize investment in PHES, optimal PHES operational strategies or indeed even which entities should be able to own and operate bulk energy storage. This is not necessarily surprising given PHESÕs varied benefits to stakeholders across the electrical system [3], [12] and the range of different markets, international generation mixes and demand profiles that exist.
14
example, an energy storage device may introduce a cost saving for a Transmission or Distribution company, by avoiding the purchase of additional Transmission/Distribution (T/D) infrastructure or may relieve conventional start-shut cycles of thermal generators in the grid [45], reducing their operating costs to utilities. These licensing restrictions are predominantly due to concerns mentioned previously that bulk EES could be used as both a regulated asset and simultaneously participate in the competitive market. There may be contractual third party
avenues around this ownership issue, but as yet they are not widespread and there is concern that this kind of approach would potentially add an additional layer of legal costs and uncertainty to maneuver around regulation that is fundamentally not suited to bulk EES. These types of difficulties present barriers to the development of novel energy storage technologies as EES technology developers are often unsure of the performance and capital costs that they need to achieve to make their technologies attractive propositions to potential investors.
3.3. International markets and mechanisms
3.3.1. Great Britain
15
of ~£9 million in 2013 via arbitrage with perfect price forecasting. For further information please refer to these articles; source code for the models is also available to download [29]. Such a scheme in the UK may have a capital cost in excess of ~£400 million (SSE recently proposed a 600MW scheme in Coire Glas for £800 million [49]), implying a payback in excess of 40 years if used for arbitrage alone. Dinorwig PHES currently runs two of its turbines (each 300MW) for frequency response, gaining an availability fee ~£1900/hr for each turbine (for 109 hours per week, equating to ~£10.8 million per year) [50] . Hence even when ancillary services are considered, the payback times for PHES schemes in the UK seem too long to justify significant investments.
The only serious recent interest in PHES in the UK has come from Scottish and Southern Energy (SSE) under their generating arm, who proposed to build a new PHES plant at Coire Glas in Scotland [51]. However this project has not gone ahead due to the high cost of transmission connection charges [52]. It is also worth noting that SSE have a large and diverse power generating portfolio, as does Ibedrola the other utility that owns another pumped storage scheme. Therefore it is likely that the PHES plants can be used to optimize the utilitiesÕ own generation operations by internal trading, which may or may not align with providing wider system benefits.
3.3.2. Germany
16
PHES in Germany are bleak. This is due to low wholesale German electricity prices that have been driven down by the large amounts of subsidised wind and solar generation. The wind and solar energy produced can be sold cheaply due to the subsidy they receive, thus depressing the wholesale electricity prices whilst simultaneously increasing retail electricity prices. On top of this on sunny days in particular, solar-generated electricity can significantly reduce the number of daytime hours with high prices. This reduces the number of hours during which it is favorable for PHES to discharge. As a result some existing PHES plants cannot operate profitably by providing peak capacity and in the summer of 2014 some German PHES plants were mothballed [55]. This points to somewhat of a perverse policy outcome, as energy storage should be especially valuable in markets with higher penetrations of renewable generation.
It is noted that several factors influence this particular issue of wholesale price movement; GermanyÕs response to the Fukushima disaster was to speed up the phase-out of nuclear power removing a potentially cheaper source of baseload charging energy for PHES. This, coupled with favourable prices for coal and lignite has increased the market share of these generation types, and peak daytime electricity prices have been reduced by the erosion of the market share of natural gas generation by solar PV generation. It is notable the increase in coal use has led to an increase in GermanyÕs CO2 emissions [56].
For those PHES plants that can, taking advantage of more valuable ancillary services is an option. Vattenfall's Goldisthal Pumped Storage Power Station is EuropeÕs first PHES station which uses variable-speed (asynchronous) motor-generators [57]. These are used in two out of the four reversible pump-turbine units and allow the plant to provide regulation services while pumping, as well as increasing efficiency at part-load (which is particularly useful for ancillary service use). Accordingly this plant participates in the reserve markets, providing services like frequency regulation, as well as participating in the energy market.
3.3.3. Switzerland
17
liberalized and has not been fully unbundled; not being an EU member-state Switzerland also does not have to sign up to the EUÕs competition and liberalization laws. While consumers with a yearly usage above 100 MWh are able to choose their electricity supplier, smaller consumers must use the local regulated Distribution Systems Operators (DSOÕs) who can own distribution and electricity generation assets. The electricity prices can vary significantly from region to region. The three biggest utilities; Axpo, Alpiq and BKW account for more than 80% of generation in Switzerland and in 2010 they were 85% publicly owned (page 96 [59]). They are the largest shareholders of the Swissgrid, the Swiss transmission network operator and they also own the majority of PHES in Switzerland. Importantly, due to the high levels of interconnection with other countries, PHES in Switzerland can exploit price differentials between several markets. In particular nuclear electricity from France can provide cheap charging energy whilst electricity prices are generally higher in Italy [60]. In 2010 SwitzerlandÕs demand was approximately 60 TWh, while imports and exports were 66.6 TWh and 66.1 TWh respectively [59]. The average export price was 36.6% higher than the import price. Public opinion of Swiss (pumped) hydro also seems to enjoy its branding as one of ÔEurope's Green BatteriesÕ.
Switzerland is one of two European countries which are currently building a significant capacity of new pumped storage (the other being Portugal), although it has to be noted that the market conditions for these plants have recently become less favorable as European spot market prices have become depressed and less volatile (especially in Germany as mentioned above). Plans for two other PHES plants with a combined capacity of 1,630 MW Ð BKW's Grimsel 3 and Repower's Lago Bianco Ð have been suspended [61].
3.3.4. Japan
18
proportion of IPP's is the high transmission fees they face to use the local-monopoly-owned transmission infrastructure. These ten EPCOÕs are regional monopolies and privately owned vertically-integrated utilities [63]. Most of the PHES schemes in Japan are owned by these EPCOÕs and thus operate under a cost-of-service business model. Unlike in the unbundled markets of Europe and the USA therefore, there is no need to calculate how PHES plants will be individually profitable; the question instead is will they introduce an overall saving to the regional grid operator. Nearly 5 GW of PHES is also owned by the wholesale electricity utility J-Power [9], which also owns ~8.5 GW of coal generation, as well as operating transmission infrastructure [64]. All PHES plants in Japan are owned by utilities with a mix of power generation and T/D infrastructure.
Since the Fukushima disaster in March 2011, Japanese energy policy has shifted radically to promote the use of renewable energies (through the introduction of subsidies) and lessen the dependence on nuclear energy generation [65]. The Japanese government has also approved further liberalization of the electricity market and unbundling of transmission and distribution from supply and generation [62]. It remains to be seen what the impact of these changes will be on EES developments in Japan.
3.3.5. China
19
In the single capacity-based price mechanism the PHES owner rents the scheme to the grid company for use. The grid company can then dispatch the PHES plant in the manner that provides most benefit to the system. The T/D tariff mechanism is used by PHES schemes that are owned by T/D companies. The grid companies provide the capital investment and their costs are covered by the prices charged to the end users under a T/D tariff. China is soon set to become the country with the largest installed capacity (power) of PHES (see
Table 2); the governmentÕs target for 2020 is 50GW [34].
3.3.6. USA
20
partially unbundled USA markets due to a lack of transparency. Public opposition to PHES can also be a significant barrier, partly due to a lack of understanding of the benefits of energy storage [9].
In the liberalised markets, ancillary services can offer larger revenues to PHES operators than time-shifting energy (energy arbitrage). Ela et al. (2013) [69] investigates the value of ancillary services in five US market areas (California, Electric Reliability Council of Texas, New York, Midwest Independent System Operator, and New England) and states that market operators typically value regulation reserves the most, followed by spinning reserves (Table 8-2 in [68] shows ancillary service price information for these markets).
There have been some recent developments relevant to EES in USA electricity markets; for example FERC 755 requires that ISO's must compensate actual services provided for frequency response, noting that faster acting resources provide a greater degree of frequency regulation service. In response PJM, CAISO, MISO, NYISO, and NE-ISO have introduced "pay-for-performance" - a separate fast response tariff for regulation services available over relatively short timeframes [70]. Although this is technology neutral, it should favor PHES and other fast acting energy storage technologies. California recently became the first state to mandate a certain level of storage that is required to be in operation or under construction by 2020. The effect that this and other related policy developments in the USA will have on energy storage profitability is yet to be seen, although it is estimated that the California mandate has opened a market of $3-5 billion [70].
3.3.7. India
21
unscheduled interchange and the power exchanges. Over 90% of electricity is traded through long-term contracts [71]. Due to the deficit of peak electrical supply there is significant upward pressure on electricity prices. Transmission congestion, especially between the eastern-northern and eastern-western regions, also pushes up the market price. In its twelfth five year plan India plans to bring online more than 120 GW of extra generation capacity, with over half of this being coal generation [72].
PHES plants in India generally enter into long term PPA's with state-owned utilities, who agree to supply off-peak electricity in return for peak-time electricity. Due to the undersupply of peak demand in India, a stable off-peak electricity price is yet to become well-defined. In addition, several open-loop PHES schemes in India are limited by the availability of water, as it is often needed for irrigation. The 1 GW Tehri Pumped Storage Plant (PSP) is currently under-construction in the state of Uttarakhand. It is owned by Tehri Hydro Development Corporation India, a joint venture of the Indian Government and the State Government of Uttar Pradesh (UP) [37]. The pumping power will be provided by off-peak power from the beneficiary state utilities. The states are Delhi, Uttarakhand, Rajasthan and Haryana with whom power purchase agreements have already been agreed for the entire rated 1,000MW power. The states will, in turn, get proportionate peaking power from the PHES plant [73].
0
Table 4: summary of market mechanisms by country and example PHES plants
Country Market Type T&D owned? Market mechanisms used Example PHES project
Great Britain Liberalised market, ownership unbundling
No Competes for market services, utilities use for internal trading
Dinorwig. 1800MW, 9.1 GWh. Owned by First Hydro. Provides frequency response, Short Term Operating Reserve, peak capacity, blackstart
USA Both liberalised and partially-liberalised markets exist, with unbundling ranging from accounting to none
No in
liberalised markets
Competes for market services and used for internal trading in competitive markets, cost-of-service payment available in regulated markets although lack of transparency
Bath County Pumped Hydro. 3030 MW, 24 GWh. Owned by Dominion Power (60%) and FirstEnergy (40%). Provides peak capacity, electric time shift and reliability services.
Germany Liberalised market and legal unbundling No Competes for market services, utilities use for internal trading
Goldisthal Pumped Storage Power Station. 1060 MW, 8.5 GWh. Provides peak capacity, Voltage Support, Frequency Regulation and Black Start services. First European plant to include variable speed pumps. Owned by Vattenfall.
China Partially liberalised market, legal unbundling
Yes Tariffs approved for individual projects based on average costs or a cost-plus system (includes single capacity based mechanism, T&D tariff, two-part price mechanism, single energy-based price mechanism)
Tianhuangping Pumped Storage Power Station. 1836MW, ~13 GWh. Owned by East China Electric Power (subsidiary SGCC). Used to stabilise power grid, improve power supply quality in east China, and ensure safe grid operation
Japan Partially liberalised market, accounting unbundling
Yes Cost-of-service payments and market participation Okutataragi Pumped Storage Power Station. 1932 MW. Used as a T&D asset. Owned by Kansai Electric Power Company.
India Competitive market, legal unbundling Yes Competes in electricity market. Long term PPA's to provide peak power.
Tehri Pumped Storage Plant. 1000 MW. Provides peak capacity. Being developed by THDC India, a joint venture of the Indian Government and the State Government of Uttar Pradesh
Switzerland Partially liberalised, legal unbundling Yes Can exploit market prices in neighboring countries. Competes for market services. Can be owned by a distribution utility.
LinthÐLimmern Pumped Storage Scheme
480 MW, (being expanded to 1480MW). Provides electric capacity. Owned by Axpo.
0
4. Observations
The previous sections have looked at the historical deployment of PHES and the ways in
which it operates in different international electricity markets. In light of this review we make
several observations:
¥! The countries that are currently seeing the largest PHES development are China, India,
Switzerland and Japan. These countries all operate partially liberalised electricity
markets in which PHES can be owned and operated by vertically integrated companies
that also own and operate Transmission and Distribution infrastructure. The Swiss
market most closely resembles the competitive markets of the USA and the EU,
however it is also exceptional due to the high levels of interconnection with the
liberalised markets of Germany, France, Italy and Austria. Despite this, Switzerland is
feeling the effects of unfavourable European wholesale electricity prices (especially in
the German market) and plans for two new large pumped storage schemes in
Switzerland in the early stages of construction have been suspended [61].
¥! A significant proportion of the development of PHES in the review region is occurring
in India and China, two countries with rapidly expanding economies and where
peak-time electricity especially is in short supply. In these countries the PHES development
is occurring alongside significant expansions of other new generating capacity [72] and
in these regions there is no overcapacity of electricity generation, required either for
energy purposes or flexibility to load-follow. The PHES plants in these countries are
being developed by state-owned vertically-integrated utilities who own both generation
and transmission assets [34], [37] and are remunerated in a regulated manner. It is
significant that these organisations have valued PHES sufficiently highly to justify
investment. The converse is true in much of Western Europe and the USA where in
general, PHES operates in competitive market segments only, and sufficient generating
capacity to meet peak demands are in place. Japan and Switzerland provide exceptions
and are developing PHES despite having sufficient generation capacity to meet current
demand levels, however their electricity markets are not fully unbundled. It is also
worth noting that the lack of PHES development in Western Europe and the USA is
1
high emission coal plants in many European countries [8] (and nuclear power in
Germany).
¥! Although existing PHES plants in the USA continue to operate, there has been very
little PHES development in the USA since 1990. This is despite the presence of both
unbundled liberalised electricity markets and markets with little or no unbundling, and
potentially a large amount of further feasible sites available [9].
¥! In the unbundled liberalised electricity markets of the UK and Germany, large PHES
plants tend to simultaneously participate in different electricity market services (i.e.
frequency regulation services, electricity time-shift, electricity supply capacity,
blackstart etc.). They can do this by using discrete independently functioning
pump-turbine units that are connected to the same reservoirs, which can then bid for separate
market services. In this way they may be able to reduce the risks associated with
particular market mechanisms that have penalties for lack of service availability.
¥! It is possible for renewable subsidies to discourage the uptake of EES by artificially
reducing wholesale peak electricity prices to the extent that energy storage operation
becomes unprofitable. This can be further reinforced if the subsidies increase the
margin between retail and wholesale electricity prices, which generates consumer
hostility to any energy price increase and can in turn put downwards pressure on
wholesale electricity prices. Energy storage subsidies may be able to provide the
necessary economic motivations, although in a similar vein they may introduce
perverse policy outcomes - just as renewable subsidies have for storage.
5. Discussions
It is found that most PHES was originally commissioned under the remit of publically owned
vertically integrated utilities in monopoly markets - in the regions included in our study we
find that only 4.9 GW of PHES was deployed in unbundled liberalised markets, out of a total
of 117 GW. This is still the case today, wherein the majority of PHES development is by
state-owned vertically-integrated utilities in the expanding economies of China and India. It seems
likely that the value of PHES for these diverse organisations is sufficiently high to be worth
investment, whereas this is not the case for utilities operating in just one market segment in
2
major reason for this seems to be that vertically integrated utilities can accrue the benefits of
their investments in PHES wherever they occur throughout the network value chain, i.e. the
split-incentive problem is much reduced or negated. Accordingly, it is appropriate that less of
a risk premium would be attached to the funding of such schemes, and so, the cost of capital
should be cheaper too. In markets that have been unbundled and liberalised, it is unclear how
best to deal with this split incentive problem to encourage new investments in bulk EES
(assuming bulk EES would provide a wider societal benefit). Assuming a policy mechanism
could be agreed to allow this split incentive problem to be better managed, this would
undoubtedly benefit storage operators and thus provide a better investment landscape for bulk
EES.
The risk of a changing regulatory environment that has an impact on electricity market prices
is another factor that would drive up the weighted average cost of capital, as the revenue
streams available from time-shifting energy to potential storage operators can change
drastically from year to year [47]. It is therefore expected that private sector investment in
bulk EES projects would happen in markets where there is a reduced risk in terms of future
revenues as well as an appropriate rate of return. This could be the case when bulk EES
investment is rewarded in a cost-of-service manner e.g. as a regulated transmission or
distribution asset rather than as either electricity-generating or electricity-consuming entities.
However having bulk EES owned and operated by transmission and distribution companies
does not necessarily lead to third party access (unless policy specifically directs this). It would
be rational that any bulk EES would be operated in a manner that disproportionately benefits
the owners and their non-competitive network businesses, at the expense of other stakeholders
in the liberalised areas of the electrical supply system. For example, this could occur if a T&D
owned EES facility which was paid for by captive customers were also to be used in the
competitive market [74] . Accordingly there is a risk that bulk EES will not create the widest
social benefit and potential legislation needs to minimise this risk.
In the UK, the stated top-level aims of electrical energy policy are to create an affordable
decarbonised electrical network with an appropriate degree of security of supply. If the
3
decarbonised system at a lower cost, and given that the UK treasury should be able to borrow
money at a lower rate than private sector investors, it should ceteris paribus be able to
commission a bulk EES scheme at a lower cost than a private sector equivalent. Indeed an
article by Sundararagavan and Baker found that the interest rate was the factor that had the
greatest impact on the annualised total storage cost for PHES [75]. Government ownership
could also guarantee third party access in a manner suggested by the paper by Glachant and
Xe [76] in terms of auctioning off the capacity of the PHES in various blocks.
6. Conclusions
This paper has provided an historical context of the development of the majority of globally
installed Pumped Hydroelectric Energy Storage. It has given an overview of the mechanisms
by which these EES plants interact with their respective electricity markets in the countries
with the largest predicted growth of grid-scale energy storage - The Electricity Advisory
Committee report for the US DOE states that the US, China, Japan, Germany, and the UK are
expected to cover over two-thirds of the grid-scale EES market by 2017 [77].
It is clear that the majority of PHES development so far has occurred under public ownership
and has been aligned with periods of significant electricity infrastructure growth. Considering
that PHES is regarded as the technology of choice for historical bulk EES, it seems unlikely
that other bulk EES technologies will fare significantly better in competitive wholesale
electricity markets without very significant policy changes. This work suggests that, pending
very significant changes in energy policy, bulk EES will struggle to promote private sector
investment in unbundled deregulated markets. This is especially true when there are still
significant levels of fuel-based generation providing system flexibility and a focus on
promoting interconnectors to increase the size of markets. If however an increasing body of
research concludes that bulk EES has a net societal benefit, a meaningful debate around public
sector investment in bulk EES is merited.
As seen in Germany, renewable subsidies (without the incentive to produce a load-following
4
producing a cheap source of charging electricity they appear instead to have reduced the price
spread of day-ahead wholesale prices making EES operation less and less profitable. This is
despite the presence of several periods with negative electricity prices which increase the
rewards for EES operators [78].
We do not suggest that bulk EES is the only or indeed the best form of electrical system
flexibility, but conclude from this review that if policy makers decide that storage is to be one
of their preferred options to provide electrical system flexibility, then the option for the public
sector to commission the deployment of new bulk EES should be considered. This is in
recognition that the vast majority of existing bulk EES were commissioned under the public
sector. In liberalised markets however, we would also suggest that regardless of public sector
commissioning and ownership, access to the storage scheme should be fully transparent, open
to third parties and that this should be through some form of auctioning process. The ability of
the public sector to invest in a long-lived electrical asset that is not exclusively a network asset,
not a generator, and not a demand, but a combination of all three, and to make this available to
the wider market through auctions is something that merits serious discussion, in order to
provide bulk EES schemes at the lowest cost and least regulatory burden.
7. Acknowledgements
This work was supported by the Engineering and Physical Sciences Research Council under
the grants EP/K002252/1 (Energy Storage for Low Carbon Grids) and EP/L014211/1 (Next
Generation Grid Scale Thermal Energy Storage Technologies).
8. References
[1] I. A. G. Wilson, P. G. McGregor, and P. J. Hall, ÒEnergy storage in the UK electrical
network: Estimation of the scale and review of technology options,Ó Energy Policy, vol.
38, no. 8, pp. 4099Ð4106, 2010.
5
Renewable Electricity Generation,Ó 2010.
[3] J. Eyer and G. Corey, ÒEnergy storage for the electricity grid: Benefits and market
potential assessment guide,Ó 2010.
[4] M. Beaudin, H. Zareipour, A. Schellenberglabe, and W. Rosehart, ÒEnergy storage for
mitigating the variability of renewable electricity sources: An updated review,Ó Energy
Sustain. Dev., vol. 14, no. 4, pp. 302Ð314, 2010.
[5] F. Steinke, P. Wolfrum, and C. Hoffmann, ÒGrid vs. storage in a 100% renewable
Europe,Ó Renew. Energy, vol. 50, pp. 826Ð832, 2013.
[6] J. Cochran, L. Bird, J. Heeter, and D. J. Arent, ÒIntegrating Variable Renewable Energy
in Electric Power Markets! : Best Practices from International Experience,Ó 2012.
[7] R. Gross, P. Heptonstall, M. Leach, D. Anderson, T. Green, and J. Skea, ÒRenewables
and the grid: understanding intermittency,Ó Proc. Inst. Civ. Eng. - Energy, no. February
2007, pp. 31Ð41, 2007.
[8] R. Laleman and J. Albrecht, ÒNuclear and old fossil phase out scenarios: Assessment of
shortages, surpluses and the load factor of flexible assets with high renewable
generation targets - A Belgian case study,Ó Int. J. Electr. Power Energy Syst., vol. 74,
pp. 338Ð347, 2016.
[9] C. Yang and R. B. Jackson, ÒOpportunities and barriers to pumped-hydro energy
storage in the United States,Ó Renew. Sustain. Energy Rev., vol. 15, no. 1, pp. 839Ð844,
Jan. 2011.
[10] Y. Li, H. Cao, S. Wang, Y. Jin, D. Li, X. Wang, and Y. Ding, ÒLoad shifting of nuclear
power plants using cryogenic energy storage technology,Ó Appl. Energy, vol. 113, pp.
1710Ð1716, 2014.
[11] V. Scott, S. Gilfillan, N. Markusson, H. Chalmers, and R. S. Haszeldine, ÒLast chance
for carbon capture and storage,Ó Nat. Clim. Chang., vol. 3, no. 2, pp. 105Ð111, 2013.
[12] X. Luo, J. Wang, M. Dooner, and J. Clarke, ÒOverview of current development in
electrical energy storage technologies and the application potential in power system
operation,Ó Appl. Energy, vol. 137, pp. 511Ð536, 2015.
6
electrical energy storage system: A critical review,Ó Prog. Nat. Sci., vol. 19, no. 3, pp.
291Ð312, 2009.
[14] T. Stanton, ÒEnvisioning State Regulatory Roles in the Provision of Energy Storage.,Ó
2014. [Online]. Available:
http://energystorage.org/system/files/resources/nrri_14-08_energy_storage.pdf. [Accessed: 05-Jan-2016].
[15] N. S. Wade, P. C. Taylor, P. D. Lang, and P. R. Jones, ÒEvaluating the benefits of an
electrical energy storage system in a future smart grid,Ó Energy Policy, vol. 38, no. 11,
pp. 7180Ð7188, 2010.
[16] G. Grazzini and A. Milazzo, ÒA Thermodynamic Analysis of Multistage Adiabatic
CAES,Ó Proc. Ieee, vol. 100, no. 2, pp. 461Ð472, 2012.
[17] B. Dunn, H. Kamath, and J. Tarascon, ÒElectrical energy storage for the grid: a battery
of choices,Ó Science (80-. )., vol. 928, no. 2011, 2011.
[18] A. Z. Weber, M. M. Mench, J. P. Meyers, P. N. Ross, J. T. Gostick, and Q. H. Liu,
ÒRedox flow batteries: a review,Ó J. Appl. Electrochem., vol. 41, no. 10, pp. 1137Ð1164,
2011.
[19] Centre for Low Carbon Futures and Liquid Air Energy Network, ÒLiquid Air
Technologies Ð a guide to the potential,Ó 2013. [Online]. Available:
http://www.lowcarbonfutures.org/sites/default/files/potential-guide.pdf. [Accessed:
05-Jan-2016].
[20] T. Desrues, J. Ruer, P. Marty, and J. F. Fourmigue, ÒA thermal energy storage process
for large scale electric applications,Ó Appl. Therm. Eng., vol. 30, no. 5, pp. 425Ð432,
2010.
[21] J. Andrews and B. Shabani, ÒRe-envisioning the role of hydrogen in a sustainable
energy economy,Ó Int. J. Hydrogen Energy, vol. 37, no. 2, pp. 1184Ð1203, 2012.
[22] F. Crotogino, K. U. Mohmeyer, and R. Scharf, ÒHuntorf CAES: More than 20 years of
successful operation,Ó in Solution Mining Research Institute Meeting, Orlando, FL, 23Ð
25 April, 2001.
[23] M. Nakhamkin and M. Chiruvolu, ÒAvailable Compressed Air Energy Storage (CAES)
7
http://espcinc.com/library/PowerGen_2007_paper.pdf. [Accessed: 05-Jan-2016].
[24] O. H. Anuta, P. Taylor, D. Jones, T. McEntee, and N. Wade, ÒAn international review
of the implications of regulatory and electricity market structures on the emergence of
grid scale electricity storage,Ó Renew. Sustain. Energy Rev., vol. 38, pp. 489Ð508, Oct.
2014.
[25] J. P. Deane, B. P. î Gallach—ir, and E. J. McKeogh, ÒTechno-economic review of
existing and new pumped hydro energy storage plant,Ó Renew. Sustain. Energy Rev.,
vol. 14, no. 4, pp. 1293Ð1302, May 2010.
[26] C. J. Yang, ÒPumped hydroelectric storage: Technical report,Ó 2010. [Online].
Available: http://people.duke.edu/~cy42/PHS.pdf. [Accessed: 01-May-2016].
[27] CIA, ÒCountry Comparison: Electricity - installed generating capacity, The World
Factbook,Ó 2013. [Online]. Available:
https://www.cia.gov/library/publications/the-world-factbook/rankorder/2236rank.html. [Accessed: 01-May-2016].
[28] Sandia National Laboratories, ÒDOE Global Energy Storage Database.Ó [Online].
Available: http://www.energystorageexchange.org/. [Accessed: 01-May-2016].
[29] ÒEnergy Storage Sense,Ó 2015. [Online]. Available:
www.energystoragesense.com/downloads. [Accessed: 16-Jun-2015].
[30] ÒIberdrola completes work on EuropeÕs largest pumped-storage project,Ó
Hydroworld.com, 2013. [Online]. Available:
http://www.hydroworld.com/articles/2013/10/iberdrola-completes-work-on-europe-s-largest-pumped-storage-project.html. [Accessed: 05-Jan-2016].
[31] The Federation of Electric Power Companies, ÒElectricity Review Japan,Ó 2014.
[Online]. Available: http://www.fepc.or.jp/library/pamphlet/pdf/2014ERJ_full.pdf.
[Accessed: 16-Jun-2015].
[32] ÒOkinawa Seawater Pumped Storage Power Plant.Ó [Online]. Available:
http://www.ieahydro.org/reports/Annex_VIII_CaseStudy0101_Okinawa_SeawaterPS_J
apan.pdf. [Accessed: 01-May-2016].
[33] A. Poullikkas, ÒA comparative overview of large-scale battery systems for electricity
8
[34] Z. Ming, Z. Kun, and L. Daoxin, ÒOverall review of pumped-hydro energy storage in
China: Status quo, operation mechanism and policy barriers,Ó Renew. Sustain. Energy
Rev., vol. 17, pp. 35Ð43, Jan. 2013.
[35] Global Wind Energy Council, ÒGlobal wind report annual market update,Ó 2013.
[Online]. Available:
http://www.gwec.net/wp-content/uploads/2014/04/GWEC-Global-Wind-Report_9-April-2014.pdf. [Accessed: 01-May-2016].
[36] International Hydropower Association, ÒChina HydroPower Statistics,Ó 2014. [Online].
Available: http://www.hydropower.org/country-profiles/china. [Accessed: 16-Jun-2015].
[37] N. Sivakumar, D. Das, N. P. Padhy, a. R. Senthil Kumar, and N. Bisoyi, ÒStatus of
pumped hydro-storage schemes and its future in India,Ó Renew. Sustain. Energy Rev.,
vol. 19, pp. 208Ð213, Mar. 2013.
[38] B. R. D. Masiello, B. Roberts, and T. Sloan, ÒBusiness Models for Deploying and
Operating Energy Storage and Risk Mitigation Aspects,Ó Proc. IEEE, vol. 102, no. 7,
2014.
[39] D. S. Kirschen and G. Strbac, Ò Fundamentals of Power System Economics,
2004! :Wiley.Ó Wiley, 2004.
[40] P. del R’o and P. Mir-Artigues, ÒCombinations of support instruments for renewable
electricity in Europe: A review,Ó Renew. Sustain. Energy Rev., vol. 40, pp. 287Ð295,
2014.
[41] R. Haas, G. Resch, C. Panzer, S. Busch, M. Ragwitz, and A. Held, ÒEfficiency and
effectiveness of promotion systems for electricity generation from renewable energy
sources - Lessons from EU countries,Ó Energy, vol. 36, no. 4, pp. 2186Ð2193, 2011.
[42] J. Albrecht, R. Laleman, and E. Vulsteke, ÒBalancing demand-pull and supply-push
measures to support renewable electricity in Europe,Ó Renew. Sustain. Energy Rev., vol.
49, pp. 267Ð277, 2015.
[43] T. Bayar, ÒSolar Storage Market Set for Rapid Growth,Ó 2013. [Online]. Available:
http://www.renewableenergyworld.com/rea/news/article/2013/03/solar-storage-market-set-for-rapid-growth?cmpid=rss. [Accessed: 16-Jun-2015].
9
storage in the UK using a coevolutionary framework,Ó Energy Policy, vol. 63, pp. 230Ð
243, 2013.
[45] T. Das, V. Krishnan, and J. D. McCalley, ÒAssessing the benefits and economics of
bulk energy storage technologies in the power grid,Ó Appl. Energy, vol. 139, pp. 104Ð
118, 2015.
[46] International Power First Hydro, ÒIntroduction to First Hydro,Ó 2010. [Online].
Available:
http://www.iprplc-gdfsuez.com/~/media/Files/I/IPR-Plc/Attachments/presentations-pdfs/2010/first-hydro-IPR-investor-visit. [Accessed:
01-May-2016].
[47] E. Barbour, I. A. G. Wilson, I. G. Bryden, P. G. McGregor, P. A. Mulheran, and P. J.
Hall, ÒTowards an objective method to compare energy storage technologies:
development and validation of a model to determine the upper boundary of revenue
available from electrical price arbitrage,Ó Energy Environ. Sci., vol. 5, no. 1, pp. 5425Ð
5436, 2012.
[48] D. Connolly, H. Lund, P. Finn, B. V. Mathiesen, and M. Leahy, ÒPractical operation
strategies for pumped hydroelectric energy storage (PHES) utilising electricity price
arbitrage,Ó Energy Policy, vol. 39, no. 7, pp. 4189Ð4196, Jul. 2011.
[49] BBC News, ÒScottish government approves £800m Lochaber hydro scheme.Ó [Online].
Available: http://www.bbc.com/news/uk-scotland-highlands-islands-25365786.
[Accessed: 16-Jun-2015].
[50] National Grid, ÒFirm Frequency Response Tender Report - November 2014,Ó 2014.
[Online]. Available:
http://www.nationalgrid.com/uk/Electricity/Balancing/services/frequencyresponse/ffr.
[Accessed: 16-Jun-2015].
[51] N. Lannen, ÒSSE Renewables: New Pumped Storage Proposals,Ó 2011. [Online].
Available:
http://www.theiet.org/communities/powergen/all-energy/pumped-storage.cfm?type=pdf. [Accessed: 16-Jun-2015].
[52] Scottish and Southern Energy (SSE), ÒCoire Glas Hydro Scheme,Ó 2015. [Online].
Available: http://sse.com/whatwedo/ourprojectsandassets/renewables/CoireGlas/.
10
[53] B. Burger, ÒElectricity production from solar and wind in Germany in 2014,Ó 2014.
[Online]. Available: www.ise.fraunhofer.de. [Accessed: 16-Jun-2015].
[54] B. Steffen, ÒProspects for pumped-hydro storage in Germany,Ó Energy Policy, vol. 45,
pp. 420Ð429, Jun. 2012.
[55] S. Brick, ÒThe Integrated Grid and Decarbonization: The Case for Systems Thinking,Ó
2014. [Online]. Available:
http://www.epri.com/About-Us/Documents/Summer_Seminar_2014/Session 3.4_Brick_FINAL.pdf. [Accessed:
16-Jun-2015].
[56] K. Bruninx, D. Madzharov, E. Delarue, and W. DÕhaeseleer, ÒImpact of the German
nuclear phase-out on EuropeÕs electricity generation-A comprehensive study,Ó Energy
Policy, vol. 60, pp. 251Ð261, 2013.
[57] Voith, ÒGoldisthal, Germany.Ó [Online]. Available:
http://www.voith.com/en/markets-
industries/industries/hydro-power/pumped-storage-plants/goldisthal_main-9879-9879.html. [Accessed: 16-Jun-2015].
[58] P. Ochoa and A. van Ackere, ÒPolicy changes and the dynamics of capacity expansion
in the Swiss electricity market,Ó Energy Policy, vol. 37, no. 5, pp. 1983Ð1998, 2009.
[59] International Energy Agency, ÒEnergy Policies of IEA Countries, Switzerland (2012)
Review.,Ó 2012. [Online]. Available:
http://www.iea.org/publications/freepublications/publication/energy-policies-of-iea-countries---switzerland-2012-review.html. [Accessed: 01-May-2016].
[60] E. Pellini, ÒMeasuring the impact of market coupling on the Italian electricity market,Ó
Energy Policy, vol. 48, pp. 322Ð333, 2012.
[61] Reuters, ÒCavernous Swiss power plant undermined by renewable energy.Ó [Online].
Available:
http://www.reuters.com/article/2014/08/31/utilities-swiss-pumpedstorage-idUSL5N0QV3FK20140831. [Accessed: 16-Jun-2015].
[62] T. Yamazaki, ÒElectricity Market Reform in Japan,Ó 2013. [Online]. Available:
http://www.eu-japan.eu/sites/eu-japan.eu/files/Session2_Yamazaki.pdf. [Accessed:
01-May-2016].
11
of deregulation?,Ó Energy Policy, vol. 34, no. 16, pp. 2491Ð2497, Nov. 2006.
[64] A. Haarscher, M. Bruner, J. Doblas, A. Fargere, S. F. Ashley, and W. J. Nuttall, ÒThe
Japanese Electricity System 15 months After March 11th 2011,Ó University of
Cambridge Energy Policy Research Group. [Online]. Available:
http://www.eprg.group.cam.ac.uk/wp-content/uploads/2014/10/1417-PDF.pdf.
[Accessed: 01-May-2016].
[65] M. Hayashi and L. Hughes, ÒThe policy responses to the Fukushima nuclear accident
and their effect on Japanese energy security,Ó Energy Policy, vol. 59, pp. 86Ð101, 2013.
[66] B. S. Yeoh and R. Rajaraman, ÒElectricity in China: The latest reforms,Ó Electr. J., vol.
17, no. 3, pp. 60Ð69, 2004.
[67] J. Ma, ÒOn-grid electricity tariffs in China: Development, reform and prospects,Ó
Energy Policy, vol. 39, no. 5, pp. 2633Ð2645, May 2011.
[68] V. Koritarov, V; Veselka, T; Gasper, J; Bethke, B; Botterud, A; Wang, J; Mahalik, M;
Zhou, Z; Milostan, C; Feltes, J; Kazachkov, Y; Guo, T; Liu, G; Trouille, B; Donalek, P;
King, K; Ela, E; Kirby, B; Krad, I; Gevorgian, ÒModeling and Analysis of Value of
Advanced Pumped Storage Hydropower in the U.S.,Ó Argonne National Laboratory,
2014.
[69] E. Ela, B. Kirby, A. Botterud, C. Milostan, I. Krad, and V. Koritarov, ÒRole of Pumped
Storage Hydro Resources in Electricity Markets and System Operation,Ó in
HydroVision International Denver, Colorado, July 23-26, 2013, 2013, no. May, pp. 1Ð
12.
[70] M. Kintner-Meyer, ÒRegulatory policy and markets for energy storage in North
America,Ó Proc. IEEE, vol. 102, no. 7, pp. 1065Ð1072, 2014.
[71] U. K. Shukla and A. Thampy, ÒAnalysis of competition and market power in the
wholesale electricity market in India,Ó Energy Policy, vol. 39, no. 5, pp. 2699Ð2710,
May 2011.
[72] US Energy Information Administration, ÒIndia,Ó 2014. [Online]. Available:
http://www.eia.gov/countries/analysisbriefs/India/india.pdf. [Accessed: 16-Jun-2015].
12
http://www.power-technology.com/projects/tehri-pumped-storage-plant/. [Accessed:
01-May-2016].
[74] D. Bhatnagar, A. Currier, J. Hernandez, O. Ma, and B. Kirby, ÒMARKET AND
POLICY BARRIERS TO ENERGY STORAGE DEPLOYMENT: A Study for the
Energy Storage Systems Program,Ó Sandia National Laboratories, 2013.
[75] S. Sundararagavan and E. Baker, ÒEvaluating energy storage technologies for wind
power integration,Ó Sol. Energy, vol. 86, no. 9, pp. 2707Ð2717, 2012.
[76] X. He, E. Delarue, W. DÕhaeseleer, and J. M. Glachant, ÒA novel business model for
aggregating the values of electricity storage,Ó Energy Policy, vol. 39, no. 3, pp. 1575Ð
1585, 2011.
[77] Electricity Advisory Committee, Ò2012 Storage Report! : Progress and Prospects
Recommendations for the U . S . Department of Energy,Ó 2012.
[78] E. Barbour, G. Wilson, P. Hall, and J. Radcliffe, ÒCan negative electricity prices
encourage inefficient electrical energy storage devices?,Ó Int. J. Environ. Stud., no.
![Table 1: Technical characteristics of PHES. Information obtained from [4], [12], [13]](https://thumb-us.123doks.com/thumbv2/123dok_us/7810274.171889/6.612.91.565.295.490/table-technical-characteristics-phes-information-obtained.webp)