White Rose Research Online URL for this paper: http://eprints.whiterose.ac.uk/101125/
Version: Accepted Version
Article:
Hult, GTM, Morgeson III, FV, Morgan, NA et al. (2 more authors) (2017) Do managers know what their customers think and why? Journal of the Academy of Marketing Science, 45 (1). pp. 37-54. ISSN 0092-0703
https://doi.org/10.1007/s11747-016-0487-4
(c) 2016, Academy of Marketing Science. This is an author produced version of a paper published in Journal of the Academy of Marketing Science. Uploaded in accordance with the publisher's self-archiving policy. The final publication is available at Springer via http://dx.doi.org/10.1007/s11747-016-0487-4
[email protected] https://eprints.whiterose.ac.uk/ Reuse
Unless indicated otherwise, fulltext items are protected by copyright with all rights reserved. The copyright exception in section 29 of the Copyright, Designs and Patents Act 1988 allows the making of a single copy solely for the purpose of non-commercial research or private study within the limits of fair dealing. The publisher or other rights-holder may allow further reproduction and re-use of this version - refer to the White Rose Research Online record for this item. Where records identify the publisher as the copyright holder, users can verify any specific terms of use on the publisher’s website.
Takedown
If you consider content in White Rose Research Online to be in breach of UK law, please notify us by
0
Do Managers Know What Their Customers Think and Why?
G. Tomas M. Hult
Professor and Byington Endowed Chair Eli Broad College of Business
Michigan State University Email: [email protected]
Forrest V. Morgeson III
Director of Research
American Customer Satisfaction Index, LLC Email: [email protected]
Neil A. Morgan
PetSmart, Inc. Distinguished Professor in Marketing Chair Indiana University
Kelley School of Business [email protected]
Sunil Mithas
Professor of Decision, Operations & Information Technologies University of Maryland
Robert H. Smith School of Business [email protected]
Claes Fornell
1
Do Managers Know What Their Customers Think and Why?
Abstract
The ability of a firm's managers to understand how its customers view the firm's offerings and the drivers of those customer perceptions is fundamental in determining the success of marketing efforts. We investigate the extent to which managers' perceptions of the levels and drivers of their customers' satisfaction and loyalty align with that of their actual customers (along with customers’ expectations, quality, value, and complaints). With 70,000 customer surveys from the American Customer Satisfaction Index (ACSI) and 1,068 firm (manager) responses from the ACSI-measured companies, we were able to match, on average, 250 customers and 11 senior managers for each of the n=97 firms studied that had matching data. Our analyses suggest that managers generally fail to understand their firms' customers in two important ways. First, managers systematically overestimate the levels of customer satisfaction and attitudinal loyalty, as well as the levels of key antecedent constructs such as expectations and perceived value. Second, managers' understanding of the drivers of their customers' satisfaction and loyalty are disconnected from those of their actual customers. Among the most significant “disconnects,” managers underestimate the importance of customer perceptions of quality in driving their satisfaction and of satisfaction in driving customers' loyalty and complaint behavior. Our results indicate that firms must do more to ensure that managers understand how their customers perceive the firm's products and services and why.
Keywords: Organizational Learning; Customer Satisfaction; Customer Orientation;
2
“Marketing is so basic that it cannot be considered a separate function. It is the whole business seen from the point of view of its final result,
that is, from the customers' point of view.” Peter Drucker (1954)
The recent literature in strategic marketing has centered on marketing’s influence in the
firm (e.g., Clark, Key, Hodis, and Rajaratnam 2014; Feng, Morgan, and Rego 2015; Germann,
Ebbes, and Grewal 2015; Homburg, Vomberg, Enke, and Grimm 2015). The core of this
discussion views strategic marketing as a field of study encompassing a focus on organizational,
inter-organizational and environmental phenomena and marketing strategy “as an organization’s
integrated pattern of decisions that specify its crucial choices concerning products, markets,
marketing activities and marketing resources in the creation, communication and/or delivery of
products that offer value to customers in exchanges with the organization and thereby enables the
organization to achieve specific objectives” (Varadarajan 2010, p. 119). While this suggests that
both managers’ views and customers’ perceptions are important for marketing strategy making,
do managers consistently know what their customers think and why?
This is an important question since customer satisfaction, for example, has been shown to
drive bottom-line performance of the firm (e.g., Fornell, Morgeson, and Hult 2016). But, in
reality, it is not clear that firms’ managers really know what their customers think of the firm’s
product/service offerings and why. Strategically, this alignment between managers and
customers is critically important to marketing strategy making and deployment, and to reaping
the benefits of customer satisfaction initiatives (and other marketing initiatives). Alternatively,
understanding potential misalignment between managers and customers is also an important
“strategic benefit” (Vargo and Lusch 2016, p. 7) that can be leveraged for enhanced customer
satisfaction implementation (cf. Sleep, Bharadwaj, and Lam 2015) and, ultimately, achieving
3
Interestingly, tracing back more than fifty years, marketing analysts have encouraged
managers to focus on deeply understanding their customers' product and service needs and
requirements. Essentially, answers to the “what” and the “why” questions are widely viewed as a
necessary pre-condition, or knowledge, for being able to configure a firm's resources and
capabilities to design, deliver, and communicate product and service offerings that satisfy
customers better than its competitors (e.g., Hult and Ketchen 2001; Narver and Slater 1990).
Additionally, a large and growing literature supports the significant firm performance benefits of
successfully delivering such superior customer satisfaction (e.g., Akzoy et al. 2008; Fornell,
Mithas, Morgeson, and Krishnan 2006; Fornell, Morgeson, and Hult 2016). In their efforts to
achieve these benefits, most large firms monitor the satisfaction of their customers with the
firm's product/service offerings (e.g., Morgan, Anderson, and Mittal 2005) and use consumer
survey (and other) data, combined with increasingly sophisticated analytical techniques to help
uncover the drivers of customers' satisfaction and loyalty. However, there is only limited insight
into whether or not these and other efforts that firms may employ result in managers successfully
“getting inside their customers heads” to understand how they view the firm's products and
services and the drivers of these perceptions. This is an important gap in marketing knowledge
for (at least) three reasons.
First, efforts to link firms’ expenditures on satisfaction monitoring and improvement
efforts with customer satisfaction outcomes largely treat intervening steps as a “black box” (e.g.,
Dotson and Allenby 2010; Morgan, Anderson, and Mittal 2005). We posit that a fundamental
stage in this “black box” process is the extent to which managers correctly understand the levels
and drivers of customers’ satisfaction with their firm’s product and service offerings. Unless
4
customer satisfaction and loyalty are likely to be misplaced. Thus, absent some calibration of the
extent to which managers within a firm accurately understand customers’ product and service
needs and perceptions, it is impossible to say whether a firm needs to invest in getting managers
to better understand their customers or in using their current understanding more effectively to
design, deliver, and communicate superior need-satisfying customer offerings. In this research
we describe and illustrate one way in which firms can make calibrations of the extent to which
their managers accurately understand the firm's customers.
Second, using the above-mentioned approach to examine a large sample of U.S. firms
operating in consumer markets we provide compelling evidence that, on average, managers do
not accurately understand how their customers view their firm's products and services. We find
that managers in most firms systematically overestimate the extent of their customers’
satisfaction and loyalty, and also the levels of related antecedents such as product and service
expectations and perceptions of value. Perhaps even more worrisome, our analyses indicate that
managers also fundamentally misunderstand key drivers of their customers’ satisfaction and
loyalty. Thus, while most large firms invest in customer satisfaction monitoring systems, analyze
customer feedback data, and communicate this within the firm, we show that such efforts appear
to be insufficient to “close the gap” between what the firm’s customers actually think of the
firm’s products and service offerings and why, and managerial understanding of these key
aspects of their customers’ product and service needs and perceptions.
Third, we provide evidence that the fundamental disconnects we uncover between what
customers actually think about a firm's products and services, and what the firm's managers
“think customers think” really matters. Specifically, we show that firms in which the
5
satisfaction than firms in which this gap is relatively narrower. Given the large and growing body
of evidence linking customer satisfaction with firms’ accounting and stock market performance
(e.g., Fornell et al. 2006; Morgan and Rego 2006; Luo and Homburg 2008), our research
suggests that closing the gap between what customers actually “think” and managers “think
customers think” is a key strategic issue for most firms.
The results of our study reveal several important gaps between managers’ beliefs about
their customers and the actual perceptions and intentions of those customers. Among the most
significant disconnects that we observe is that managers overestimate their customers’
satisfaction, their ratings of some of its key drivers (expectations and perceptions of value), and
the future loyalty intention expressed by their customers, while also underestimating their
customers’ propensity to complain. Taken together, this pattern of overestimation of their own
firms’ customer performance could lead managers to fail to take needed steps to improve drivers
of satisfaction, satisfaction and loyalty, potentially damaging future financial performance and
market share. What is more, our results show that managers also misunderstand the attributes
that most strongly influence their customers’ perceptions, underestimating (for instance) the
importance of quality in driving satisfaction, and of satisfaction in driving both loyalty and
complaint behavior. Taken together, these perceptual gaps (along with others considered below)
provide strong evidence against both the depth and the breadth of managerial knowledge of their
own firms’ customers.
The rest of the paper is organized as follows. First, we develop the conceptual framework
for our study. We then describe the research method adopted and data collection procedures
employed. Next, we present the results of our analyses and discuss the nature and implications of
6
manage and leverage customer satisfaction and loyalty, and provide some strategies for how
firms might begin to close these gaps. Finally, we describe the limitations of our study and
identify interesting new avenues for future research illuminated by our findings.
Theoretical Background
We propose that there are two primary elements in any assessment of how accurately a
firm’s managers understand its customers’ product and service needs and requirements. First,
managers should know “what” their customers think of their firm’s current product and service
offerings. This is a fundamental purpose of any company’s customer satisfaction monitoring and
feedback systems (e.g., Morgan, Anderson, and Mittal 2005). The control system literature
suggests that if customers’ perceptions of the firm’s products and services are the performance
standard, then any difference between managers’ beliefs regarding customer perceptions of these
products and services and customers’ true perceptions will result in an inefficient and ineffective
control system (e.g., Anthony 2007; Schmenner and Vollmann 1994). If managers underestimate
their customers’ satisfaction with the firm’s products and services, they may invest in
unnecessary satisfaction improvement efforts (a “false alarm”). Conversely, if managers
overestimate customer perceptions of their firms’ product and service offerings they may fail to
make needed changes or may even take actions that are counter-productive (a “gap”). For
example, if managers think that their customers have a higher level of price tolerance than is in
fact the case, they may raise prices beyond levels that customers are prepared to pay and lose
market share as a result. A good of example of this mistake is the now-infamous 2011 price
increase enacted by Internet video retailer Netflix that rattled its customers and sent its share
7
Second, managers should know “why” their customers hold the perceptions of the firm’s
product and service offerings that they do. Even if managers correctly understand what their
customers think of the firm's products and services, it is managers’ beliefs about the drivers of
these customer perceptions that guide their efforts to improve the firm’s value offerings (or the
costs of delivering them). Thus, even if managers know with some precision the level of their
customers’ current satisfaction with their products and services, without correctly understanding
what drives this satisfaction managers will be unable to effectively and efficiently take actions
that may improve satisfaction in the future. Alternatively, if managers are looking for ways to
reduce the firm’s costs in ways that have a minimal negative impact on resulting customer
satisfaction and/or loyalty, they will be unable to do so if they have an inaccurate understanding
of what drives their customers’ satisfaction and loyalty.
We propose that a simple way to assess the extent to which a firm’s managers truly
understand what customers’ think of the firm’s products and services – and the drivers of those
customer perceptions – is to use a common set of measures that capture these phenomena and
compare responses from the firm’s customers (what they actually think) and its managers (what
managers think customers think). This comparison can be made in terms of both the “levels” of
perceptions on the same product and service-related phenomena (e.g., perceived quality,
perceived value, etc.) and in terms of the relationships between antecedent product and service
perception “drivers” (e.g., expectations, perceived quality, etc.) and their perceptual outcomes
(e.g., customer satisfaction, loyalty, etc.). Two obvious potential difficulties in adopting this
approach concern: (i) customer perceptions of products and services and the drivers of these
perceptions may be idiosyncratic to each individual customer (and may certainly differ widely
8
perception and driver questions for customers and managers to allow valid comparisons.
The first of these issues may be addressed by using aggregate survey measures of
customer satisfaction and loyalty and common and generic antecedents that are specifically
designed to be comparable across customers. For individual firms with a customer satisfaction
monitoring system, the surveys used to collect customer feedback data regarding perceptions of
the firm’s products and services are specifically designed to enable such aggregation across the
firm's customer base (e.g., Vavra 2002). For our study, however, we also need to be able to
compare customer (and manager) responses across companies and industries. The only
measurement framework to receive widespread examination and use in the academic marketing
literature that allows such comparison across a firm's customers, between companies in the same
industry, and across industries is the American Customer Satisfaction Index (ACSI), a theoretical
model described in detail by Fornell et al. (1996).
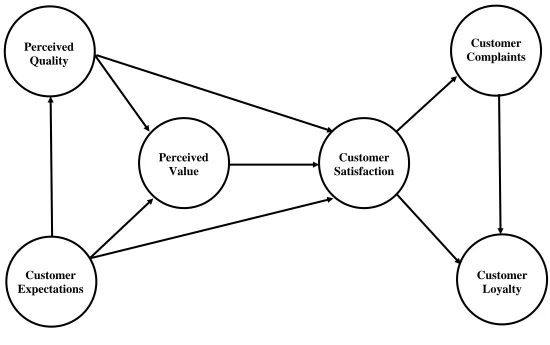
--INSERT FIGURE 1 ABOUT HERE—
Theoretically, the ACSI model links customer perceptions regarding expectations,
perceived quality, and perceived value as three central and generalizable drivers of customer
satisfaction, and complaints and attitudinal loyalty as the two primary outcomes of satisfaction
(for a detailed review of the model we describe briefly below, see: Fornell et al. 1996). These six
constructs are described based on the established ACSI model as:
Customer expectations is a measure of the customer's anticipation of the quality of a
9
Perceived quality is a measure of the customer's evaluation via recent consumption
experience of the quality of a company's products or services.
Perceived value is a measure of quality relative to price paid.
The customer satisfaction (ACSI) index score is calculated as a weighted average of three
survey questions that measure different facets of satisfaction with a product or service.
Customer complaints are measured as a percentage of respondents who indicate they
have complained to a company directly about a product or service within a specified time
frame.
Customer loyalty is a combination of the customer's professed likelihood to repurchase
from the same supplier in the future, and the likelihood to purchase a company’s products
or services at various price points (price tolerance).
Expanding on this general description of the model and the broad descriptions of the constructs,
customer satisfaction is the central mediator in the model and is measured as a latent variable
with questions asking the consumer’s overall cumulative satisfaction with their experience
(“overall satisfaction”), the confirmation or disconfirmation (either positive or negative) of prior
expectations produced by the experience (“confirmation of expectations”), and a comparison of
the experience to an imagined ideal product/service offering (“comparison to ideal”) (Fornell et
al. 1996).
In the structural model, satisfaction has three primary antecedents (or drivers) – perceived
quality, perceived value, and customer expectations. All three latent variable drivers are
anticipated to have direct, positive effects on satisfaction, as more positive consumer perceptions
10
the relationship between quality and satisfaction is expected to be the strongest, as consumer
satisfaction has typically been found to be predominantly a function of a consumer’s quality
experience (alternatively, perceptions of performance) with a product or service (Fornell et al.
1996; Oliver 2010). As defined in the ACSI survey, there are three survey items constitutive of
the quality experience included in the perceived quality latent variable: perceptions of overall
quality (“overall quality”), the degree to which the product or service fulfills subjective
individual requirements (“customization quality”), and how consistently and reliably the good or
service performs (“reliability quality”) (Fornell et al. 1996).
The second latent variable anticipated to have a direct and positive effect on customer
satisfaction is perceived value, which is measured in the survey as the level of perceived quality
relative to the price paid (“quality given price”), and the price paid relative to the perceived
quality of the good or service (“price given quality”). Adding perceived value to the model
incorporates price information, an important determinant of end-state consumer satisfaction in
virtually every industry, yet still allows for comparison of results across disparate companies,
industries, and sectors where pricing structures can vary substantially. This is because the
variables do not ask directly about happiness with price paid – where perceptions are more likely
to differ systematically across categories with widely different pricing structures – but rather
asks about price relative to quality (and vice versa) (Johnson and Fornell 1991; Fornell et al.
1996). Because the perceived value variable is measured as the ratio of price paid relative to the
quality received (and vice versa), perceived quality is also predicted to have a positive and direct
effect on perceived value, as shown in the model.
The third determinant of customer satisfaction in the ACSI model is the level of
11
experience. Because expectations serve as a primary reference point in a consumer’s cognitive
evaluation process (in other words a satisfaction “starting point”), expectations are predicted, like
both quality and value, to positively impact satisfaction. Expectations capture all of a customer’s
prior knowledge (through recommendation, prior experiences, advertising, other sources of news
and information, etc.) and consumption experiences with a firm’s products or services (Fornell et
al. 1996; Oliver 2010). Similar to quality, expectations in the ACSI model are measured as the
consumer’s anticipated perceptions of overall quality (“overall expectations”), customization
quality (“expectations customization”), and reliability quality (“expectations reliability”).
Furthermore, customer expectations are also hypothesized to be positively related to both
perceived quality and perceived value. These hypothesized relationships recognize the
consumer’s ability to learn from experience and to anticipate, based on this prior knowledge,
both the quality and value of a product or service they experience.
The two outcomes of customer satisfaction included in the ACSI model are customer
complaints and customer loyalty. Founded in exit-voice-loyalty theory (Hirschman 1970), when
dissatisfied customers have two basic options: leaving the company and defecting to an
alternative supplier (should one exist), or voicing their dissatisfaction to the supplier in an
attempt to receive some kind of recompense. Thus, an increase in satisfaction is hypothesized to
be negatively related to complaint rate, while likewise predicted to improve the loyalty of
customers (Fornell et al. 1996). Customer loyalty is the ultimate dependent variable in the model
– as well as being an essential and universal business objective – and it is modeled in this study
by a single manifest variable (repurchase intention, for reasons mentioned above) asking the
consumer how likely they are to remain a customer of the company. The importance of
12
as well as in forecasting market share, revenue growth, and profitability.
The final relationship in the model is the effect of customer complaint behavior on
customer loyalty. The direction and size of this relationship reveals, by and large, the efficiency
and quality of a company’s complaint recovery and complaint handling system (Fornell et al.
1996). When the relationship is positive, this shows that a company is successfully converting
complaining customers into loyal customers; when the relationship is negative, complaining
customers are more likely to defect, and an increase in complaints will cost the firm a larger
number of customers.
Overall, our study is rooted in the above robust and rigorously tested theoretical model at
the consumer level. However, a major gap in the literature is the capturing of these phenomena
and comparing assessments from a firm’s customers (what they actually think) and the
company’s managers (what managers think customers think). As such, importantly, a second
issue regarding how to use the same survey instrument for a firm's customers and managers to
allow meaningful comparisons may be addressed by re-framing the ACSI survey questions to
prompt managers to answer them as they believe their customers would. This is consistent with
the management and psychology literature approach to studying perspective-taking by managers
and employees (e.g., Gilin et al. 2013; Parker and Axtell 2001). Thus, rather than ask managers
for their own perceptions of the products or services offered by their firms, managers can be
asked what they believe their customers’ perceptions of the firm’s products and services to be.
For example, the overall expectations question in the ACSI survey asks consumers to consider
their expectations of the overall quality of one of the firms’ top brand products or services prior
13
as follows to compare this with managers’ beliefs regarding their customers' perceptions:1
"Thinking about your customers’ expectations of the quality they would receive, how would you rate your customers’ expectations of the overall quality of your top brands?"
Similarly, with consumers being asked about their overall satisfaction with their experiences
with a company’s top brand’s products and services in the ACSI survey, the firm’s managers can
be asked:
"Please consider all of your customers’ experiences with your top brands. How satisfied do you think your customers are with your top brands?"
Having developed a conceptual framework that allows us to calibrate the extent to which
managers understand the levels and drivers of customers' perceptions of their products and
services, we now turn to an empirical illustration of our framework.
Research Design and Data
To assess the extent to which managers understand their customers, we analyze two
distinct samples, one comprised of consumers of the products and services of firms across a
range of industries regarding their product and service consumption experiences, and the other
comprised of senior managers employed in customer-facing roles within these same companies.
Our sample of consumers was drawn from data collected by the American Customer Satisfaction
Index (ACSI). The ACSI interviews customers of more than 250 of the largest
consumer-oriented firms in the United States each year. Data is collected on a quarterly basis for different
industries, with approximately 25% of the total annual sample of respondents interviewed each
1Consumers surveyed by the ACSI are asked questions with regard to a specific product/service brand rather than
14
fiscal quarter, and each company measured once annually. Only the largest, most economically
significant companies within any measured industry are included in the ACSI, resulting in a
sample that primarily includes customers of Fortune 500 companies. For each measured
company within an industry, approximately 250 interviews of customers that have recently
purchased and consumed the products/services offered by the company are completed.
Approximately 60,000 interviews are conducted during each annual cycle of ACSI data
collection. For the purposes of this study, 2009 ACSI data, including only interviews completed
during the 2009 calendar-year cycle of annual interviewing, were utilized.2
The ACSI survey instrument used to collect this data is standardized and generalized for
applicability across the full range of companies and industries measured, allowing for the
estimation of a common statistical model and facilitating comparison of the analyzed data
between both similar and dissimilar consumer experiences (Fornell et al. 1996; Johnson and
Fornell 1991; Johnson, Herrmann and Gustafsson 2002). The questionnaire seeks the customer’s
perceptions regarding a general set of issues that apply across different product and service
categories, thereby allowing comparison across industries. While the customer sample includes
consumers who may user “smaller” brands from the company, the very nature of our sample –
randomly drawing from a company’s customers – means that this group will be a very small
group within the overall sample. Specifically, the ACSI is designed to collect data from
customers of the largest brands in each of the forty industries in which it collects data (seeking to
collect data from brands representing the majority of the sales in an industry). The customer data
was collected by ACSI and the manager data was collected in strategic partnership with the
2 As a robustness check we also examined the impact of using 2010 ACSI consumer data and the conclusions of the
15
ACSI to stay as consistent as practically possible in achieving aligned and matched responses at
the disaggregate level of the constructs (i.e., at the item level). The questions included in the
survey, along with abbreviated question wording and question/item scale, are provided in
Appendix 1.
--INSERT APPENDIX 1 ABOUT HERE--
The measured variables for each company are included in the standard ACSI structural
equation model for analysis (see Figure 1). Because ACSI estimates a type of latent
variable-partial least squares structural model (LV-PLS) for each company included in the study, multiple
survey items are measured for each latent construct included in the model (i.e., three questions
on expectations, three questions on quality, two questions on value, etc.). This multiple-item
approach accounts for the 13 survey items included in Table 1, corresponding to the six
estimated latent variables in Figure 1.3 All of the observed variables are asked on a 1-10 scale
during interviewing (with the exception of the "no"-"yes", 0-1 complaint question shown in
Appendix 1).
For the analysis conducted, the samples examined within the structural model differ
somewhat from what is normally used in the ACSI. Instead of estimating company-level models
using respondent-level data, we utilize company-level mean scores (i.e., the sum of the responses
for each observed variable for each company’s customers divided by the N respondents for that
3The standard ACSI structural model typically includes a 14th survey item, a question regarding price
tolerance/reservation price included in the Customer Loyalty latent variable. This question asks the respondent to indicate how much the company could raise the price of the product/service/brand experienced before he or she would definitely defect to a competitor. During questionnaire design and pre-testing with academics and managers, it was determined that this question would be too difficult to meaningfully adapt to the marketing manager
16
company) for the manifest data used in our analysis. This is because we are investigating the
alignment between the perceptions of a company’s customers in the aggregate and marketing
managers’“perceptions of these perceptions” (also in the aggregate and at the company level,
although obviously with far fewer observations/cases, as we discuss below).
The second sample we analyze in this study includes marketing and sales managers
employed by firms included in the ACSI database. This sampling frame was designed to include
professionals who are knowledgeable of their customers’ perceptions of the firm’s products and
services (Fornell et al. 2006) and influential in the company’s customer value-creating processes
(Srivastava, Shervani and Fahey 1999) and marketing activities (Vorhies and Morgan 2005). To
collect this sample of data, we first identified managers from each firm included in the ACSI
using the 2010 Dun and Bradstreet Information Services (D&B) directory as the universe of
potential managers. The identified executives had managerial positions with titles such as chief
marketing officer, vice president of marketing, marketing director, vice president of product
development, vice president of brand marketing, vice president of sales, and director of sales.
Through a qualifying email invitation sent to these professionals, a total of 1,439 executives were
identified as willing to respond to the survey.4
The surveys were made available and completed online via a customized online interface
in three waves. Each wave of surveys was sent out on a different weekday (with 4 to 7 days in
between each mailing) and at different times of day to maximize the likelihood of obtaining
responses, as well as responses that are not skewed by design measures. A total of 1,068
4As part of the qualification/eligibility validation process, the responding managers were asked to respond to the
17
managers completed the survey, and these individuals represented 122 different ACSI-measured
firms. All data collection for this managerial sample was completed in early 2010, providing the
best possible match to the 2009 annual wave of ACSI customer data. The managers that chose to
participate in the survey were asked the manager-framed ACSI consumer questions as outlined
in Appendix 1.
Finally, where multiple responses from managers within any single firm were collected
(e.g., five managers from Company X completed the survey), data were aggregated to the firm
level as a simple average of these responses, similar to the aggregation approach used with the
customer-level ACSI data described earlier. Following this procedure, and after further trimming
the sample to include only those manager-respondents with strong knowledge of their customers
(as described in footnote #4), 97 matched company-level customer-manager cases of data were
available for analysis. The ACSI customer data file, originally containing the 226 companies
measured in 2009 by the ACSI, was trimmed to match the original managerial sample, leaving a
sample of 97 complete cases available for analysis. A list of the companies in the final sample is
included in Appendix 2.
--INSERT APPENDIX 2 ABOUT HERE--
Analyses and Results
To analyze the two samples outlined above to determine the degree of alignment between
the customer perceptions and the managers’ perceptions of them, a multi-stage modeling
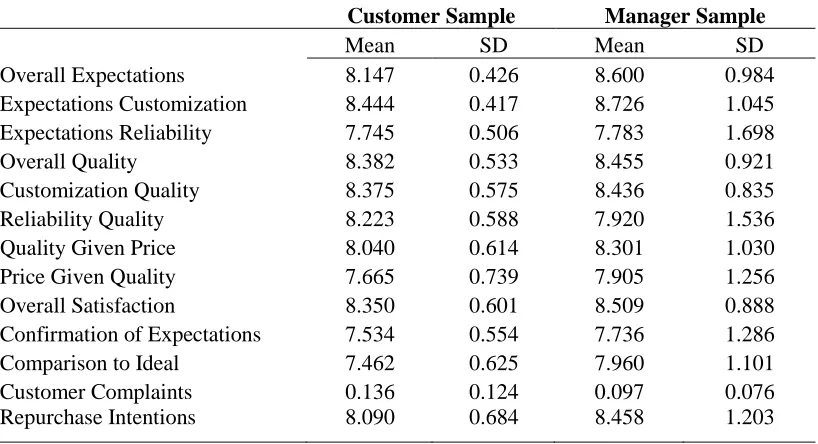
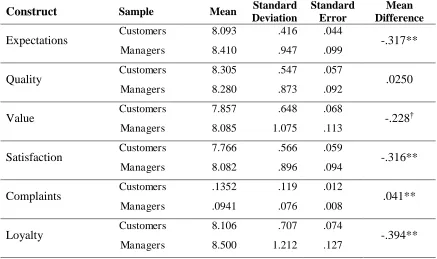
approach was utilized. First, as shown in Table 1, we computed descriptive statistics for the
18
with those for the sample of manager responses (hereafter the “Manager Sample”).
--INSERT TABLE 1 ABOUT HERE--
As seen in Table 1, the mean scores on the thirteen measured ACSI survey items for the
customer and manager samples exhibit both some similarities and some noteworthy differences.
While for some variables only small differences in mean scores exist (e.g., expectations of
reliability, overall perceived quality, and perceived customization quality, etc.) – suggesting that
customers and managers are relatively well-aligned in these areas – for others the differences are
more noteworthy (e.g., overall expectations, comparison to ideal, etc.), suggesting a larger gap
between the two sets of perceptions. Furthermore, even where the differences are only slight, for
all but two items (and one of these is the number of complaints voiced) manager perceptions are
more positive than customer perceptions, suggesting something of an ingrained over-optimism
among managers. Finally, the standard deviations are significantly larger for the managerial
sample, suggesting greater variation between companies’ managers and their perceptions than
corresponding consumer perceptions, although some of this variance is undoubtedly due to the
smaller underlying managerial sample (respondents per company).
Next, following the data aggregation procedures discussed earlier, with the customer and
managerial survey responses aggregated to company-level means and the cases matched across
the two samples, two structural equation models were estimated: a customer model, including the
company-level-aggregated mean scores derived from the ACSI surveys of consumers, and a
managerial sample model including the cases for managers asked the same questions. Following
19
this study we utilize partial least squares-based structural equation modeling (PLS-SEM)
methods to estimate both the latent variable scores and the paths between the constructs shown in
the ACSI model (see Figure 1 above). PLS-SEM is a very popular and widely-used method in
marketing research, and especially in consumer satisfaction studies (Kristensen and Eskildsen
2010). Previous studies estimating the ACSI model have predominantly used this technique as
well (e.g., Rigdon, Ringle, Sarstedt, and Gudergan 2011), and therefore employing the same
methods will provide replicable results (i.e., weights, scores, path estimates, etc.) comparable to
a majority of earlier studies examining the model (e.g., Fornell and Bookstein 1981; Henseler,
Ringle, and Sinkowics 2009; Hulland, Ryan, and Rayner 2010; Morgeson, Hult and Sharma
2015; Vilares, Almeida, and Coelho 2010).
Beyond replicating the methods used in earlier research on the ACSI model, for the
purposes of our study there are additional benefits of PLS-SEM that recommend this technique
over alternative approaches. PLS enables researchers to assess both latent variables at the
observation level (measurement model), a feature important to the between-model
mean-comparisons integral to our study, and the relationships between latent variables on a theoretical
level (structural model) (Hair, Sarstedt, Ringle, and Mena 2010; Hair, Hult, Ringle, and Sarstedt
2014, 2017). Moreover, while PLS-SEM is similar to traditional covariance-based, maximum
likelihood structural equation modeling (CB-SEM), in the sense that the measurement and
structural models are analyzed simultaneously, PLS relies on ordinary least squares estimation
(implemented iteratively via the PLS-SEM algorithm) to solve the models, thereby relaxing the
assumption of multivariate normality underlying CB-SEM. Given some of the features of the
data we examine here (and particularly vis-à-vis the manager data sample, where the sample is
20 analysis is optimal (Compeau and Higgins 1995).
PLS-SEM is also preferable to alternative (CB-SEM) methods when the researcher is
focused on optimized prediction of dependent variables, as we are in this study. While CB-SEM
focuses on maximizing overall model fit and inter-item covariance among a matrix of observed
variables, PLS-SEM is a “biased” method that maximizes the relationship between specified
latent variable predictor and response variables (Chin 1998). The scores thus capture the variance
most useful for predicting the endogenous latent variables (Hair et. al. 2014). Finally,
simulations have shown PLS-SEM to be robust against inadequacies often experienced in
modeling this type of data (i.e. consumer satisfaction data), such as multicollinearity, skewness,
and omission of regressors (i.e. omitted variable bias) (Cassel, Hackl, and Westlund 1999).
Because of all of the aforementioned advantages, PLS-SEM has routinely been suggested as the
preferred estimation method for customer satisfaction studies (Fornell 1992).
For this and most studies, PLS-SEM analysis is conducted in two stages. In the first
stage, the researcher ensures that the measures used as operationalizations of the underlying
constructs are both reliable and valid (the measurement model). After the adequacy of the
measurement model has been established, the researcher proceeds to the second stage and
interprets the resulting model coefficients (the structural model). The subsequent sections report
the results and key statistics for each of these two stages.
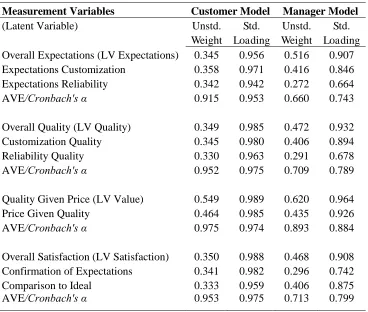
Results for the two measurement models (customer sample and manager sample),
including factor weights and loadings, and evidence of convergent and discriminant validity, are
presented in Table 2. The measurement model results for the two samples indicate some
divergence in the manifest-latent variable relationships between the two samples, but none that
21
measurement model, all of the manifest variables load strongly and significantly on their
respective latent variables, and generally the model appears stable and well-specified. Consistent
with prior testing of the ACSI model using customer data, each of the standardized loadings
score at the 0.940 level or higher, indicating very strong manifest-latent variable relationships.
The Cronbach’s statistics for each of the four multi-item latent constructs are above =0.950,
and the average variance extracted (AVE) statistics for each latent variable is above 0.910 (from
0.915 to 0.975), also suggesting strong convergent validity (Fornell and Larcker 1981; Voorhees,
Brady, Calantone, and Ramirez 2016).
--INSERT TABLE 2 ABOUT HERE--
In the manager sample measurement model, a somewhat less “tight”
data-to-latent-variables fit in this case is apparent. The manifest data-to-latent-variables, in general, load less strongly on their
respective latent variables, with most falling below the >0.900 levels observed in the customer
sample model. However, all of the estimated latent variables meet the standard thresholds for
acceptability, with Cronbach’s statistics greater than 0.7, and AVE's ranging from 0.660 to
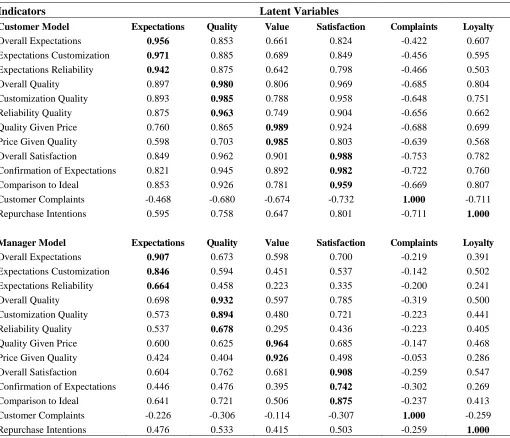
0.893 for each of the latent variables as well. Table 3 provides the item loadings and
cross-loadings for the two samples. These results show that all of the items load most strongly on their
own constructs for both samples.
22
Having examined the results from the measurement models for the two samples, we turn
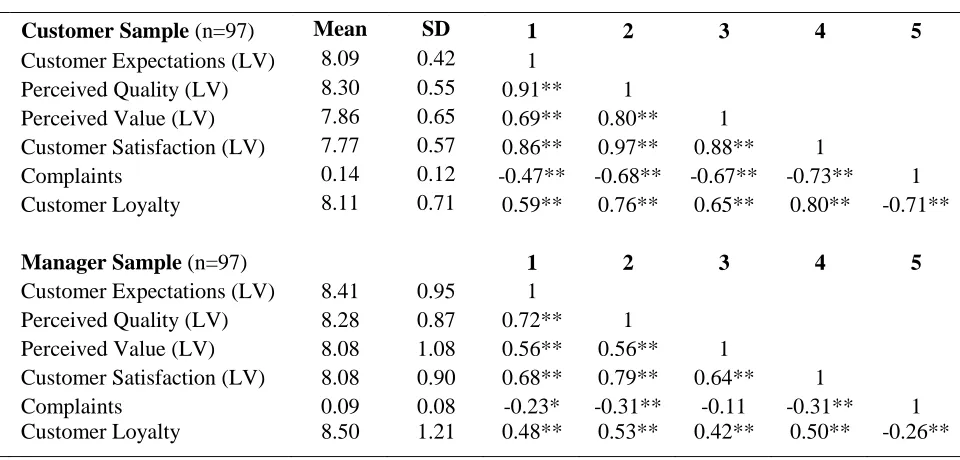
now to the results for the structural models. Table 4 provides descriptive statistics for the latent
variables for the two samples, as well as inter-construct correlations. These results confirm and
extend upon the conclusions drawn from the measurement model statistics. While generally the
latent variables exhibit significant correlations and in the expected directions, the relationships
are weaker for the manager sample than for the customer sample.
--INSERT TABLES 4 & 5 ABOUT HERE--
Table 5 summarizes the mean scores of the latent constructs in the model for both
managers and customers and shows t-test statistic significance levels for the mean differences in
each of the latent constructs between the two samples. Comparing the two samples, the mean
scores for the customer sample are lower for each latent variable, with managers only less
“positive” than customers (and then only very slightly so) about their customers’ perceptions of
the quality of their product and service consumption experiences. The mean differences are
significant for four of the six latent variables at the p<.05 level and for one further latent variable
at the p<.10 level. These results show that managers significantly over-estimate the levels of
their customers’ pre-purchase product and service expectations, customers’ perceptions of the
value of the products and services that the firms provide, the level of customer satisfaction with
the firms’ products and services, and their customers’ attitudinal loyalty (repurchase intentions).
The only variable that managers significantly under-estimate is the level of complaining behavior
about the firm’s products and services reported by customers.
23
estimates, and explained variance (R2) for each of the endogenous variables for the two structural
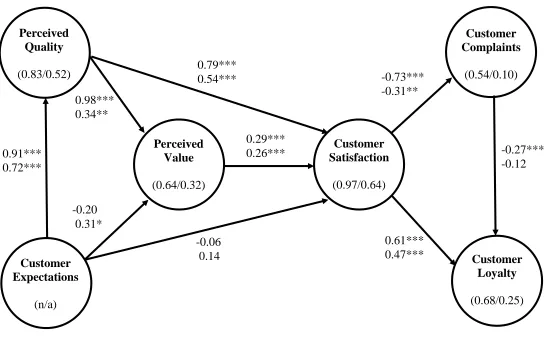
models. In the customer sample model, the Customer Expectations latent variable is strongly and
positively related to Perceived Quality ( = 0.91; p<.001), explaining 83% of the variance in
Perceived Quality, but insignificantly predictive of Perceived Value ( = -0.20; p>.05) and
Customer Satisfaction ( = -0.06; p>.05). Perceived Quality is a strong and positive predictor of
both Perceived Value ( = 0.98; p<.001) and Customer Satisfaction ( = 0.79; p<.001). Perceived
Value is a significant predictor of Customer Satisfaction ( = 0.29; p<.001), although its effect is
much smaller than the effect of Perceived Quality on Satisfaction. Finally, the specified
predictors explain a large proportion of the variance in both Perceived Value (R2 = 0.64) and
Customer Satisfaction (R2 = 0.97). Customer Satisfaction is a strong negative predictor of
Customer Complaints ( = -0.73; p<.001), explaining 54% of the variance in this variable.
Customer Satisfaction is also a strong positive predictor of Customer Loyalty ( = 0.61; p<.001),
and together Customer Satisfaction and Customer Complaints ( = -0.27; p<.001) explain 68%
of the variance in Customer Loyalty.
--INSERT FIGURE 2 ABOUT HERE--
Turning to the manager model, and the differences between the two models across the
samples become clearer. Here, the Customer Expectations latent variable is again strongly and
positively related to Perceived Quality ( = 0.72; p<.001), although the effect is substantially
smaller than in the customer sample model, and Customer Expectations explains only 52% of the
variance in Perceived Quality. Interestingly, and unlike the customer sample model, for the
24
Perceived Value ( = 0.31; p<.05), but is not a significant predictor of Customer Satisfaction ( =
0.14; p>.05). On the other hand, Perceived Quality is not nearly as strong a predictor of either
Perceived Value ( = 0.34; p<.01) or Customer Satisfaction ( = 0.54; p<.001) as in the customer
model. Perceived Value is a significant predictor of Customer Satisfaction ( = 0.26; p<.001),
with a strength similar to that of the customer model. The specified predictors explain a smaller
proportion of the variance in both Perceived Value (R2=0.32) and Customer Satisfaction
(R2=0.64) than is the case for the customer sample model. In addition, Customer Satisfaction is a
significant but weaker predictor of Customer Complaints ( = -0.31; p<.01), explaining only
10% of the variance in this variable. Likewise, while Customer Satisfaction is a significant
predictor of Customer Loyalty ( = 0.47; p>.001), and Customer Satisfaction and Customer
Complaints ( = -0.12; p>.05) both of which are much weaker relationships than observed in the
customer model and explain only 25% of the variance in Customer Loyalty.
To confirm the comparisons of the results for the two models offered above, we formally
test whether or not each of the pairs of parameter estimates in the two models is equal (nine tests
in all). While for covariance-based structural equation modeling several established techniques
exist for comparing estimates between sub-group models – most notably, the chi-square test of
difference, where each pair of model parameters is constrained to equality and the changes in
chi-square values are indicative of significant parameter estimate differences – no single
similarly accepted method exists for LV-PLS. However, options exist to draw this comparison.
Following the recommendations of Eberl (2010), Chin (1998) and Wetzels, Odekerken-Schroder,
and Van Oppen (2009), we use independent samples t-tests that assume unequal variances
(standard errors) between the samples, and a more conservative estimate of degrees of freedom,
25 Table 6.
--INSERT TABLE 6 ABOUT HERE--
The results in Table 6 provide a final confirmation of the extent of the differences
between the two samples and models. Of the nine parameter estimates included in each model,
six significant differences in the estimates are found, suggesting that overall the relationships are
considerably more dissimilar than similar for these two samples. Taken together, the observed
differences in these estimates and their statistical significance across the two models provide a
calibration of the extent to which managers understand the drivers of customers’ views of the
firm's product and service offerings.
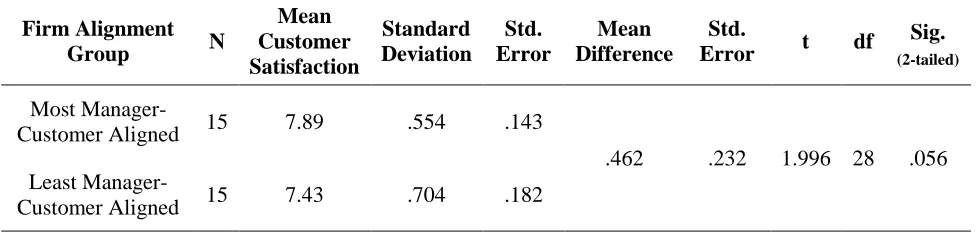
--INSERT TABLE 7 ABOUT HERE--
To provide an initial indication of the potential impact of such manager-customer
perception differences or misalignment, we examined the levels of satisfaction reported by the
customers of firms in which the manager-customer perceptual differences are relatively larger
and smaller (satisfaction was emphasized given that the original LV-PLS-tested ACSI model
maximizes explanatory power on Customer Satisfaction). To accomplish this we first computed
the firm-level mean differences between each firms’ managers and customers on each of the six
ACSI constructs contained in Table 5. We then aggregated these to a firm-level overall score
representing the cumulative perceptual differences between the firm’s managers and customers
across all six ACSI constructs. Finally, we identified and grouped the firms with the relatively
26
difference in mean Customer Satisfaction scores across the two groups. We tested the
significance of the differences in observed customer satisfaction across the two groups of firms
using t-tests.
As shown in Table 7, the results of this analysis reveal that the average Customer
Satisfaction reported for the group of firms with the relatively largest gaps between customer
perceptions of the firm’s products and services and managers views of those same customer
perceptions is significantly lower than that of the group of firms with the smallest
customer-manager perception gaps. The literature contains a large and growing body of evidence linking
firm-level ACSI customer satisfaction scores with firms’ accounting and stock market
performance (e.g., Anderson, Fornell, and Mazvancheryl 2004; Akzoy et al. 2008; Morgan and
Rego 2006; Tuli and Bharadwaj 2009). The results contained in Table 7 therefore suggest that
the size of the gap between what customers actually “think” and managers “think customers
think” of their firm's products and services has a significant negative effect on firms’
performance outcomes. For example, Gruca and Rego (2005) show that for the average firm
tracked in the ACSI, one point of customer satisfaction is worth $55 million in next year
cash-flows. This indicates that the almost half of one point ACSI customer satisfaction gap we
observe between the two groups in our Table 7 results is of clear economic as well as statistical
significance.
Discussion and Implications
Our goal in this study was to assess the extent to which the perceptions of senior
managers (employed in customer-facing roles) about their customers’ views of their firms’
27
comparison of data and models from a survey of managers in predominantly Fortune 500 firms
and their actual customers, we find important disconnects between what customers perceive and
what managers think their customers perceive in relation to the firm’s product and service
offerings. These differences cannot simply be explained by the managers in our sample having
little knowledge about the firm's customers since (a) these managers are in roles within the firm
where they should have a good understanding of customers, and (b) we excluded surveys from
managers who rated their own knowledge of the firm's customers as being less than eight on a
ten-point scale. Thus, the differences that we observe are between firms’ customers and
managers within the firm who are confident that they understand their customers’ perceptions
and their drivers, and who are in a position to use this knowledge to not only make marketing
decisions but also have the authority to allocate resources to address marketplace issues.
We find a number of important customer-manager “disconnects” in our analyses. First,
our results show that managers overestimate the positivity of customer perceptions of the firm’s
products and services. Importantly, this suggests that managerial beliefs regarding customer
perceptions will likely present a “too-rosy” picture if relied upon in isolation to guide the firm’s
marketing decisions and resource allocations with respect to the firm’s product and service
offerings. Our results show that managers’ beliefs regarding customer perceptions of the firm’s
products and services were more positive than customers self-reported perceptions for 11 out of
13 variables reported in Table 2.5 This indicates the prevalence of an ingrained optimism
regarding customer perceptions of firms’ product and service offerings among managers, and
these differences are also statistically significant for five of the six latent constructs examined.
5 One of the two variables for which this is not the case is the % of customers who have complained about their
28
Since the large consumer-focused firms in our sample typically have customer
satisfaction monitoring and feedback systems in place, this finding has a number of important
implications. Assuming that satisfaction and loyalty as captured in the ACSI survey questions
does not produce results that are systematically different from those produced by these firms’
own customer feedback questions (the similarity across most market research vendor satisfaction
surveys and firm-specific surveys indicates that this is a reasonable assumption), there could be a
number of reasons for the customer-manager disconnect in “levels” of perceptions of the firm’s
products and services that we find. Logically, either managers are not being exposed (at least not
completely) to their firms’ customer feedback data, or they are not interpreting (and/or
remembering) it accurately. In either case, while the managerial “fixes” required may be
different, the clear implication is that firms’ existing customer satisfaction monitoring efforts
generally do not currently constitute good control systems.
In particular, the significant “rosy view” bias we observe among managers regarding
their over-estimation of the positivity of customers’ views of the firm’s products and services is
likely to result in managers failing to act when they should. The combination of managers
over-estimating the value customers perceive in the firm’s product and services, their satisfaction with
the firm’s products and services, and their likelihood to re-purchase these same products and
services from the firm in the future is clearly problematic from this perspective; these overly
optimistic managers are likely to miss trouble signs when they appear. This is compounded by
managers significantly underestimating the proportion of their customers who have complained
about the firm’s products/services in the recent past. In practice, it likely means that all else
being equal, managers are less likely to see a need to improve the firm’s product and service
29 remain customers of the firm.
Second, our results also clearly show that managers generally do not accurately
understand the drivers of customers' perceptions of the firm's products and services. While the
relatively lower incidence of “driver analysis” as a component of firms' customer satisfaction
monitoring systems noted in prior research (e.g., Morgan, Anderson, and Mittal 2005) makes this
result less surprising than the “levels” results discussed earlier, the implications of this finding
may be even greater. Specifically, this suggests that even when managers do recognize a need to
take actions to improve customers’ perceptions of the firm’s product and service offerings, they
are unlikely to do so in ways that may have the strongest direct effects on the desired customer
perception outcomes. For example, our results indicate that managers are likely to under-invest
in raising customer quality perceptions as a route to enhancing customer satisfaction (cf. Habel
and Klarmann 2015). In this respect, our findings may also provide an explanation for
overemphasis on cost-cutting and efficiency observed in firms’ strategies relative to that on
quality improvements or achieving differentiation (Mithas and Rust 2015; Rust, Moorman, and
Dickson 2002). Where managers overestimate their own customers’ perception of the firm’s
performance, cutbacks that undermine the delivery of service, for example, may seem less
dangerous than they really are.
Perhaps even more damaging, our results suggest that managers are also likely to
under-invest in efforts to raise customer satisfaction since they believe it has a much weaker
relationship with customers’ complaining behavior than is in fact the case. The literature shows
that customer complaints have a significant negative effect on stock returns (e.g., Luo 2007; Luo
and Homburg 2008) and future sales growth and margins (e.g., Morgan and Rego 2006). Thus,
30
implications for firm performance. In addition, there are also likely to be important cost and
efficiency downsides that result from failing to accurately understand the drivers of customers’
perceptions of the firm's products and services. Managers with such inaccurate understanding of
the drivers of customer perceptions are likely to inefficiently allocate available resources among
available satisfaction and loyalty driver improvement options. To the extent that they are held
accountable for demonstrable perceptual outcomes (as they increasingly are through performance
incentives tied to satisfaction results), managers may also spend more on relatively weaker
drivers to achieve the required perceptual outcomes (and thus cost the firm money).
For managers, the results of our study should serve as a wake-up call that all is not well
with most firms’ customer satisfaction and complaints monitoring systems. For firms with such
monitoring systems already in place (such as those in our sample), the first priority should be to
establish the extent and nature of the manager-customer perception “level” and “driver”
disconnects within the firm. The approach adopted in our study may provide a useful starting
point in doing so. Managers may be best served by simply taking their own firm’s customer
feedback survey measures and translating these into managerial versions of the same questions
and items in much the same way as we illustrate in our study using the ACSI survey measures.
Managers can then compare the results of their internal managerial samples with those of their
existing customer data to establish the extent and nature of the manager-customer (mis-)
alignment in their own firm.
In the interim senior managers may be well advised to ensure that actual customer
feedback data and driver analysis is appended to all action recommendations and resource
requests related to efforts to enhance customer satisfaction and/or loyalty within the firm. This
31
customer satisfaction and/or loyalty required are created by the managerial “rosy view” bias that
we identify. However, it will at least ensure that managers are forced to examine and consider
the firm’s actual customer feedback data concerning what drives their customers’ product and
service-related perceptions and behaviors. This should allow resources to be more efficiently
deployed in any customer satisfaction and loyalty improvement efforts.
In firms without formal customer feedback systems, our results indicate that in any
efforts to introduce such systems, managers should give great consideration to how they can
communicate and establish the credibility of the customer feedback produced among managers
within the firm. Enhancing managers’ perceptions of the credibility of customer feedback data
should enhance the likelihood that they will pay attention to it (e.g., Morgan, Anderson, and
Mittal 2005) and reduce the likelihood that managers will substitute their own views of what
they “think customers think”. Significant attention should also be given to how the results of the
firm’s customer feedback system can be effectively communicated to managers within the firm.
The importance of these considerations suggested by our results may require new or revised
customer feedback system designs and will likely also have significant resource cost and
allocation implications in implementing such systems.
Limitations and Future Research
While our study provides new and important insights regarding the extent to which
managers understand their customers’ product and service perceptions and the drivers of these
perceptions, it has some limitations that are inherent in the research design and data availability.
Perhaps most obviously our study uses data only on large Fortune 500-type firms. Such larger
32
organizations may also be further removed from the firm’s customers than is often the case with
smaller firms. There is therefore a need to conduct similar studies for mid-size and small firms,
to establish the generalizability of our findings. In addition, while many of the firms in our
sample have global operations, in our study we only collect customer and manager data for the
firms in our sample operating in the United States. Data collection and analysis of this issue
across different countries is required to establish the degree to which our findings are
generalizable across countries.
Beyond the need for additional research to overcome these limitations, our study also has
numerous implications for future research. Here, we focus on three issues that we believe may
provide particularly fruitful avenues for theoretically important and managerially relevant
inquiry. First, why are managers overly positive in their views of what customers perceive of the
firm's product and service offerings? Cognitive limitations and biases arising from the use of
judgmental heuristics such as representativeness, availability, and adjustment and anchoring
(e.g., Chinader and Schweitzer 2003; Tetlock 2000; Kahneman and Tversky 1979) may help
explain differences between what customers think and what managers “think customers think”.
But what explains the systematic positivity bias we observe? Is it that the within-firm objective
data on product and service quality and costs observed by managers is systematically greater
than the perceptions of customers?
Second, many large firms systematically track the satisfaction of their customers using
actual consumer survey data and use sophisticated analysis techniques to uncover the drivers of
satisfaction among their customers. Yet, as our results show, this is clearly insufficient if the goal
is to allow managers to understand customers’ perceptions of the firm’s product and service
33
disconnect is apparent. First, it is possible that the data and analysis results of the firm’s
customer feedback systems are not being communicated effectively within the firm. This may be
a sender issue (e.g., using insufficient or ineffective media or messages) and/or a receiver issue
(e.g., insufficient time or cognitive resources). Moreover, managers may be skeptical of the
results of their firms’ customer feedback systems and instead trust their own perceptions as a
substitute for findings from this data and base their marketing decisions on such perceptions.
Which is it? Or is it a combination of the two?
Third, given the indications of the negative impact of the manager-customer perception
gaps we uncover for customer satisfaction outcomes, what works and doesn't work in closing the
gap between what managers “think customers think” and what customers actually think? Most
firms currently spend the overwhelming majority of their customer feedback monitoring budgets
on data collection and analysis (e.g., Morgan, Anderson, and Mittal 2005). Should they focus
greater attention on establishing the credibility of the customer feedback data collected and
analyses performed on this data among managers and employees within the firm? If so, what are
the predictors of customer feedback data and data analysis output credibility among managers?
These issues are becoming increasingly important to tackle in the new era of big data.
Alternatively, is the problem that results are simply under- or ineffectively communicated to
managers? If so, what communication approaches work best to ensure that customer feedback
data and insights are successfully received by managers and employees? For example, can data
34
Conclusion
Based on an analysis of consumer survey data from the American Customer Satisfaction
Index (ACSI) and a sample of surveys of managers employed within ACSI-measured companies,
this study provides evidence that managers generally fail to accurately understand both what
customers think of their firm's products and services and why customers hold the perceptions
that they do. These findings suggest that despite often being the single biggest line-item of most
firms' market research expenditures, existing customer feedback systems are not performing an
effective management control role. In addition, firms need to do much more to communicate and
35
References
Aksoy, L., Cooil, B., Groening, C., Keiningham, T.L., & Yalcin, A. (2008). The long term stock market valuation of customer satisfaction. Journal of Marketing, 72(July), 105-122.
Anderson, E.W., Fornell, C., & Mazvancheryl, S.K. (2004). Customer satisfaction and shareholder value. Journal of Marketing, 68(4), 172-185.
Anthony, R.N. (2007). Management control systems, 12th Edition, New York: McGraw-Hill.
Cassel, C., Hackl, P., & Westlund, A. (1999). Robustness of partial least squares method for estimating latent variable quality structures. Journal of Applied Statistics, 26(4), 435-446.
Chin, W.W. (1998). The partial least squares approach to structural equation modeling. In G.A. Marcoulides (Ed.), Modern methods for business research (pp. 295-336). Mahway, NJ: Lawrence Erlbaum Associates.
Chinader, K.R., & Schweitzer, M.E. (2003). The input bias: the misuse of input information in judgment of outcomes. Organizational Behavior and Human Decision Processes, 91(2), 243-254.
Clark, T., Key, T.M., Hodis, M., & Rajaratnam, D. (2014). The intellectual ecology of
mainstream marketing research: an inquiry into the place of marketing in the family of business disciplines. Journal of the Academy of Marketing Science, 42(3), 223-241.
Compeau, D.R., & Higgins, C.A. (1995). Application of social cognitive theory to training for computer skills. Information Systems Research, 6(2), 118-143.
Dotson, J., & Allenby, G. (2010). Investigating the strategic influence of customer and employee satisfaction on firm financial performance. Marketing Science, 29(5), 895-908.
Drucker, P.F. (1954). The practice of management, New York: Harper & Brothers.
Eberl, M. (2010). An application of PLS in multi-group analysis: the need for differentiated corporate-level marketing in the mobile communications industry,” In V.E. Vinzi, W.W. Chin, J. Henseler, & H. Wang (Eds.), Handbook of partial least squares: concepts, methods and applications in marketing and related fields. New York: Springer.
Feng, H., Morgan, N.A., & Rego, L.L. (2015). Marketing department power and firm performance. Journal of Marketing, 79(September), 1-20.
Fornell, C. (1992). A national customer satisfaction barometer: the Swedish experience. Journal of Marketing, 56(1), 6-21.