This is a repository copy of
Development of a proposed design method for discontinuous
columns in braced frames
.
White Rose Research Online URL for this paper:
http://eprints.whiterose.ac.uk/104878/
Version: Accepted Version
Article:
King, C.M. and Davison, J.B. orcid.org/0000-0002-6191-7301 (2016) Development of a
proposed design method for discontinuous columns in braced frames. Journal of
Constructional Steel Research, 128. pp. 233-244. ISSN 0143-974X
https://doi.org/10.1016/j.jcsr.2016.08.017
[email protected] https://eprints.whiterose.ac.uk/
Reuse
This article is distributed under the terms of the Creative Commons Attribution-NonCommercial-NoDerivs (CC BY-NC-ND) licence. This licence only allows you to download this work and share it with others as long as you credit the authors, but you can’t change the article in any way or use it commercially. More
information and the full terms of the licence here: https://creativecommons.org/licenses/
Takedown
If you consider content in White Rose Research Online to be in breach of UK law, please notify us by
Development of a
proposed
design method for
discontinuous
columns
in braced frames
C.M. Kinga,band J.B. Davisonc
a
Steel Construction Institute, SilwoodPark, Ascot, Berkshire, SL5 7QN, UK b
COWI North America, 101-788 Harbourside Drive, North Vancouver, BC, Canada V7P 3R7 c
Department of Civil and Structural Engineering, University of Sheffield, Sheffield S1 3JD, UK Corresponding author [email protected] T: +44(0)114 2225354 F: +44(0)114 2225700
Abstract
A column design method has been developed for use in braced frames with discontinuous columns
using flexible cap and base plates and floor beams that are either simply supported or continuous.
The proposed method is intended to be used with shallow floor construction with concrete or
steel/concrete composite slabs in which the floor slab occupies the depth of the floor beams and is
fully grouted to the beams so that the slab restrains the full depth of the beams. It was developed to
simplify the design of square hollow sections discontinuous columns in frames using asymmetric
beam (ASB) type floor construction. Floor beams are designed to carry the floor loads without
interaction with the columns; columns are then designed to resist the floor beam reactions assuming a
deformed shape derived from end-rotations equal to the slope of the floor beams at the top or bottom
of the column, whichever is the greater. The method incorporates the elasto-plastic behaviour of
columns subject to axial compression and large end-rotations and has been verified by physical tests
on full-scale square hollow sections columns and finite element analysis using non-linear geometry
and material properties and including residual stresses.
2
Introduction
In braced steel frame construction it is usual practice for a single length of column to extend over two or
more stories and for the beams to frame into the continuous column and be connected by connections
designed for vertical shear. Recently a new form of braced frame has been used in the UK for residential
construction in which the columns are discontinuous [1]. Columns are fabricated in single storey lengths
and fitted with horizontal plates (known as cap- or end-plates) at the top and bottom in order to bolt the
column directly to beams below and above which are continuous over the column. Square hollow
sections with the smallest possible size are used for the columns so that they can be hidden in the
thickness of the walls. Because the beams are continuous, passing uninterrupted over the column lines,
they benefit from the efficiency of continuity but without the extra fabrication cost associated with
forming a full strength and rigid connection between discontinuous beams and continuous columns. The
continuity of the beams across the the tops of the columns induces rotation at the top and bottom of the
column under some loading arrangements resulting in curvature of the column, which may reduce the
resistance of the column below that of an equivalent pin-ended strut, and therefore a design method for
this form of construction is required. A method has been published [2] but this uses nominal moments
and does not explicitly consider the magnitude of the slopes of the beams at the top and bottom of the
column. This paper describes the development and validation of a new design method for square hollow
section discontinuous columns which is safe, gives economical column sizes and is easy to apply by
designers.
2.1
Braced frames with discontinuous columns
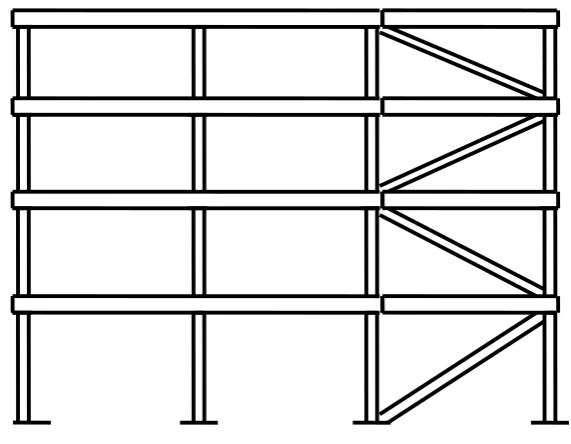
A typical frame using discontinuous columns is shown in Fig. 1 (much larger frames than that
illustrated have been constructed, up to 14 storeys high). Each column piece is only one storey high
and to provide a shallow construction depth, the floor, which may be composite construction using
deep profile decking or pre-cast concrete, is supported on the bottom flange of asymmetric beams.
Being built-in between the beams, the floor stabilises the beams(provided that precast units are fully
grouted). This type of construction has a number of benefits including shallow floor construction[3,4]
and reduced building height, beam continuity achieved with inexpensive connections [1], slender
columns that can either be hidden in walls (or are of low visual impact if not hidden) and safe, easy
crane hook access when lifting in pre-cast concrete floor units or metal decking because the columns
do not extend above the floor beams until the next storey is erected. Set against these benefits are the
disadvantages of: the greater number of individual column pieces to lift, so more crane time for
column erection is required; continuous beams give fewer pieces but greater piece weights, possibly
thicknesses of the same column sizes are used because all the columns appear to be identical but have
different wall thicknesses; the design of the columns is problematic and guidance is required.
None of the design methods currently available are ideal for the design of discontinuous columns in
braced frames. A new design method is required because(i)frame analysis with varying joint stiffness
is too complexfor routine designand(ii)methods based on nominal moments are uncertain and often
give veryconservative approximations. Research by Gent and Milner[5,6]and later by Davison et al.
[7] and Gibbons et al. [8] demonstrated that the partial restraint inherent in nominally pinned columns
is sufficient to increase the buckling resistance.(Readers interested in tracing the development of this
work on Ômoment sheddingÕ are referred to Nethercot [9]). This earlier work suggested that it ought to
be possible to devise a simple yet economic column design method for discontinuous columns.This
paper details a study leading to the development of a proposed design method for square hollow
[image:4.595.119.405.342.564.2]section discontinuous columns in braced frames.
Fig. 1 Columns and beams in a typical frame with discontinuous column
2.2
A new column design approach required
When considering the behaviour of discontinuous columns two factors are of particular interest (1) the
rotational stiffness of the column-beam joint (2) the effect of bending moments in the columns on the
compression resistance. The axial compression in the columns in the upper stories of a building will be
relatively small and if thin cap-plates are used, the connections will be flexible so the beam can rotate
relative to the columns. This would result in higher sagging moments in the beams than would be
clamps the columns and beams so that very little rotation of the beam relative to the column is
possible, so the frame resembles a continuous one. Elastic analysis as a continuous frame requires the
designer to either determine the stiffness of the joints accounting for the effect of axial compression or
to specify cap-plates so thick that the joint is practically rigid even for low axial compression. The
bending moments in the columns calculated by elastic analysis of a continuous frame can be of such a
magnitude that they cause a significant reduction in the resistance to axial compression. Larger column
sections are then required, increasing the bending stiffness further and attracting even more bending
moment. This may lead to heavy columns, negating one of the attractions of the construction method
i.e. to have small column cross-sections to allow them to be hidden in walls or limit the visual impact
of exposed columns.
Modification of traditional design approaches, such as simple construction [10] where the columns are
assumed to be pinned, or continuous construction [11] using elastic analysis of a rigid frame, are
unsatisfactory. The former is potentially unsafe due to the effects of imposed end-rotations on the
column which leads to reduced axial capacity; the latter requires heavy connections to realise the
design assumptions and attracts too much moment to the columns which are desired to be kept small.
A radically new approach is proposed in which the beams may be designed independently of the
columns but the columns are designed taking account of the end rotation imposed on them by the
slope of the beams.
The column design method exploits the moment-rotation relationship in beam-columns which(i) are
subject to end-moments in the elastic domain but are not required to resist these end-moments to
maintain static equilibrium of the structure and (ii)may be strained beyond the elastic limit.
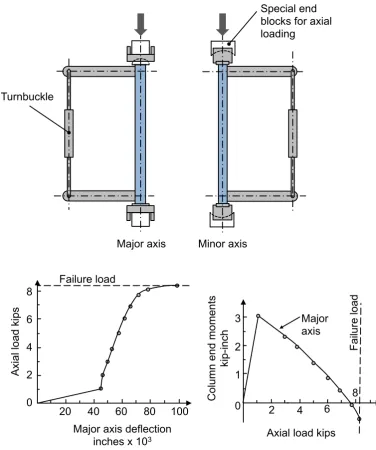
Gent [5] and Gent and Milner [6] investigated the behaviour of columns under these conditions. Their
test program applied moments to the end of the columns through a turnbuckle system (see Fig. 2(a)) in
which the load relaxed as the end-rotation increased, thus the end-moment reduced as the curvature of
the column increased. Initially the column was loaded by application of end rotations through the
turnbuckle system. Next axial load was applied gradually up to failure of the column by buckling
while the end-moments were measured. The end moments were seen to decrease as the axial
compression increased, as shown in Fig. 2(b). This occuredbecause the axial compression had to be
resisted by the column to maintain static equilibrium whereas the end moment did not need to be
resisted to maintain static equilibrium because increasing rotation of the column end allowed the
turnbuckle system to relax and reduce the applied end-moment. Gent referred to this behaviour as
Òmoment sheddingÓ.The phenomenon was also seen in large scale tests conducted by Davison et al.
Fig. 2 Moment shedding from increasing axial load 6
This behaviour is not what is commonly assumed in the design of beam columns. The common
assumption is that the end-moments calculated by elastic analysis must always be resisted together
with the axial load. In many cases this is appropriate, especially where the:
(a) beam size is chosen assuming a bending moment diagram that depends on moments in the
columns;
(b) columns will fail by local buckling and/or lateral-torsional buckling if they are strained far
beyond the elastic limit (likely in most I-section columns of common proportions, making the
use of elastic analysis appropriate);
(c) columns form part of a sway-frame in which the columns must resist the moments to maintain
static equilibrium with the applied horizontal loads. Turnbuckle
Special end blocks for axial loading
Major axis Minor axis
Major axis deflection
inches x 103 Axial load kips
Axi a l lo a d ki p s C o lu mn e n d mo me n ts ki p -i n ch 8 6 4 2 0
20 40 60 80 100 0
1 2 3
2 4 6
However, in a braced frame if the beams are designed to carry the applied loads as if on knife-edge
supports and the columns are not sensitive to failure by local or torsional buckling then the Òmoment
sheddingÓ behaviour observed by Gent and Milner can be used in the design processthus avoiding the
3
Derivation of
the proposed
column design
model
3.1
Developing a design model
To use the Ômoment sheddingÕ behaviour of the columns in a practical design method, it is necessary to
develop a simple design model that incorporates the main aspects of the structural behaviour. The
main features to be accounted for in modelling and designing discontinuous columns are the:
(a) End rotations of the columns. These are assumed to be equal to the slopes of the beams
because the compression in the columns tends to clamp the beams and columns together. The
slopes of the beams are calculated assuming that the beam is on knife-edge supports and the
column stiffness is zero.
(b) Axial compression in the column.
(c) Bending resistance of the column as reduced by the coexistent axial compression.
Experimental studies [5-8] have demonstratedthat columns shed the end moments caused by imposed
end rotations if they are laterally and torsionally stable. This shedding of the end moments is not
detrimental because the beams are designed to be able to carry the applied loads without assistance
from bending moments in the columns.
The case of a column in single curvature is shown in Fig.3(a). If the end moments are shed entirely,
the bending moment in the column is that required to maintain equilibrium of the axial load in the
deflected column. The bending moment diagram is shown in Fig.3(b). The maximum moment in the
column is equal to the product of the axial load and the maximum eccentricity from the straight line
through the ends of the column. Provided that the column is in single curvature, the maximum
eccentricity of the column lies within the triangle defined by the tangents to the column ends and the
axis of the column before loading, as shown in Fig. 3(c). For equal and opposite end slopes, θ, the
eccentricity at mid-height is less than θh/2. The end slopes, θ, are taken as the slopes of the beams
calculated assuming that the beams are on knife-edge supports and derive no restraint from the
Fig.3Column in single curvature with no end moment (a) deflected column(b) bending moment
induced by axial load(c) tangents to the column ends
Another case of a column in single curvature isshown in Fig. 4(a). This column has not shed all of the
end moments induced by the slopes of the beams. Fig. 4(b) shows the bending moment diagram. If
the end slopes of the column, θ, are the same as in Fig.3, the actual deflection at mid-height is less for
the column in Fig. 4 than for the column in Fig.3. This is because the change of slope from end to end
of the columns, 2θ, is the same but in Fig. 4 more of the curvature occurs at the ends which gives a
smaller deflection at mid-height. Therefore, as was shown for thecolumn in Fig.3, the eccentricity at
mid-height is less than θh/2.
Fig. 4 Column in single curvature with end moments (a) deflected column(b) bending moment
induced by axial load(c) tangents to the column ends
(a) (b) (c)
h
θh/2
(a) (b) (c)
h
Fig.5shows two other cases for columns where the slopes of the beams are not equal and opposite. A
column with equal end rotations (θ1 = θ2 ) is shown in Fig.5(a). The bending moment diagram is shown
in Fig.5(b)assuming that moment shedding occurs. The projection of the end tangent to mid-height is
shown in Fig.5(c). A column with unequal end rotations, θ1> θ2, is shown in Fig.5(d).The bending
moment diagram is shown in Fig. 5(e), assuming that moment shedding occurs only at the end with
the maximum moment, and theprojection to mid-height of the tangent to end with the greatest rotation
is shown in Fig.5(f).
Fig.5Column in double curvature with unequal end-rotations: (a) beams applying equal rotations (b)
moment induced by equal end rotations and load shedding (c) tangent at end with maximum end slope
(d) beams applying unequal rotations (e) moment induced by unequal end rotations and load shedding
(f) tangent at end with maximum end slope
In all the above cases, the resistance of the column to flexural buckling can be found by equating the
destabilising effect to the stabilising effect. The stabilising effect is the reduced moment of resistance
MNrof the columnin the presence ofaxial compression, NEd. The destabilising effect is the moment
applied to the column which is NEde. Writing e ≤ θ1h/2, where θ1 is the maximum end rotation, and
equating the destabilising effect to the stabilising effectthe column will be stable when:
NEdθ1h/2 ≤ MNr (1)
In the case of a column with zero end-rotations, the axial resistance is limited to the strut buckling
moment used in equation (1). Fig.6(c) shows an additional moment of magnitude Ne
ito account for
the effects of initial gometricimperfections and residual stresses.
Fig.6Design model showing (a) column deflected by applied end rotations (b) bending moment
induced by applied end rotations alone (c) design bending moment induced by applied end rotations
plus design imperfection, ei
When the effect of imperfections is included, the design equation (derived from moment equilibrium
at mid-height) becomes:
NEd×(θmaxh/2 + ei) ≤ MNr (2)
where θmaxis the larger slope of the beams at the top or bottom of the column segment,
ei is the appropriate value of imperfection and MNr is the reduced moment of resistance of the column
due to the coexistent axial compression, NEd.
3.2
Proposed design method
The proposed design method has two stages:
Stage1:Beam design
The beams are designed independently of the columns. Single span beams are designed as
simply-supported beams and multiple-span beams are designed as beams on knife-edge supports. The beam
slopes at the supports must be calculated for use in the column design. If the design is to BS5950-1
[13] or to the ASCE manual [14], the designer should use Òpattern loadingÓ to find the worst loading
condition for column buckling. However, if the design is to the Eurocodes and the structure is a
h
/2
h
/2
e
θ(h/2)
M=Nθ(h/2)
End rotation θ
(a) (b) (c)
N
N
M=Nθ(h/2) + Nei
Nθ(h/2)
building, the designer would be free to ignore Òpattern loadingÓ according to the provisions of
EN1991-1-1 [15] Clause 6.2.2(1).
Stage 2:Column design
The columns are assumed to have no effect on the beam design and are designed to resist the design
axial compression and satisfy the following criteria:
i. The rotation at each end of the column is equal to or greater than the rotation of the beam to
which it is connected.
ii. The column must not rely on rotational restraint from the beams to maintain equilibrium.
The proposed column design model is shown in Fig. 6 and the equilibrium equation is derived from
equation (2). The reduced moment of resistance of the columnin the presence of axial load, MNr, is
difficult to calculate accurately because the stress distribution is partially elastic and partially plastic
as shown in Fig.7(a). (There is additional complexity because residual stresses also affect the stress
distribution.) However, as columns shed their end moments extensive plasticity is developed This
means that the stress distribution at the critical cross section approaches that of the plastic moment of
resistance reduced by axial load (see Fig. 7(b)), denoted in the Eurocode by the symbol MN,Rd. The
difference between the two stress distributions is shown diagramatically in Fig.7(c). For the purpose
of illustration a major difference is shown because Fig.7(a) is the stress distribution in the case of a
column with low curvature. For columns with high curvatures, the difference between the stress
distributions for the MNrand MN,Rd would be much less.
Fig.7 Comparison of typical actual v plastic stress distributionsfor a column with low curvature (a)
actual stress distribution assuming no residual stresses (b) plastic stress distribution (c) difference
between (a) and (b)
f
yf
yf
yf
yf
yf
yUsing MN,Rd is attractive because it is easy to define and easy to calulate but it is greater than MNr.
One possibility is to define a factor F such that MNr = FMN,Rd, where F is a factor less than or equal to
1.0 which accounts for the difference between MNrand MN,Rd.
3.3
Defining the design value of the initial imperfection
To define the value of imperfection to be used, a value can be selected such that the column design
model with θmax as zero gives the same resistance as an appropriate national code for the pin ended
strut case. Equation (2)thus becomes:
NEd(θmaxh/2 + es) = FMN,Rd (3)
where θmax is the larger slope of the beams at the top or bottom of the column segment, es is the
design value of the imperfection, MN,Rdis the design plastic moment resistance reduced due to axial
force NEd, and F is a factor less than or equal to 1.0 which accounts for the difference between MNr
and MN,Rd. The approach is similar to classic second-order rigid-plastic analysis [16] except that the
proposed design method includes the design imperfection.
In cases of low curvature,the difference between the actual stress distribution and the classic plastic
stress distribution, as shown in Fig. 7(c), is significant. Where the beam above and the beam below a
column have no rotation, the resistance of the column would be expected to be not less than the
buckling resistance of a pin-ended strut. Therefore the additional imperfection in equation (3) must be
such that the calculated resistance at zero applied end-rotation is equal to the strut resistance. This
allows the new design method to be calibrated to whatever design code is specified by the calculation
of an imperfection, es.
For a strut with a gross cross-sectional area, A, the imperfection, es, may be calculated as follows:
1. Calculate the buckling load of the column, Nb, as if it were a pin-ended strut using the specified
design code.
2. Calculate the area, Ab, stressed to the design yield stress, fyd , required to resist the pin-ended strut
buckling load, Nb, i.e.
Ab = Nb / fyd, (4)
where the design yield stress, fyd, is the characteristic yield stress reduced by the appropriate material
factor for cross-sectional resistance in the specified design code, for example using
BS 5950-1, fyd = py, (6)
AISC 360, fyd = φFy, (7)
3. Calculate the reduced plastic moment of resistance, Mpr, assuming the area Ab is located around the
centroid of the section and resists the axial load with the remaining part of the section resisting the
moment.
4. Calculate the imperfection, es, at the buckling load Nbfrom the assumption that
Nb es = Mpr, (8)
so es = Mpr / Nb. (9)
4
VALIDATION OF THE METHOD
4.1
Analysis method
In order to validate the proposed design method, parametric studies were undertaken with an FE
model created using Abaqus finite element software [17] and calibrated against the results of
laboratory tests conducted with full-size columns. Particular attention was paid to three aspects of the
design method:
1. Demonstrating that the factor F in equation (3) can be safely taken equal to 1.0. This is to be expected
because the simplified rectangular bending moment diagram in Fig. 6(c) over-estimates the bending
moment applied to the column but the classic plastic stress diagram in Fig. 7(b) over-estimates the
bending moment resistance of the column. The two over-estimates tend to compensate for one
another.
2. Confirmation that the design value of the initial imperfection can be reliably taken as the strut
imperfection, es.
3. For different levels of column end-rotation, establishing what breadth-to-thickness ratio is required to
prevent plasticity causing local instability of the tube walls. This aspect is discussed in detail in King
and Davison [19].
Abaqus [17] was used to conduct geometric non-linear and material non-linear analyses. The model
used shell elements with the nodes and the mid-thickness of the elements in the plane of the
centre-line of the walls of the column. The ends of the model are connected to a ÒspiderÓ of rigid-body
elements, whose legs radiate to the point of intersection of the centre-line of the column and the plane
of the end of the column. Most analyses were conducted using a model of the entire column although
the effect of mesh refinement was checked by using a half-model that comprised a column cut
longitudinally along the centre-line of two opposite sides [18].
The mesh of the finite element model is shown in Fig. 8. The same proportions of elements, along the
length of the member, and the same number of elements were used for all full models, whatever the
member length. The element mesh of the walls divides each wall into 6 elements across the width.
The analyses assumed elastic/perfectly plastic material behaviour with the yield stress based on
coupon test results [20]. The residual stress pattern was taken as shown in Fig. 9with fr assumed as
Fig.8 Finite element model mesh of full model
Fig.9 Bi-triangular residual stress pattern (on all sides)
4.2
Comparison of analysis with test results
As the finite element model was to be used to confirm the structural behaviour assumed in the
proposed design method and to conduct an extensive parametric study, it was first necessary to
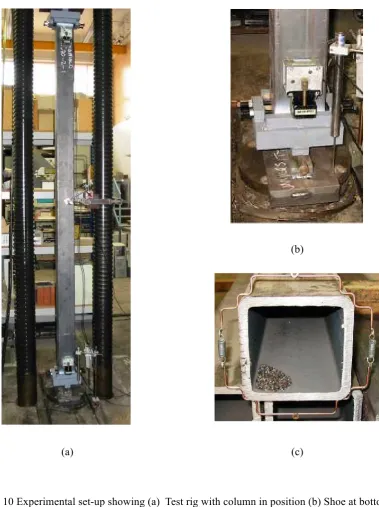
validate the model against a series of experimental tests reported in detail elsewhere [18,19]. A series
of square hollow sections was tested in a hydraulic loading rig, see Fig. 10. All specimens were
Celsius 355 120!120 Square Hollow Sections (SHS), hot-finished hollow sections produced by Tata
Steel to EN 10210 in steel grade S355J2H. Table 1 presents details of the tests and comments on why
each was conducted.
fr
(b)
(a) (c)
Fig.10 Experimental set-up showing (a) Test rig with column in position (b) Shoe at bottom of
[image:17.595.105.485.64.572.2]column (c) Sprung grip-frame to attach to LVDTs
Table 1
Test programme
Test No. Specimen
kc1 120 SHS ! 5mm pilot test
kc2 120 SHS ! 5mm pilot test continuation
kc3 120 SHS ! 10mm stablewall thickness
kc4 120 SHS ! 10mm stable wall thickness
[image:17.595.105.236.69.502.2]kc6 120 SHS ! 5mm wall expect sensitivity to wall slenderness
kc7 120 SHS ! 10mm wall stable wall thickness
kc8 120 SHS ! 10mm wall stable wall thickness
kc9 120 SHS ! 6.3mm wall possible sensitivity to wall slenderness kc10 120 SHS ! 5mm wall expect sensitivity to wall slenderness
The test specification required the columns to be installed into the rig with eccentricities such that the
mid-height bending moment would be similar to that occurring in columns with the worst out-of
-straightness allowed by current Standards. The test columns were found to be very nearly perfectly
straight, so the columns were installed in the rig with equal eccentricity top and bottom of L/750
which is the value of out-of-straightness for a single storey column specified in BS EN 1090-2 [20].
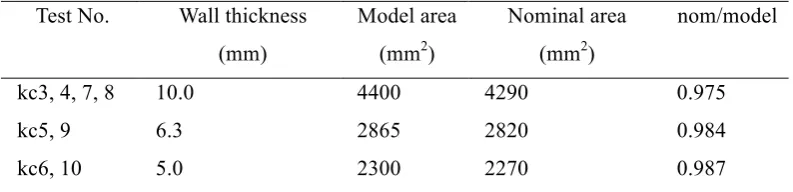
The cross-sectional area of the model is slightly larger than the nominal area of the test specimen as
the model uses the nominal wall thickness but assumes square corners whereas the test columns,
being hot-finished sections, have curved corners with very tight external radii. The analysis results
were multiplied by a reduction factor of Ônom/modelÕ, the ratio of the nominal area to model area,
[image:18.595.78.475.469.565.2]from Table 2 before making comparisons with the test results either by plotting or by calculations.
Table 2
Cross-sectional areas
TestNo. Wall thickness
(mm)
Model area
(mm2)
Nominal area
(mm2)
nom/model
kc3, 4, 7, 8 10.0 4400 4290 0.975
kc5, 9 6.3 2865 2820 0.984
kc6, 10 5.0 2300 2270 0.987
A typical test plot is shown in Fig. 11. The maximum load reached is at B. Because the column was
tested in a hydraulic testing machine it was possible to follow the unloading curve by skilful control
of the oil pressure and flow rate. However, the rate at which the load on the specimen reduced was
difficult to control and it was decided that it would be useful to stop the test and find a ÔstaticÕ point Ð
designated Nu, the point of unloadng Ð to remove any strain rate effects. Therefore at point C the pressure was backed off sufficiently to unload the specimen before reloading back up to point C
Fig. 11 Typical end-rotation v load from tests
The FE model was used to simulate the full-scale laboratory tests. For each test, the model was
correlated to the test both by using the ÒyieldÓ test coupon 0.2% proof stress as the yield stress in the
elastic-perfectly plastic bi-linear material characteristic and by adjusting the initial imperfection in the
model to reproduce the test behaviour of the test from zero to near maximum load (the ÒelasticÓ range
of the test). As shown in Fig. 12, the FE analysis (shown as a dashed line) closely follows the test
results(shown as a solid line).
Mean end rotation
Axi
a
l
L
o
a
d
Nu
A B
C
Fig. 12 Comparison of FE load against end rotation with experimental data 0 200 400 600 800 1000 1200 1400 1600
0 10 20 30 40 50 60 70 80 90 100
A x ia l c o m p re s s io n (k N )
End rotation (mrads)
Test 3 0 200 400 600 800 1000 1200 1400 1600
0 10 20 30 40 50 60 70 80 90 100
A x ia l c o m p re s s io n (k N )
End rotation (mrads)
Test 4 0 200 400 600 800 1000 1200 1400 1600
0 10 20 30 40 50 60 70 80 90 100
A x ia l c o m p re s s io n (k N )
End rotation (mrads)
Test 5 0 200 400 600 800 1000 1200 1400 1600
0 10 20 30 40 50 60 70 80 90 100
A x ia l c o m p re s s io n (k N )
End rotation (mrads) Test 6 0 200 400 600 800 1000 1200 1400 1600
0 10 20 30 40 50 60 70 80 90 100
A x ia l c o m p re s s io n (k N )
End rotation (mrads)
Test 7 0 200 400 600 800 1000 1200 1400 1600
0 10 20 30 40 50 60 70 80 90 100
A x ia l c o m p re s s io n (k N )
End rotation (mrads)
Test 8 0 200 400 600 800 1000 1200 1400 1600
0 10 20 30 40 50 60 70 80 90 100
A x ia l c o m p re s s io n (k N )
End rotation (mrads)
Test 9 0 200 400 600 800 1000 1200 1400 1600
0 10 20 30 40 50 60 70 80 90 100
A x ia l c o m p re s s io n (k N )
End rotation (mrads)
The relationship between the FE analysis and the test results is expressed as a correlation factor, cf,
on the end-rotations. The mean value of end-rotation in the laboratory tests at the point of unloading,
designated θCt, is shown in Fig.13.
Fig.13 Mean end-rotation v load: test v FE
The value of θCt is found from the test results at the load Nu. The value of mean end-rotation
predicted by FE, designated θCA, is found by interpolation to Nu from the adjacent points from the
Abaqus output.
The correlation factor, c
f, is the ratio of the rotations,
cf = θCt / θCA (11)
The values of cf are given in Table 3.A residual stress,taken as 10% of the minimum specified yield
(35.5MPa),was assumed in all cases in the distribution shown in Fig.9.
Mean end rotation
Axi
a
l
L
o
a
d
Nu
A B
C
Z
θCt θCA
Abaqus analysis curve
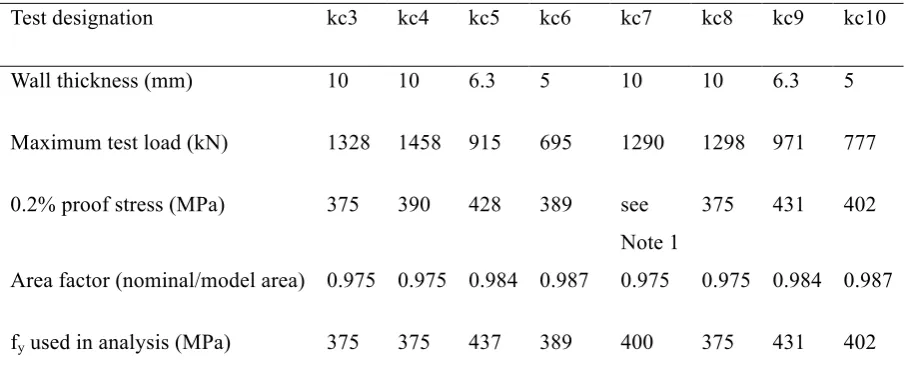
Table 3
Comparison of analysis and test results
Test designation kc3 kc4 kc5 kc6 kc7 kc8 kc9 kc10
Wall thickness (mm) 10 10 6.3 5 10 10 6.3 5
Maximum test load (kN) 1328 1458 915 695 1290 1298 971 777
0.2% proof stress (MPa) 375 390 428 389 see
Note 1
375 431 402
Area factor (nominal/model area) 0.975 0.975 0.984 0.987 0.975 0.975 0.984 0.987
fyused in analysis (MPa) 375 375 437 389 400 375 431 402
With equal eccentricity at the top and bottom of the analysis model
Maximum analysis load (MPa) 1356 1481 930 703 1320 1333 991 773
Analysis load x area factor 1322 1444 915 694 1287 1300 975 763
% error 0.5 1 0 0.1 0.2 0.2 0.4 1.8
et=eb 2.68 0.73 5.27 4.3 4.9 3.08 3.15 2.55
Correlation factor, cf 1.003 1.021 0.831 see
Note 2
0.804 0.841 0.941 0.918
Note 1: 0.2% proof stress not known
Note 2: No unloading cycle in test, so no point at which to calculate correlation
The correlation factors of end-rotation at a given axial load varied between 1.021 and 0.804, with an
average of 0.913. Therefore, the value of correlation factor selected for the calibration of the design
model was taken as 0.800, giving a small margin below the lowest value. While 0.800 might be
considered disappointing as a correlation of end-rotations from a finite element analysis of a structure
in which considerable elastic zones remain, it is considered acceptable for the falling branch of a
compression member which has been almost completely plastified. The correlation between test and
analysis looks much better when examined from the more common point of view of loads. The
lowest correlation factor for end rotation (0.804) was found from test kc7. For this testan axial load
of 927kN was recorded at the ÒstaticÓ point (Nu) compared with 1011 kN predicted by the FEA
model at the same rotation. This gives a ratio of 0.920, which is good for the falling branch in a test
[image:22.595.69.528.108.302.2]4.3
Effects of breadth to thickness ratios of wall
The test results demonstrated that current codes permit cross section slenderness in plastic sections
which are likely to lead to premature buckling in structures using plastic (inelastic) design. King and
Davison [19] discuss this at some length and design limits are proposed for square hollow sections
5
PARAMETRIC STUDIES
5.1
Introduction
The proposed design model was originally conceived for end-rotations in one of the two rectangular
planes of the square hollow section column. However, in real structures columns may have end
-rotations in both rectangular planes (although this is unlikely for the type of construction considered
here where the continuity of beams over the columns is in one direction only). Therefore these cases
were studied for 140!140!10 columns of length 3.0m because this is the most representative length
of columns expected to be used in practice. The study used columns with single curvature because
single curvature is assumed in the design model as it gives the lowest resistance for a given magnitude
of end rotation. The study considered initial imperfections in two different planes, one in a
rectangular plane and the other at 45!to the rectangular planes.
5.2
Column behaviour
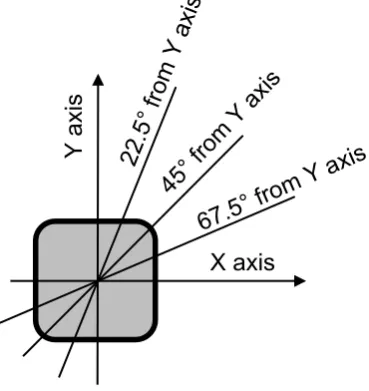
The behaviour of a column with ane initial imperfection in a rectangular plane was studied first;the
initial imperfection was in the plane of the Y-axis, in the positive direction,as shown in Fig. 14. Ten
cases were analysed, with the end rotations in the five planes shown inFig. 14 and listed in Table 4.
In five of the ten cases, the end rotations were applied to cause deflections in the +X/+Y quadrant. In
[image:24.595.218.403.491.687.2]the other five cases, the end rotations were applied to cause deflections in the -X/-Y quadrant.
Fig. 14 Planes of rotation at 0¡, 22.5¡, 45¡, 67.5¡ and 90¡ from the Y-axis.
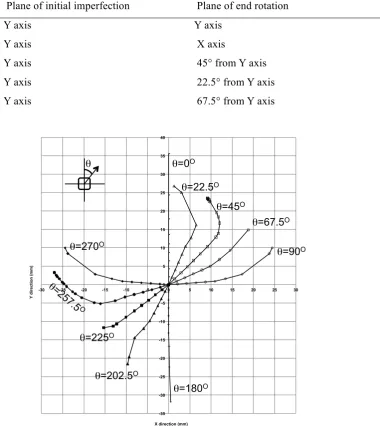
The locus of a point at mid-height of the column is shown in Fig.15. The origin of the graph is the
initial position of the column at midheight (the initial imperfection was in the Y axis plane for all
cases).Asload is added to the columns it follows one of the paths indicated dependent upon the plane
Y
a
xi
s
X axis
22.5 ¡ f
ro m
Y a xis
45 ¡ fro
m Y a
xis
67
.5¡
fro
m
in which the end rotation was applied. This shows that at lower levels of load, the point at mid-height
deflects in the plane of the end-rotation but as the load approaches the maximum the point generally
moves towards the plane of the initial imperfection i.e. X=0 plane (along the Y axis). The only
exceptions are the columns with both (1) rotations moving the point away from the initial imperfection
and (2) resultant end-rotations at less than 45¡ from the plane of the initial imperfectioni.e. cases with
θ = 225¡; 202.5¡. (These exceptions are not the governing cases for design because the initial
imperfection reduces the eccentricity of the load at mid-height, so they have higher resistances than
[image:25.595.80.461.282.709.2]the other cases.)
Table 4
Planes of initial imperfections and end-rotations, see Fig. 15.
Plane of initial imperfection Plane of end rotation
Y axis Y axis
Y axis X axis
Y axis 45¡from Y axis
Y axis 22.5¡from Y axis
[image:25.595.112.385.413.708.2]Y axis 67.5¡from Y axis
Fig. 15 Mid-height displacements Ðend-rotations applied at 0¡, 22.5¡, 45¡, 67.5¡ and 90¡ from
the Y axis with imperfection in plane of the Y axis -35 -30 -25 -20 -15 -10 -5 0 5 10 15 20 25 30 35 40
-30 -25 -20 -15 -10 -5 0 5 10 15 20 25 30
Y d ir e c ti o n (m m )
X direction (mm)
θ θ=0O
θ=22.5O
θ=45O
θ=67.5O
θ=90O
θ=180O θ=202.5O
θ=225O θ=2
5.3
Development of the model for end
-
rotations in both rectangular planes
Fig.15 shows that the point at the mid-height of the column follows path that does not remain in the
same plane as the applied end-rotations as the column approaches failure. This means that the
resistance in cases of end rotations in a plane at an angle to the rectangular axes cannot be accurately
predicted by calculating the resistance of the cross-section to combined axial and bending in the plane
of the applied rotations. It was therefore decided to test the design model for end-rotations in any
plane by applying the true vector magnitude of end-rotationi.e.the root of the sum of the squares of the end-rotations in the two rectangular planes θ = √(θx2+ θy2) but calculating the resistance assuming
the end-rotations were in a rectangular plane. This proved to give safe predictions of column
resistance.
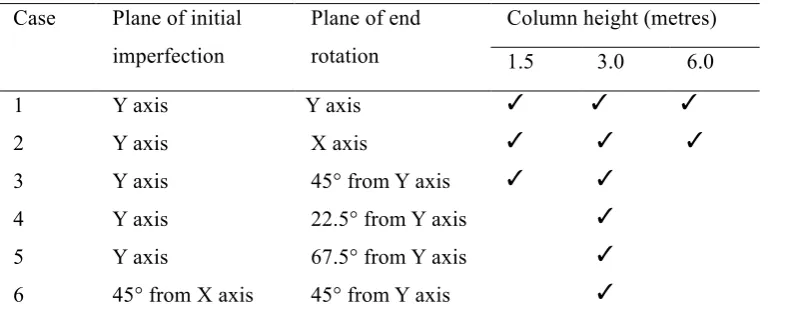
Table 5 summarises all the studies conducted and Fig. 16 presents the results (but for clarity only
cases 1,2,3 are shown). Cases 1 and 2 were analysed for 140!140!10 SHS columns of 1.5m, 3.0m
and 6.0m lengths. Case 3 has been analysed for 140!140!10 SHS columns of 3.0m and 1.5m length
only because the similarity of behaviour in the Cases 1 and 2 show that the Case 3 will be similar for
all lengths of columns. Cases 4, 5 and 6 were performed for the 3.0m columns only because (i) the
analyses of Cases 1, 2 and 3 had shown the similarities between the behaviour of 1.5m, 3.0m and
6.0m lengths and (ii) the 3.0m length of 140!140!10 SHS columns is expected to be the most
representative of the proportions of the majority of structures in which discontinuous columns are
used.The proposed design model provides conservative predictions of the axial resistance in all cases.
Table 5
Planes of initial imperfections and end-rotations, see Fig. 15
Case Plane of initial
imperfection
Plane of end
rotation
Column height (metres)
1.5 3.0 6.0
1 Y axis Y axis ✓ ✓ ✓
2 Y axis X axis ✓ ✓ ✓
3 Y axis 45¡from Y axis ✓ ✓
4 Y axis 22.5¡from Y axis ✓
5 Y axis 67.5¡from Y axis ✓
[image:26.595.80.474.549.715.2]Fig.16 Comparison of design model and FE load versus end-rotation 0 200 400 600 800 1000 1200 1400 1600 1800
0 10 20 30 40 50 60 70
A x ia l re s is ta n c e (k N ) End-rotation (mrads)
1.5m column
proposed designFE rotn at 0¡
FE rotn at 90¡
FE rotn at 45¡
0 200 400 600 800 1000 1200 1400 1600 1800
0 10 20 30 40 50 60 70
A x ia l re s is ta n c e (k N ) End-rotation (mrads)
3.0m column
proposed designFE rotn at 0¡
FE rotn at 90¡
FE rotn at 45¡
0 200 400 600 800 1000 1200 1400 1600 1800
0 10 20 30 40 50 60 70
A x ia l re s is ta n c e (k N ) End-rotation (mrads)
6.0m column
proposed designFE rotn at 0¡
In summary, application of the model in all cases is as follows.
¥ The displacement at mid-height of the column caused by end rotations, as shown in Fig.
17(a), is calculated from the root of the sum of the squares of the end-rotations in the two
rectangular planes. (In many cases the end rotation will be in a single plane.)
¥ Themidheight displacement,(h/2)θ,is applied in the calculation of the resistance as if it were
in one of the rectangular planes. An appropriate value of imperfection, ei, is added in the
same rectangular plane thus the design displacement at midheight (see Fig. 17(b)) is
calculated as:
ed = (h/2)θ + ei (12)
giving the design bending moment:
MEd = NEded = NEd{(h/2)θ + ei} (13)
where ed is the design displacement along one rectangular axis of the SHS; θ is the greater end
-rotation applied to the columnat either end(or the root of the sum of the squares of the end-rotations
in the two rectangular planes); ei is the imperfection along a rectangular axis of the SHS. In the
design model, ei is taken as eswhich is the imperfection along a rectangular axis of the SHS such that
the resistance to axial compression is equal to the pin-ended strut resistance as described in Section
3.6. The design bending moment, MEd, may then be compared with MN,Rd, the design plastic moment
resistance reduced due to axial force NEd.
Fig.17 (a) Load and shape diagram (b) Design bending moment diagram including Nei
h
/2
h
/2
e
θ(h/2) End
rotation θ
(a) N
N
(b)
M=Nθ(h/2) + Nei
Nθ(h/2)
6
Reliability of the proposed design model
6.1
Introduction
A parametric study was conducted to show the reliability of the model as a design tool over a wide
range of slenderness and end-rotations. A separate parametric study was also conducted to establish
the design limits for the wall breadth to thickness ratioto avoid local buckling, as reported in [19].
The section chosen was 140!140!10 SHS in S355 steel, the commonest grade of steel used for
structural hollow sections in Europe. The 10mm wall thickness in a 140!140 SHS is thick enough
not to suffer significant deformations even at high plastic rotations. This section was chosen because
it is one of the largest currently used in multi-storey buildings with discontinuous columns and the
extent of plasticity caused by end-rotations is more pronounced in larger sections as the end-rotations
in the elastic range are less.
The reliability of this model is shown by two methods:
(1) One is by comparing the resistance v end-rotation curves from Abaqus (modified by the
calibration factor Cf)with the curves from the proposed design model.
(2) The other is a comparison of the proposed design model with the test results.
6.2
Comparison of curves of resistance v end
-rotation
The 140!140!10 SHS was analysed for lengths of 3.0m, a representative length for typical residential
construction, and also for lengths of 1.5m and 6.0m to give a wide range of slenderness. End rotations
were applied as equal and opposite because that is both the worst design case and the design case
assumed in the design model. The resistances from the design model were calculated using a total
mid-height eccentricity = es + (h/2)θ where θ = c
f!Abaqus end-rotation with cf = 0.8. (The Abaqus
rotation was reduced bythe correlation factor to correct the overestimate of rotation given by Abaqus
when compared to the test results, as discussed in Section3.2.) It can be seen from the plots in Fig.
19 that the design model always underestimates the resistance of the column at any applied
end-rotation.
6.3
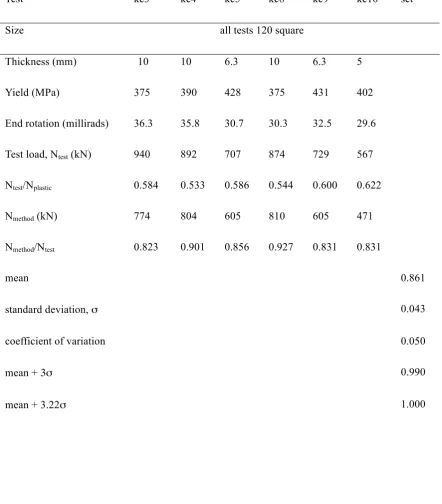
Comparison of proposed design resistance with experimental results
The reliability of the proposed design method was assessed by comparison with the laboratory tests of
the 120 square hollow sections. The resistance was calculated for the end-rotation at the Òstatic pointÓ
properties are used because the properties were not measured for each specimen. The results are
presented in Table 6. The mean of [test resistance]/[proposed method] = 0.861 and the standard
deviation = 0.043, so the difference between the mean of the proposed method and the mean of the test
resistance is 3.22 standard deviations. This shows that the proposed method has a high level of safety.
The independence of the accuracy of the proposed method from the wall thickness of the member is
shown in Table 6. The number of tests is small, but the table show Nmethod/Ntest values that the
reliability is similar for the wall thicknesses of 5mm, 6.3mm and 10mm.The wall thickness did not
affect the reliability because none of the sections experienced significant wall deformations at the
static point.
6.4
Summary of proposed design method
The development of the method has been outlined in some detail in order to explain the underlying
principles of the approach. Depending on the code or standard being used, the details of the
calculations will vary slightly but the basic procedure is summarised as follows:
Step 1: Calculate the slope of the beams at the column supports
Step 2: Use the greater of the beam slopes at the top or bottom of the column as the column end
rotation, θmax
Step 3: Calculate the buckling load, Nb, assuming the column to be a pin-ended strut
Step 4: Find the area of the cross-section, Ab, required to resist the buckling load Nb.i.e. Ab= Nb/fyd
Step 5: Calculate reduced plastic moment of resistance, Mpr, in the presence of the buckling load Nb
Step 6: Find the imperfection, es, satisfying the equilibrium condition Mpr = Nbes
Step 7: Calculate the design deflection, ed, at the column midheight: ed = θmaxh/2+ ei where ei = es
Step 8: Check thatequilbrium condition NEd.ed ≤ MNris satisfied, where MNr is the reduced plastic
Table 6
Comparison of proposed design method with experimental results
Test kc3 kc4 kc5 kc8 kc9 kc10 set
Size alltests 120 square
Thickness (mm) 10 10 6.3 10 6.3 5
Yield (MPa) 375 390 428 375 431 402
End rotation (millirads) 36.3 35.8 30.7 30.3 32.5 29.6
Test load, Ntest(kN) 940 892 707 874 729 567
Ntest/Nplastic 0.584 0.533 0.586 0.544 0.600 0.622
Nmethod(kN) 774 804 605 810 605 471
Nmethod/Ntest 0.823 0.901 0.856 0.927 0.831 0.831
mean 0.861
standard deviation, σ 0.043
coefficientof variation 0.050
mean+ 3σ 0.990
7
Conclusions
!
This paper has described a research investigation to develop and verify a design method for
discontinuous columns in braced frame construction. The use of discontinuous columns offers a
number of practical advantages but presents a challenge to designers. This new approach calculates
the resistance of the column with imposed rotationsrather than moments at its ends. It is based on the
phenomenon of moment shedding i.e. at failure the column is assumed to have zero moment at each
end.
To validate the method an experimental test programme was conducted along with a parametric study
using FE models. The results of the parametric study show that the design model illustrated in Fig.17
is valid using the:
1. resistance properties about a rectangular axis,
2. anapplied end-rotation (even when not in a rectangular axis)
3. an initial imperfection,e
i, defined as the imperfection about a rectangular axis that gives the
buckling resistance of a pin-ended strut, es
.
The design model has been compared with FE results across a range of practical sizes and found to
give safe results.Designers should have little difficulty in using the method, which can be adapted for
use with any modern limit state design code, as it has many similarities with the design of pinned
columns with which they are familiar. Caution should be exercised in situations where the column size
or length differs greatly from the practical cases considered.
Acknowledgements
The authors wish to thank the Steel Construction Institute for funding the fees of the first author for
REFERENCES
1
AD281: The use of discontinuous columns in simple construction New Steel Construction, February
2005
2
AD283: The use of discontinuous columns in simple construction (Part 2) New Steel Construction,
March 2005
3
AD285 Floor systems for simple construction using discontinuous columns and continuous beams,
New Steel Construction, April 2005. 4
AD292 The use of discontinuous columns and shallow deck composite slabs on floor beams, New
Steel Construction, October 2005.
5
Gent, AR. Elastic-plastic column stability and the design of no-sway frames, Proceedings of the
Institution of Civil Engineers, 34, June 1966 p129-152
6
Gent, AR and Milner, HR. The ultimate load capacity of elastically restrained H-columns under
biaxial bending, Proceeedings of the Institution of Civil Engineers, 43, Decmeber 1968, p685-704
7
Davison, JB, Kirby, PA and Nethercot, DA. Column Behaviour in PR Construction - Experimental
Behaviour, ASCE Journal of Structural Engineering, Vol 113, No 9, September 1987, pp 2032-2050
8
Gibbons, C, Nethercot, DA, Kirby, PA and Wang, YC. An appraisal of partially restrained column
behaviour in non-sway steel frames, Proceedings Institution of Civil Engineers, Structures and
Buildings, 99, February 1993, pp.15-28
9
Nethercot, DA. The importance of combining experimental and numerical study in advancing
structural engineering understanding, Journal of Constructional Steel Research, 58, 2002, pp
1283-1296
10NCCI
: Determination of moments on columns in simple construction, SN005a-EN-EU; 2005
Download available at http://www.steel-ncci.co.uk
11
Davison, JB and Owens GW, Steel DesignersÕ Manual, 7thEdition, Wiley-Blackwell, 2012
12
Kirby, PA, Bitar, SS and Gibbons, C. Design of columns in non-sway semi-rigidly connected
frames, Proceedings of the First World Conference on Constructional Steel Design, ed. Dowling, PJ
et. al. Mexico, December 1992
13
BS 5950-1:2000 Structural use of steelwork in building - Part 1: Code of practice for design - Rolled
and welded sections British Standards Institution 2000
14
Plastic Design in Steel; A Guide and Commentary ASCE - Manuals and Reports on Engineering
Practice - No. 41 American Society of Civil Engineers, 1971 15
EN 1991-1-1:2002 Eurocode 1, Actions on structures. General actions. Densities, self-weight,
imposed loads for buildings. CEN (European Committee for Standardization), 2002
16
Horne, MR, Elastic-plastic failure loads of plane frames Proceedings of the Royal Society, Vol A,
Part 274, pp 343-64, 1963
17
18
King, CM. Column Design for Axial Compression and End Rotation, PhD Thesis, University of
Sheffield, June 2010
19
King CM and Davison JB. Cross-section slenderness limits for columns with plastic rotations,
Journal of Constructional Steel Research, 95, 2014, pp 162-171 doi:10.1016/j.jcsr.2013.11.019
20
BS EN 1090-2:2008 Execution of steel structures and aluminium structures. Part 2: Technical