Introduction to Environmental Science: 2nd Edition
Full text
Figure


Related documents
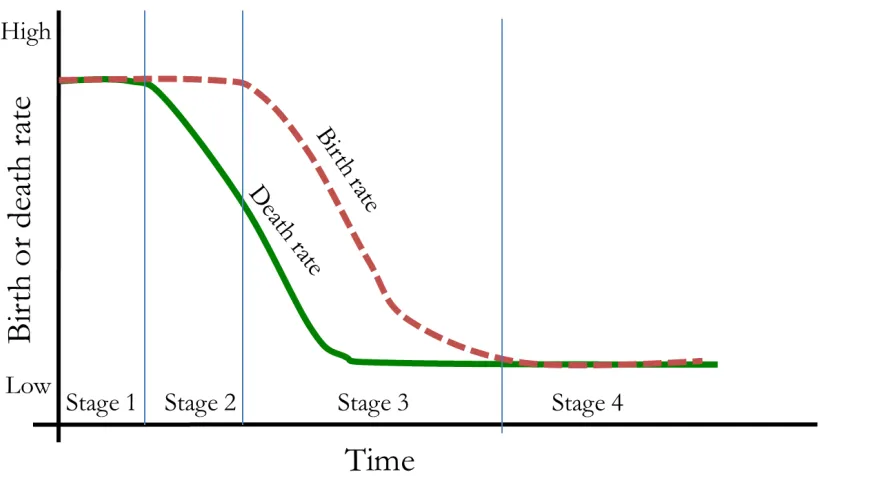
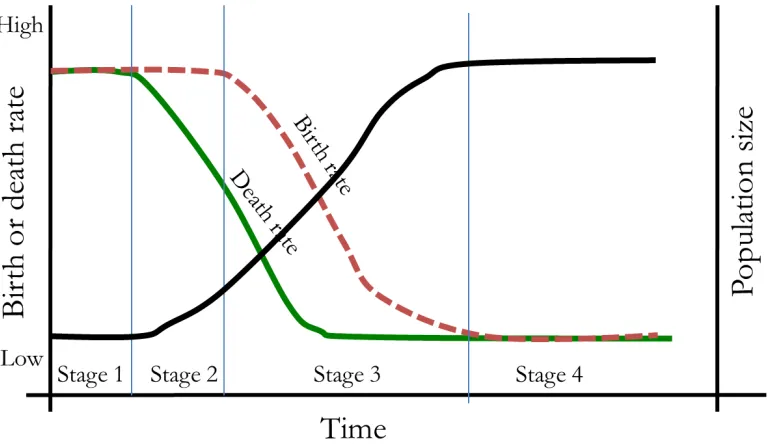
C An increasing birth rate combined with a falling death rate leads to natural increase.. When this is combined with high rates of net inward migration, population growth rates
birth rate and immigration = make the population increase death rate and emigration = make the population decrease.. What factors cause populations
By seeing companies’ data, reading customers’ feedback very closely, interacting with some customers, taking interview of one of the FAFA’S manager and work experience of myself
[r]
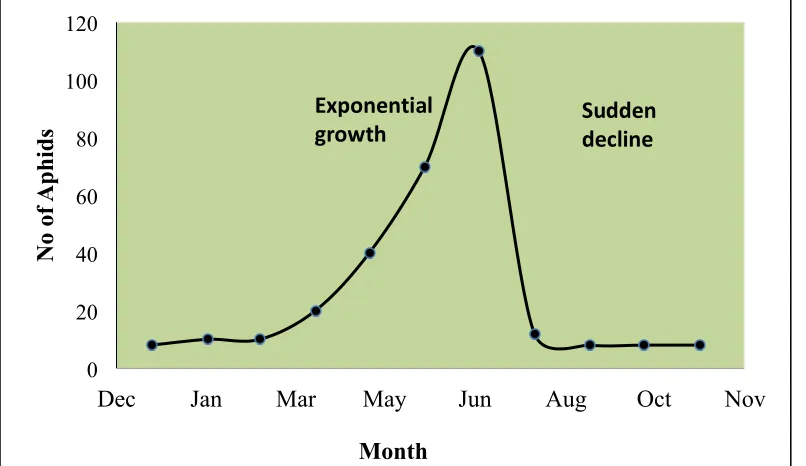
In the logistic population growth model, the per capita rate of increase approaches zero as the population size nears the carrying capacity.. The logistic model of
transitional – with improvements in medicine, sanitation, and food supply the death rate declines; however, the birth rate remains high = rapid population growth. industrial
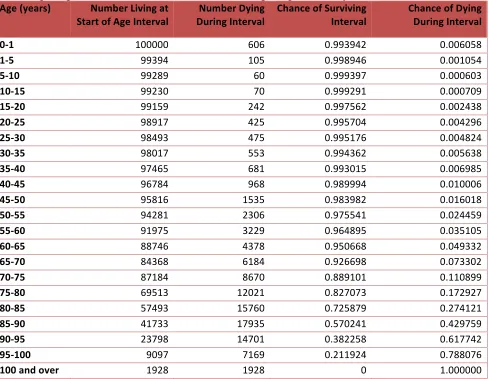
“You can measure population change through the Crude Birth Rate, the Crude Death?. Rate, and the Natural
Density Dependent Factors cause changes to the birth or death rate as the population density changes, usually causing an increase in the death rate as population density increases.
