Iowa State University Patents
Iowa State University Research Foundation, Inc.
6-6-1995
Acoustic and video imaging system for quality
determination of pharmaceutical products
Manjit K. Misra
Iowa State University, mkmisra@iastate.edu
Yuh Yuan Shyy
Iowa State University, yshyy@iastate.edu
Follow this and additional works at:
http://lib.dr.iastate.edu/patents
Part of the
Agriculture Commons
, and the
Bioresource and Agricultural Engineering Commons
This Patent is brought to you for free and open access by the Iowa State University Research Foundation, Inc. at Iowa State University Digital Repository. It has been accepted for inclusion in Iowa State University Patents by an authorized administrator of Iowa State University Digital Repository. For more information, please contactdigirep@iastate.edu.
Recommended Citation
Misra, Manjit K. and Shyy, Yuh Yuan, "Acoustic and video imaging system for quality determination of pharmaceutical products" (1995).Iowa State University Patents. 266.
Acoustic and video imaging system for quality determination of
pharmaceutical products
Abstract
A flexible system for determining the quality of pharmaceutical products based on characteristics such as, for example, mass, shape, hardness, size, color and surface texture is disclosed herein. The quality determination apparatus includes a feeder assembly for sequentially dropping individual product samples upon an impact transducer arrangement. The impact transducer generates transducer signals indicative of the physical characteristics of each product sample. In addition, an imaging device operates to synthesize a digital image representation of each product sample. The transducer signal and digital image representation corresponding to each product are analyzed so as to determine the appropriate degree of quality to be associated therewith.
Keywords
Agricultural and Biosystems Engineering
Disciplines
Agriculture | Bioresource and Agricultural Engineering
. US005422831A
Unlted States Patent [19]
[11] Patent Number:
5,422,831
Misra et a1.
[45]
Date of Patent:
' Jun. 6, 1995
[54] ACOUSTIC AND VIDEO IMAGING SYSTEM [56] References Cited
FOR QUALITY DETERMINATION OF
PHARMACEUTICAL PRODUCTS U.S. PATENT DOCUMENTS
2,661,090 12/1953 Garrett ... .. 209/107
' u , 5,309,374 5/1994 Misra et a1. ..; ... .. 364/552
[75] Inventors: ManJIt K. Misra; Yuh-Yuan Shyy,
both of Ames, Iowa Primary Examiner-Edward R. Cosimano
Attorney, Agent, or Firm-Flehr, Hohbach, Test,
[73] Assignee: Iowa State University Research Albmton & Herbert; Kevm I’ Z er
Foundation, Inc., Ames, Iowa [57] ABSTRACT
A ?exible system for determining the quality of pharma
[21] Appl. No.: 196,844 ceutical products based on characteristics such as, for
example, mass, shape, hardness, size, color and surface
[22] Filed Feb 15 1994 texture is disclosed herein. The quality determination
. . ,
apparatus includes a feeder assembly for sequentially dropping individual product samples upon an impact
R e1 at e d Us. Application Data transducer arrangement. Theimpact transducer gener
ates transducer slgnals 1nd1cat1ve of the physIcal charac
[63] Continuation-impart 0f Sef- NO- 924,195, Avg 3, 1992, teristics of each product sample. In addition, an imaging
Pat‘ No- 5,309,374“ ' device operates to synthesize a digital image representa
tion of each product sample. The transducer signal and
[51] Int. Cl.6 ... .. G06F 19/00 digital image representation corresponding to each [52] US. Cl; ... .. 364/552; 356/407; product are analyzed so as to determine the appropriate
382/ 128 degree of quality to be associated therewith.
[58] Field of Search ... .. 356/407; 364/552;
382/1, 8 22 Claims, 12 Drawing Sheets
400 ,- BEGIN IMPACT
‘ SIGNAL ANALYSIS
ROUTINE
V
. DEFECT
405 A PEAK OF
ROTATE FEEDER IMPACT SIGNAL ‘\ 430
4 1 O IMPACT TRIGGER ?
MASS EVALUATION ”' ‘435
SLOPE CALCULATION A440
415 ’ STOP FEEDER
HARDNESS DETERMINATION 445
DIGITIZE TRANSDUCER
4-20 ’ DATA AND TRANSFER I
To INTERFACE CARD QUALITY DETERMINATION K450
US. Patent
June 6, 1995
Sheet 1 0f 12
5,422,831
All .Uhm
bmnzm baqam
Egon‘ Egon‘
@2302: kmuzbmco?
82>
Q2 Q2 98 ESE
Q r r _ / L
‘6:: E<
.,
Emmi
38%
329%
/
/r
/
.
/
/
8.3mm o
B /CO.3O0.\®E \O\\\\|\\\0
/
n
\
omll/ , n
awful \?i/ H
Om
0
\\ ./|
‘Ill
n
UnO
0
GM.)
E5: 3%
,
‘ Egon‘
ow
//
55:90
n v _ _
. / \
81/ E
E
4/12
\
Wm“
Os
US. Patent
June 6, 1995
Sheet 6 of 12
5,422,831
4349M. kmqig
~
_ _ _
_
US. Patent
BEGIN
l
June 6, 1995
SEARCH
EDGE DETECTION
AND BOUNDRY
NO
ATTEMPT ?
SECOND
Sheet 7 of 12
530
5,422,831
525
SHAPE ANALYSIS ' 568
‘ . 532
ROUGHNESS ’ 600 ‘
ANALYSIS
REJECT
STORE ANALYSIS
"\
605
RESULTS
/_534
U.S. Patent
June 6, 1995
Sheet 8 of 12
5,422,831
US. Patent
June 6, 1995
SheeI 9 of 12
5,422,831
BEGIN EDGE
A535
DETECTION ROUTINE
SEARCH DOWNWARD
FROM UPPER EDGE
OF DATA FRAME
A 540
EOCE NOT
BEGIN BOUNDRY
A560
FOUND
SEARCH
PIXEL COuNT =
A565
PIXEL COUNT + 1
I
sTORE COOROINATEs A 570
OF EOCE PIxEL
LAST EDGE
PIXEL VERY
CLOSE TO
FIRST EDGE
PIXEL ?
ABORT BOUNDRY
BOUNDERY
SEARCH
DETERMINATION
A
580
\ 590
COMPLETED .
II
LOCATE
CENTER OF
A595
PILL
I
, RETURN TO
IMAGING
A592
ANALYSIS
PROCRAM
US. Patent
June 6, 1995
Sheet 10 of 12
5,422,831
FIG.—1O
BOUNDARY
TOP
LEFT
\
\
RIGHT
I
_ PIXEL
P (II)
BOTTOM
US. Patent
June 6, 1995
Sheet 11 of 12
5,422,831
N
NJQPN
,Omm.
A M
Lotm mqccm,
.Q
BOG
bobczom IL‘
5,422,831
US. Patent
June 6, 1995
Sheet 12 of 12
610 \
TEXTURE
ANALYSIS
PROGRAM
640
675
_\ INITIAL/2E
MAGNATUDE OF
NO
PARAMETERS
PUM’D'PU’I)
620 \
YES K645
I = TOP A
_ INCREASE
J T LEFT ACCUMULATED
TEXTURE ERROR
" BY ONE uNIT
READ PIXEL P(J,I)
= J+1
INCREMENT
650
ACCUMULATED
630
AREA AND
GREEN INTENSITY
PIXEL P(J,D
655
N0
RED ?
PIXEL P(J+1,I)
635
x
READ PIXEL P(J+1,1)
I = BOTTOM ?
5,422,831
1
ACOUSTIC AND VIDEO IIVIAGING SYSTEM FOR
QUALITY DETERMINATION OF
PHARMACEUTICAL PRODUCTS
The United States government has certain rights in
the invention pursuant to contract No. ITA 87-02 be
tween the US. Department of Commerce and Iowa
State University.
This is a continuation in part of copending application
Ser. No. 07/924,195, ?led Aug. 3, 1992, now US. Pat.
No. 5,309,374.
The present invention relates generally to quality control of pharmaceutical products, and particularly to
quality control techniques involving acoustical and
video signal processing.
BACKGROUND OF THE INVENTION
Quality control of pharmaceutical products, e. g.,
tablets and pills, has become a subject of considerable interest as mass production techniques have become
increasingly prevalent within the pharmaceutical indus try. Methods of testing pharmaceutical products have
involved determination of various quality parameters
including, for example, weight, thickness and hardness. Conventional approaches to measuring theselparame
ters have generally involved mechanical and electrome
chanical testing apparatus. For example, the weight
measurement has been accomplished by using load cell technology, and thickness is generally measured by
using electromechanical sensing. In determining hard
ness an increasing force is applied until the pill or tablet is ruptured. A hardness value is then calculated in ac
cordance with an empirical relationship relating applied
force to displacement of the product surface. Unfortu nately, however, this technique for hardness determina
tion results in destruction of the product under test.
In the agricultural industry efforts have been made to use computer-assisted imaging, rather than mechanical techniques, to facilitate recognition of defective agricul
tural products. Computer imaging systems generally
include a color video camera connected to a frame
grabber. The frame grabber digitizes the image pro
vided by the camera and relays the image information
to a computer. Analysis of the digital image information may then be performed using a variety of techniques. In particular, the potential has been shown to discriminate
between crop seeds and certain common contaminants based on image parameters such as area, perimeter,
aspect ratio, shape factor, and the like. Other applica
tions have involved classi?cation of diploid and tetra
ploid ryegrass seeds, and orientation determination of
vegetables using grey-level intensity gradients and syn tactic pattern recognition techniques.
By way of example, a computer vision system for
determining soybean quality based on size and shape parameters has been developed (see Misra, et al., Com puter Vision jbr Soybeans, presented at the 1989 Interna
tional Summer Meeting of American Society of Agri
cultural Engineers and Canadian Society of Agricul
tural Engineering, Paper No. 89-3001). Images of a
soybean are ?rst captured using a charge-coupled de vice (CCD) camera and digitized by a frame grabber.
The image processing sequence is initiated by determin ing an outline of the soybean under analysis by search ing for contrasts between the portions of the image corresponding to the background and to the soybean
itself. A routine is then used to ?t an ellipse to the out
15 20 25 30 35 45 50 55 60 65
2
line, since acceptably healthy soybeans were found to
be generally elliptical in shape. While capable of suc
cessfully discriminating between soybeans having vary
ing degrees of quality, it is believed that the efficiency
of the machine vision system described above could be
improved by modi?cation of particular aspects of the
disclosed image processing sequence.
Concurrent with the development of the image pro cessing techniques described above, efforts have been made to develop acoustical methods of analysis based
on the transmittance, absorption or re?ection of sound
waves by agricultural products. These techniques are
based on the realization that even minor changes in the structure or health of a product will result in variation
of its acoustic properties. Such variations can be quanti
tatively evaluated by analyzing the frequency compo
nents of the sound wave. Frequency data is generally
processed using analytic procedures such as the Fast
Fourier Transform (FFT), which can be performed to identify the ways in which selected frequencies are
absorbed, transmitted .or re?ected by the product being investigated. These frequency response characteristics
can be correlated with various physical properties of
the product related to quality.
In the particular case of the analysis of soybeans, at least two types of acoustical methods have been investi
gated (see, e.g., Misra, et al., Acoustic Properties of Soy
beans, Transactions of the American Society of Agri
cultural Engineers, 33(2):671—677). In a ?rst, or “acous
tic transmission” technique, a soybean kernel is placed between transmitting and receiving transducers where
the former introduces an acoustic impulse to the kernel and the latter records the wave transmitted through the kernel. Both waves, the input and the transmitted, can
be digitally recorded and analyzed by a Fast Fourier
Transform. The two spectra can then be compared,
usually by dividing the transmitted wave by the input
wave to identify frequencies that are preferentially ab
sorbed by the kernel so as to provide an indication of
kernel quality. Speci?cally, quality may be determined by analyzing the‘ differences in the absorption spectra of
a “good” or reference soybean and the soybean under
scrutiny. Unfortunately, the acoustic transmission spec
tra of an ideal soybean has been found to be difficult to
describe mathematically. Accordingly, correlation be
tween the transmission spectra and size or mass of the
soybean has not been possible, thus precluding effective quality determination. Moreover, the placement of each
soybean between the transducers has been found to be a
relatively slow process.
A second, or “impact-force” method of acoustical
characterization of soybeans involves dropping soy
beans through a guide tube coupled to a piezoelectric
force transducer. An impact signal generated by the
transducer is routed to a digitizer and then to a com
puter. A computer program then operates to derive the
frequency spectra of the impact signal by using an FFT algorithm. As in the acoustic transmission technique,
correlation of the frequency spectra of the impact signal
with a set .of quality parameters requires the spectra to be mathematically described. Such a description could
be effectuated through, for example, polynomial ap
proximations, sine functions, or simple Bessel functions. Although the impact-force method has been shown to allow for faster determination of soybean quality, the frequency-domain procedure outlined above is rela
tively computationally intensive. That is, the procedure
requires an initial FFT conversion of the impact signal
5,422,831
3
into the frequency domain and a subsequent parameter ization of the spectral characteristics so obtained. It is thus believed that a time-domain method for analyzing
the transducer signal produced by an impact-force ap
paratus would allow for a more rapid determination of
> the quality of articles such as agricultural products,
pharmaceutical products, and other similarly shaped edible material (e.g., hard candy).
While image processing and acoustical techniques
have each been of separate assistance in determining quality within the agricultural ?eld, it is believed that a novel system incorporating both of these methodolo gies would allow for increased testing ?exibility in agri cultural and other industrial applications. For example,
when employed within the pharmaceutical industry
such an integrated system would allow a user to specify
that a set of product characteristics derived from both the acoustical and video realms constitute the basis for
acceptable quality.
OBJECTS OF THE INVENTION
It is an object of the present invention to provide a
system for determining the quality of pharmaceutical
products in which is incorporated both image process
ing and acoustical techniques.
SUMMARY OF THE INVENTION The present invention addresses the need for a ?exi
ble system for determining the quality of pharmaceuti
cal products based on characteristics such as, for exam
ple, mass, hardness, shape, color and surface texture.
The inventive quality determination apparatus includes a feeder assembly for sequentially dropping individual
product samples upon an impact transducer arrange ment. The impact transducer generates transducer sig nals indicative of particular physical characteristics of each product sample. In addition, an imaging device operates to synthesize a digital image representation of
each product sample. The transducer signal and digital
image representation corresponding to each product are
then analyzed so as to determine the appropriate degree of quality to be associated therewith.
BRIEF DESCRIPTION OF THE DRAWINGS Additional objects and features of the invention will be more readily apparent from the following detailed description and appended claims when taken in con
junction with the drawings, in which;
FIGS. 1a and 1b show a see~through side view and a
front view, respectively, of a preferred embodiment of
the pharmaceutical product quality determination sys
tem of the present invention. '
FIG. 2 provides a detailed view of a partially disas
sembled drop tube feeder apparatus.
FIG. 3 shows a more detailed side view of an pharma
ceutical product holding bin and product rejection de vice.
FIG. 4 provides a block-diagrammatic overview of
the signal.processing elements incorporated with the
inventive pharmaceutical product quality determination
system. I
FIG. 5 shows a ?ow chart of a time-domain impact
signal analysis routine.
FIG. 6 illustratively represents the electrical output of the impact transducer generated in response to the
impact of a sample pill thereupon.
5 20 25 35 45 50 60 65
4
FIG. 7 depicts a flow chart of an imaging analysis
routine utilized by the inventive quality determination system.
FIG. 8 depicts a simpli?ed illustration of a digital
image representation of a ?eld of view encompassed by the imaging device included within the inventive qual
ity determination system.
FIG. 9 is a ?ow chart summarizing the manner in
which the edge of an image of an pharmaceutical prod uct sample is distinguished from the background of a
digital image representation thereof.
FIG. 10 illustratively represents a set of eight direc tion vectors used in a boundary search operation per
formed in connection with the digital image analysis of
each product sample.
FIG. 11 depicts the manner in which the shape and
the boundary roughness of each sample pill may be
calculated using an accumulated set of boundary pixels
and the location center of the sample pill.
FIG. 12 depicts the manner in which the texture, area and color of the surface of each sample pill may be calculated using a pixel-by-pixel comparison and area normalization.
FIG. 13 is a flow chart depicting implementation of a texture analysis program.
DESCRIPTION OF THE PREFERRED
EMBODIMENT
Description of Mechanical Apparatus:
Referring to FIGS. 1a and 1b, there are shown a
see-through side view and a front view, respectively, of a preferred embodiment of the pharmaceutical product quality determination system 10 of the present inven tion. The inventive system 10 is adapted to analyze
relatively ?rm pharmaceutical products, such as pills,
tablets and capsules. Nonetheless, it is understood that the speci?c mechanical implementation of the system 10
depicted in FIG. 1 may be modi?ed to accommodate
analysis of pharmaceutical products of varying size and
?rmness. It is further understood that although the
following detailed description makes speci?c reference
to pharmaceutical pills as being the subject of analysis, the teachings of the present invention are equally appli cable to pharmaceutical tablets, capsules and the like.
The quality determination system 10 is enclosed within a housing 20 and includes a drop tube feeder apparatus 30, a video imaging device 40, and a quality control rejection device 50. As is described in detail
below, the pills or other pharmaceutical products to be
analyzed are loaded into a roller-feed device 60 in
cluded within the feeder apparatus 30. The device 60 feeds one pill at a time to a drop tube 70. Each pill then slides down tube 70 and falls upon an impact transducer
80. An acoustical impact signal generated by the trans
ducer 80 is then digitized and routed to a computer (not
shown) for analysis. Based on this analysis the quality of
the pill may be evaluated in terms of mass and hardness. The pill is de?ected by the transducer 80 into a U-chan
nel trough 90, which guides the pill to a holding bin 100.
The video imaging subsystem 40 operates to create a
digital image representation of the pill while it is con ?ned in the holding bin 100. The digital image represen—
tation of the pill is then processed so as to enable a determination of quality to be made on the basis of
parameters such as lustre, color, shape and roughness.
5,422,831
5
the criteria used in making an overall assessment of
pharmaceutical product quality. As shown in FIG. 1A,
the rejection device 50 routes pills to either accepted
pill bin 120 or rejected pill bin 130 from the holding
chamber 100 in accordance with such a composite qual
ity evaluation.
FIG. 2 depicts the drop tube feeder apparatus 30 in a
partially disassembled con?guration. The roller-feed
' device 60 is of a type in which a pair of rollers 190 and 191 turn in opposite directions so as to convey each pill to be analyzed to the tube 70. Such a device is described
in, for example, U.S. Pat. No. 2,661,090, entitled SORT
ING MACHINE, issued Dec. 1, 1953, which is herein incorporated by reference. It is understood other appa
ratus for providing individual pills to the tube 70 may be
utilized without departing from the scope of the present invention. Referring to FIG. 2, the pills to be analyzed
are loaded into a hopper 192. From the hopper 192 the pills pass through an aperture (not shown) to a rubber
ized 3-blade star wheel 194 disposed to rotate about an axis A. The star wheel 194 revolves at a rate about the
axis A selected to ensure that the delay between pills dropped into the tube 70 is suf?cient to allow for ade
quate signal processing of the data accumulated for each pill. The spacing between the rollers 190 and 19 1
is adjusted based on the expected size of the pills to be
received from the star wheel 194. In the preferred em bodiment the rollers each rotate at a rate of approxi
mately 3,000 rpm.
Again referring to FIG. 2, the drop tube 70 is typi cally approximately 4 inches in length, is oriented at 45
degrees relative to vertical, and extends into a rectangu
lar coupling member 210 of the U-channel trough 90. The impact transducer 80 is secured by hardware 220 to
a third bracket 230, with the third bracket 230 being af?xed to the coupling member 210 using hardware 240. The bracket 230 serves to position the impact trans
ducer 80 such that pills falling from the drop tube 70 are
de?ected by the transducer 80 into the 2" U-channel
trough 90. The transducer 80 may be implemented with,
for example, a conventional impact transducer manu
factured by PCB Piezotronics of Depew, N.Y., part no. 208A02. Subsequent to de?ection by the transducer 80, each pill slides through the U-channel trough 90 into
the holding bin 100.
FIG. 3 shows a more detailed side view of the hold
ing bin 100 and rejection device 50. Also shown in FIG.
3 is U-shaped ?uorescent lighting source 250 interposed
between the holding bin 100 and a lens element 260 of
the video imaging device 40. The imaging device 40 is designed to create a digital image representation of each pill entering the holding bin 100 from the trough 90.
Such an imaging system could be conventionally real
ized using an arrangement consisting of a camera, and a
frame grabber. Preferably, however, the imaging de
vice 40 will be implemented with an integrated unit
similar to, for example, a conventional slide scanner. A
slide scanner having suitable resolution is available from
RasterOps Corp. of Santa Clara, Calif, as the “Ex
presso”. The device produces either standard NTSC or PAL video output, and images can be captured by a computer using a frame grabber board.
Referring to FIG. 3, lens element 260 is in optical alignment with an image axis I, while the U-shaped
lighting source 250 partially encircles the axis I. The lighting source 250 provides uniform illumination over
the surface of pills within the holding bin 100, and may be implemented with, for example, a 110 Volt ?uores
25 35 40 45 50 55 60 65
6
cent tube. The imaging device 40 is triggered to create an image of the contents of the holding bin 100 follow
ing impact of a pill upon the transducer 80. Again, the impact signal generated by the transducer 80 may be
monitored to determine the precise time at which a pill
collides with the transducer 80. As is discussed more
fully below, the present invention employs an object
detection scheme to determine when a pill enters the
?eld of view of lens element 260 upon entering holding bin 100 after being de?ected by the impact transducer
80. The object detection process is repeated until the imaging system 40 is successful in capturing an image of the pill. Given that many varieties of pills are white or
of an otherwise light color, in the presently preferred
embodiment of the inventive system 10 the interior
surfaces of the holding bin 100 are painted ?at black in order to improve the contrast of the digital image repre
sentation.
As is shown in FIG. 3, a photocell 270 for determin ing pill lustre (re?ectivity) is mounted on an interior
surface 272 of the holding bin 100. The photocell 270
will preferably be installed within a 2" diameter tube oriented downward at 45 degrees relative to the bin
surface 272. The photocell 270 is disposed to continu ously provide an electrical signal indicative of the
amount of radiant energy from the lighting source 250
re?ected by the holding bin 100 and by any pills therein.
Pill re?ectivity is determined by sampling the photocell
signal, generally at a sampling rate of less than 1 MHz,
during an interval immediately following generation of
the impact signal. Between one and three hundred sam
ples will typically be averaged and the result compared
with a background photocell signal (i.e., the signal pro
duced by photocell 270 when no pills are present within
the holding bin 100). The results of this comparison are
indicative of pill re?ectivity, and are stored in the mem
ory of a host computer described below. The photocell 270 can be conventionally realized using, for example, a
cadmium sulphide photocell, available from Radio
Shack, Inc., part no. 276-116. Referring to FIG. 3, the
holding bin 100 includes a hinged ?oor 280 coupled to
a ?rst solenoid 290. After an image of the pill within the
holding bin 100 has been created by the imaging device
40, solenoid 290 is actuated and operates to rotate ?oor
280 clockwise about hinge 310. The pill resting on floor 280 then falls through chute 320 and either is collected
by rejected pill bin 130, or is de?ected by a hinged arm
340 into accepted pill bin 120. If the pill has been deter
mined to be of acceptable quality a second solenoid 360
having a shaft 370 coupled by an “0” ring (not shown)
to hinged arm 340 operates to rotate arm 340 clockwise
about hinge 362. The falling pill is thereby de?ected by
arm 340 into accepted pill bin 120. The ?rst and second
solenoids 290 and 360 then return the ?oor 280 and arm
340 to their respective initial positions. Description of Computer and Interface:
FIG. 4 provides a block-diagrammatic overview of
the signal processing elements incorporated within the
inventive pharmaceutical quality determination system
10. General computing capability is provided by a Gate
way 386-33 microcomputer 345 operative at 33 MHz. The Gateway 386-33 includes an IBM PC/ AT compati
ble microcomputer based on an Intel 80386-33 proces sor together with an Intel 80387-33 math co-processor,
and also was equipped with four megabytes of random access memory (RAM), disk drives, and a hard drive.
When the imaging device 40 is conventionally imple
5,422,831
7
image capture board (frame grabber) having 512 kilo
bytes of static RAM enables the Gateway 386-33 to digitize electronic photographs from the camera. This
enables display of the digital image representation syn
thesized by the imaging device 40 on an analog RGB
monitor or an NTSC color video monitor. The cap
tured images exhibited 512 (horizontal) by 483 (verti cal) pixel resolution, with each pixel representing one of 32,768 displayable colors.
Referring to FIG. 4, a Keithly DAS-50-1M, A/D
high speed interface card 380 for digitizing the impact
and photocell signals is incorporated within the mi
crocomputer. The Keithly DAS-SO provides a 1 MHz
conversion rate, and is equipped with an on-board mem
ory buffer for locally holding data until access is re quested by a transfer command from the microcom
puter. The impact signal from transducer 80 is routed to channel #0 of the interface card 380, while the signal from the photocell 270 is received by channel #1. In
order to access the interface card 380, a series of ASCII commands are sent by software resident within the
microcomputer in accordance with the syntax for the
card 380. Speci?cally, a procedure written in the Pascal
computer language linked with an assembly language
subroutine has been written to read registers of the interface card 380, and to control the transfer of infor mation from the interface card data buffer.
Again referring to FIG. 4, the ?rst and second sole
noids 290 and 360 are controlled by the microcomputer via a PIC-12 input/output 385 board in conjunction with an ERA-01 S-channel relay board 395. A group of
device functions for controlling the solenoids 290 and 360 have been written using Microsoft Macro-Assem
bler.
Analysis of Impact Signal:
FIG. 5 shows a flow chart of the time-domain impact
signal analysis routine. Again, the impact signal is gen
erated in response to de?ection of a pill by the impact transducer 80. The analysis routine is commenced (step 400) by rotating (405) a feeder within the drop tube apparatus 30, which results in impact of a pill upon the transducer 80. This impact is detected by monitoring (step 401 ) the electrical output of the transducer 80 in
the manner shown in FIG. 6. As shown in FIG. 6, im pact is deemed to occur (410) at time t1 when the electri cal output of the transducer 80 rises to a value of
(1-'|-x)V0, where V0 corresponds to the quiescent trans
ducer output signal and the default value of x is 0.1. The
feeder disk 160 is then stopped (step 415), and the im
pact signal is digitized by the interface card 380 (FIG. 4)
at a 1 MHz sampling rate (step 420). The initial 1024
samples of the impact signal are then transferred (step 425) from the interface card 380 to the microcomputer. A largest sample value (V max) is then identi?ed, and a
group of ten sample values centered about the largest
value (e.g., the four samples preceding Vmax and the
?ve subsequent samples) are then avenged in order to determine a peak value proportional to pill mass (step 430). The mass of each pill may be determined by insert
ing (step 435) the peak value of the impact signal associ
ated therewith into an empirical relationship stored
within the microcomputer. Speci?cally, an empirical
linear equation relating pill mass to peak impact signal magnitude may be formulated by dropping pills of
known mass through the drop tube 70 and recording the
magnitude of the impact signal corresponding to each.
Again referring to FIG. 6, it has been found that pill hardness is related to the spread of the impact signal
10 35 40 45 65
8
proximate the peak region. This spread corresponds to
the time (t2—t1) separating the two points at which the
impact signal value is equal to (l +x)V0. However,
since the spread of the impact signal is correlated with
mass, hardness may not be uniquely determined solely on the basis of the time differential t2—t1. Fortunately,
it has also been determined that the slope of the impact signal proximate time t; is proportional to hardness and independent of pill mass. The slope at time h may be
found (step 440) by approximating a straight line, here
inafter referred to as the hardness line, based on a set of
values of the impact signal between Vrnax and the im
pact signal value of 1.1V0 at time t2. A line-?tting rou tine such as that described by Press, et al. in Numerical
Recipes-The art of Scientific Computing, pp. 504-505
may be used to ?t this set of values of the impact signal
in a minimum sum-of-squares error sense ‘to a straight
line corresponding to the hardness line (step 445). As mentioned in the Background of the Invention,
the hardness of pharmaceutical products is generally
measured destructively by subjecting the product to an increasing force until rupture occurs. Accordingly, product hardness (i.e., “destructive.” hardness) is often
speci?ed in terms of the force required to cause such
rupture. The present invention advantageously pro
vides a non-destructive technique for determining the
hardness associated with a given pill using the hardness
line. The hardness line may also be used to detect flaws
in the internal structure of the pill. Speci?cally, it has
been found that the minimum sum-of-squares error be tween the set of signal values used to calculate the hard ness line and the hardness line itself is larger for pills
that are broken, shrivelled, or of poor shape than for
nondefective pills. It follows that a user-de?ned quality ‘
determination based on any desired combination of pill
mass, hardness and internal structure may'be made on
the basis of the time-domain analysis of the impact sig nal (step 450). For example, all pills below a certain
mass, or those characterized by a sum-of-squares error
larger than a prede?ned threshold, may be classi?ed as
unacceptable. The determination of pill quality based
on such a set of user-defined criteria concludes the
impact signal analysis routine (step 455).
Digital Image Analysis:
Referring to FIG. 7, the first step (step 515) in the imaging analysis routine involves detecting the entrance
of a pill into the ?eld of view of the imaging device 40.
Since the path taken by pills falling from the trough 90
into the holding bin 100 may be controlled by varying
the angle of the trough 90, a search window within the
center of the digital representation generated by the
imaging device 40 may be monitored to detect the pres
ence of pills. Speci?cally, FIG. 8 depicts a simpli?ed illustration of a digital image representation of the ?eld
of view F of the imaging device 40, in which is included a pill L and upon which is superimposed a dashed line
indicative of the location of a search window W and a
dotted line showing the path P of pill L. A background reference is calculated for each search operation by averaging the values of ?rst and second reference pixels R1 and R2 located proximate the periphery of the field
of view F. When the average value of the approxi
mately forty pixel elements within the search window
W differs by a predetermined threshold from the back ground reference, a pill is deemed to exist within the
window W. The microcomputer then sets a flag (step
520) to trigger the edge detection operation (FIG. 7). If
5,422,831
9 .
search operation is repeated until a pill is located (steps
525,530, 532 and 534). That is, the pill is rejected (532)
if an edge is not detected after two or more attempts
(530).
FIG. 9 is a ?ow chart summarizing the manner in
which the edge of the pill L is distinguished from the
background of the digital image representation. In par
ticular, the pixel elements located on a vertical line
originating at the upper periphery of the ?eld of view F
(FIG. 8) proximate reference pixel R1 are sequentially compared (steps 535 and 540) against the background
reference. A ?rst point on the edge of the pill L is con—
sidered to have been located (step 545) when the value
of a pixel on this vertical line exceeds the background pixel value by a predetermined amount. If the lower
boundary of the ?eld of view is reached (step 550) be fore ?nding a suitably bright pixel, the program pauses
and then makes a second attempt to ?nd the pill edge. If the pill edge is not found after a second attempt
(555), control is transferred to the imaging analysis program (592).
Once a ?rst pixel point on the edge of the pill has been
located, a boundary search operation is commenced (step 560). During the boundary search process a set of
pixel locations located on the boundary of the pill are
accumulated (step 565), thereby allowing the shape of
the pill to be determined (FIG. 7, step 568). The bound
ary search operation proceeds in a counterclockwise ' manner around the edge of the pill, and involves ?nding
the most likely direction of the next boundary pixel relative to the position of the boundary pixel last lo
cated. Speci?cally, FIG. 10 illustratively represents a set of eight direction vectors used in the boundary
search operation. Since the search proceeds counter clockwise, after the ?rst edge pixel has been found the
value of a test pixel located left (i.e., in direction 2) of
the ?rst edge pixel by a search radius is compared with
a reference value equal to the value of the ?rst pixel less a prede?ned number of intensity units. If the value of the test pixel exceeds the background value it is deemed
to be the second edge pixel. If the value of the test pixel
is‘not suf?ciently large relative to the reference, a sec
ond test pixel is identi?ed by ?nding the pixel located in
direction 3 relative to the ?rst pixel, and separated
therefrom by a distance approximately equivalent to the
search radius. This process is repeated for test pixels at
direction vectors 4, 5, 6, . . . , etc. until a suitably bright
test pixel is found. The search process may be expedited
by altering the direction vector initially searched after accumulation of each edge pixel. For example, if the
most recent edge pixel found is located in direction 4
relative to the previous edge pixel, direction 3 will ?rst be searched in attempting to locate the next 'edge pixel.
In this way the search process “remembers” the relative location of the previous edge pixel and thus more effi
ciently tracks the pill perimeter.
The boundary search operation results in the accumu
lation (step 570) of a set of pixels which approximate the pill boundary. The accuracy of the approximation may
be increased by reducing the search radius, but such a reduction tends to lengthen the duration of the search process since more boundary points are accumulated.
The process terminates when an edge pixel is found
within an area of prede?ned size (e. g., a 4X4 pixel area)
relative to the ?rst edge pixel (steps 575 and 580). Alter
- natively, the process is aborted (steps 585, 590 and 592) if greater than a maximum number, typically on the
order of one-thousand, of edge pixels are accumulated
O 5 30 35 40
10
without satisfying the termination criteria mentioned
above.
Next, the location of the center of the pill is calcu
lated (step 595) using the accumulated set of boundary pixels. This calculation may be performed, for example,
for a round pill by finding a diameter corresponding to '
the line between the most widely separated pixel loca tions. The location of the pill center may be approxi mated by ?nding the midpoint on this line. After the pill
center has been determined, control is transferred back
to the imaging analysis program (592).
FIG. 11 depicts the manner in which the shape and
surface texture (roughness) of each pill may be calcu- '
lated using the accumulated set of boundary pixels and the location of the center of the pill. Speci?cally, the boundary de?ned by the accumulated set of edge pixels is divided into three-hundred sixty parts (6=0 to 359 degrees) and the distance “di”, i=0 to 359, from the
center to each is then calculated. The distance di may
then be plotted as a function of the angle 0 as shown by the edge data curve D in FIG. 11. The plot correspond ing to a reference ellipse R is superimposed over the
curve D by aligning the data point corresponding to the major axis of the reference ellipse with the ?rst peak in
the edge data curve D.
The roughness of the pill may be estimated (see FIG. 7, steps 600 and 605) by computing the variance be tween the edge data point di and its neighborhood di+l
over 0:0, 1, 2, . . . , 359 degrees. Referring to FIG. 11,
roughness may be quanti?ed as 2(di——di+ 1)2/ 360,
where “i” ranges from 0 to 359. A user may indicate
tolerance for roughness by specifying the maximum
variance between the curves D and R to be exhibited by accepted pills. Similarly, an estimate of the extent to
which the shape of the pill agrees with the reference
ellipse R may be obtained by ?nding the error a be tween the reference ellipse R and the edge data curve D. Again with reference to FIG. 11, shape error may be quanti?ed as 2071/ 360, where “i” ranges from O to 359. Again, a user may specify the maximum value of shape
. error to be associated with pills of acceptable quality.
45
55
60
Finally, an indication of pill roundness may be obtained
by ?nding the ratio of the minor axis to the major axis. The program then terminates (534) after all analysis results have been stored (605).
FIG. 12 depicts the manner in which the texture, area
and color of the surface of each pill may be calculated using a pixel-by-pixel comparison and area normaliza
tion. Upon completion of the edge detection routine, a
display graphics subroutine is called which superim
poses a solid boundary over the set of boundary points.
In addition, a calculation box is generated so as to en
close the solid boundary as indicated in FIG. 12. As is discussed below with reference to FIG. 13, a texture
analysis program processes pixels from the upper left
corner of the calculation box, proceeding from left to
?ght and from top to bottom (see, e.g., steps 620, 625, 650, 655, 660, 665 and 670). The texture analysis pro gram concludes (670) subsequent to processing of the
bottom, rightmost pixel.
FIG. 13 is a ?ow chart depicting implementation of a
texture analysis and color determination program (610).
Beginning in the upper left comer (steps 615 and 620) of
the calculation box (FIG. 12), the difference in intensity
between each pixel and its neighbor to the ?ght is accu
mulated to produce an aggregate texture error. The
5,422,831
11
surface area of the pill, wherein the surface area is deter
mined by counting the number of pixels included within
the pill boundary (FIG. 12). The normalized texture
error relates to the prevalence of surface defects (e.g.,
labelling defects).
A determination of pill color may be made when the imaging system 40 is implemented with a set of three data buffers disposed to respectively store the red,
green and blue intensity of each pixel element. The
aggregate intensity in each buffer may then be divided
by the surface area of the pill in order to obtain a nor
malized intensity.
In the preferred embodiment acceptable pill quality is
10
12
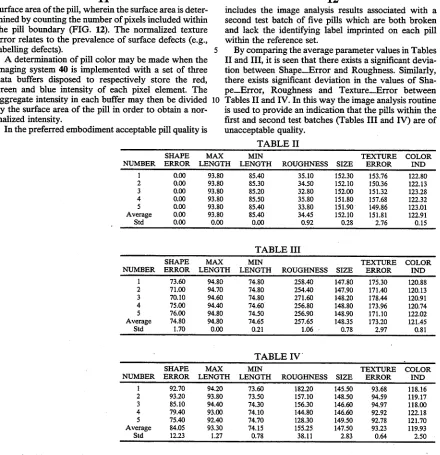
includes the image analysis results associated with a second test batch of ?ve pills which are both broken
and lack the identifying label imprinted on each pill
within the reference set.
By comparing the average parameter values in Tables
II and III, it is seen that there exists a signi?cant devia~
tion between Shape_Error and Roughness. Similarly,
there exists signi?cant deviation in the values of Sha
[image:21.557.61.501.80.535.2]pe_.Error, Roughness and Texture__Error between
Tables II and IV. In this way the image analysis routine is used to provide an indication that the pills within the ?rst and second test batches (Tables III and IV) are of
unacceptable quality.
TABLE II
SHAPE MAX MIN TEXTURE COLOR
NUMBER ERROR LENGTH LENGTH ROUGHNESS SIZE ERROR IND 1 0.00 93.80 85.40 35.10 152.30 153.76 122.80 2 0.00 93.80 85.30 34.50 152.10 150.36 122.13 3 0.00 93.80 85.20 32.80 152.00 151.32 123.28 4 0.00 93.80 85.50 35.80 151.80 157.68 122.32
5 0.00 93.80 85.40 33.80 151.90 ’ 149.86 123.01
Average 0.00 93.80 85.40 34.45 152.10 151.81 122.91
Std 0.00 0.00 0.00 0.92 0.28 2.76 0.15
TABLE III
SHAPE MAX MIN TEXTURE COLOR
NUMBER ERROR LENGTH LENGTH ROUGHNESS SIZE ERROR IND 1 73.60 94.80 74.80 258.40 147.80 175.30 120.88 2 71.00 94.70 74.80 254.40 147.90 171.40 120.13 3 70.10 94.60 74.80 271.60 148.20 178.44 120.91 4 75.00 94.40 74.60 256.80 148.80 173.96 120.74 5 76.00 94.80 74.50 256.90 148.90 171.10 122.02 Average 74.80 94.80 74.65 257.65 148.35 173.20 121.45
Std 1.70 0.00 0.21 1.06 - 0.78 2.97 0.81
TABLE IV ' _
SHAPE MAX MIN TEXTURE COLOR
NUMBER ERROR LENGTH LENGTH ROUGHNESS SIZE ERROR IND 1 92.70 94.20 73.60 182.20 145.50 93.68 118.16
2 93.20 93.80 73.50 157.10 148.50 94.59 119.17
3 85.10 94.40 74.30 156.30 146.60 94.97 118.00 4 79.40 93.00 74.10 144.80 146.60 92.92 122.18 5 75.40 92.40 74.70 128.30 149.50 92.78 121.70 Average 84.05 93.30 74.15 155.25 147.50 93.23 119.93
Std 12.23 1.27 0.78 38.11 2.83 2.50
determined by comparing the measurements associated
with a given pill’s shape (i.e., maximum length, mini
mum length and shape error), roughness, size, texture
and color with a corresponding set of reference parame
ters. Speci?cally, the reference parameters Max
_Length, Min_Length, Roughness, Size, Texture_Er
ror, are determined by utilizing the image analysis pro
gram to determine average values of the aforemen tioned parameters for a reference set of acceptable qual
ity (i.e., nondefective) pills. It is anticipated that the
reference set will be comprised of ?ve or more good
quality pills. Deviation of the measurements associated
with a pill under test more than a user-speci?ed amount
from the reference parameters indicates the test pill is,
for example, broken, missing a label, or otherwise struc
turally defective. Table 11 below includes the image
analysis results associated with a reference set of ?ve
acceptable quality pills. The corresponding reference
parameters are speci?ed in the row denoted as “Aver
age”. In Table III there is compiled the image analysis
results for a ?rst test batch of ?ve broken pills. Again, the average value of each measured parameter is set forth in the row labelled average. Similarly, Table IV
50
65
0.64
Referring to FIG. 3, pills are routed by rejection device
50 into the accepted and rejected bins 120 and 130 on the basis of the quality determinations made in regard to
the impact signal and imaging analysis routines. If either
analysis routine indicates that a pill is of unacceptable quality, the pill is deposited in rejected pill bin 130. It is
emphasized, however, that a user may specify the extent to which each measured physical parameter contributes to the overall quality assessment made by each analysis
routine.
While the present invention has been described with
reference to a few speci?c embodiments, the descrip
tion is illustrative of the invention and is not to be con
strued as limiting the invention. Various modi?cations
may occur to those skilled in the art without departing
from the true spirit and scope of the invention as de?ned
by the appended claims. For example, the teachings of
the present invention may also be applied to various
other edible products such as vitamin pills and tablets,
5,422,831
13
1. An apparatus for determining quality of a pharma ceutical product of a prede?ned type, comprising:
impact transducer means for generating a transducer signal indicative of a set of physical characteristics
representative of composition of said product;
imaging means for synthesizing a digital image repre~
sentation of physical appearance of said product;
and
signal processing means for analyzing said transducer signal and said digital image representation in ac
cordance with a transducer impact signal routine
and an image analysis routine respectively;
whereby, based on results of said transducer impact
signal and image analysis routines, a degree of qual
ity is associated with said pharmaceutical product.
2. The apparatus of claim 1 wherein said prede?ned
type is included within the set consisting of pharmaceu
tical pills, pharmaceutical tablets, and pharmaceutical
capsules.
3. The apparatus of claim 1 wherein said acoustical
transducer means further includes a drop tube feeder
apparatus for dropping said pharmaceutical product
upon said transducer.
4. The apparatus of claim 3 wherein said imaging
means includes camera means for providing an image of
said pharmaceutical product and for digitizing said
image so as to create said digital image representation. 5. The apparatus of claim 1 wherein said physical
characteristics include mass and hardness.
6. The apparatus of claim 5 wherein said digital image
representation includes information pertaining to shape and boundary roughness of said pharmaceutical prod
uct. _
7. The apparatus of claim 6 wherein said signal pro cessing means includes means for determining said
shape ‘of said pharmaceutical product based on said
digital image representation, said shape determining
means including means for identifying a portion of said
digital image representation as corresponding to an edge of said pharmaceutical product and means for
determining a center of said product relative to said
edge.
8. The apparatus of claim 7 wherein said signal pro
cessing means includes means for determining rough
ness of said pharmaceutical product by plotting separa tion between prede?ned sections of said edge and said
center and comparing said plot with a reference plot. 9. The apparatus of claim 5 wherein said acoustical transducer means includes an impact transducer, said
transducer signal being generated in response to impact of said pharmaceutical product upon said transducer.
10. The apparatus of claim 9 wherein said signal pro
cessing means includes means for performing a time
domain analysis of said transducer signal.
11. The apparatus of claim 10 wherein said time
domain analysis means includes means for detecting a
peak region of said transducer signal, wherein magni
tude of said transducer signal at said peak region corre
sponds to said mass of said pharmaceutical product.
12. The apparatus of claim 11 wherein a slope of said peak signal at a prede?ned magnitude thereof corre
sponds to said hardness of said pharmaceutical product.
20 25 30 35 40 45 65
14
13. A method for determining quality of a pharma
ceutical product of a prede?ned type comprising the steps of:
dropping said product upon an impact transducer,
said transducer being disposed to generate a trans
ducer signal indicative of a set of physical charac
teristics representative of composition of said prod
uct;
creating an image of said product;
digitizing said image and creating a digital image representation of said product;
storing said digital image representation in computer
memory;
analyzing said transducer signal and digital image
representation in accordance with a transducer
impact signal routine and an image analysis routine
respectively;
whereby, based on results of said transducer impact
signal and image analysis routines, a degree of qual ity is associated with said pharmaceutical product.
14. The method of claim 13 wherein said digital
image representation includes information pertaining to
at least one characteristic included within the set of
product characteristics consisting of surface texture,
area and color.
15. The method of claim 13 wherein said step of ana
lyzing includes the step of determining said shape of said pharmaceutical product based on said digital image
representation, said shape determining step including
the steps of:
identifying a portion of said digital image representa
tion as corresponding to an edge of said pharma
ceutical product, and
determining a center of said product relative to said
edge.
16. The method of claim 15 wherein said step of ana
lyzing includes the step of determining boundary
roughness of said pharmaceutical product by plotting
separation between prede?ned sections of said edge and
said center and comparing said plot with a reference
plot.
17. The method of claim 16 wherein said prede?ned
type is included within the set consisting of pharmaceu
tical pills, pharmaceutical tablets and pharmaceutical
capsules.
18. The method of claim 13 wherein said physical
characteristics include mass and hardness.
19. The method of claim 18 wherein said digital
image representation includes information pertaining to shape and boundary roughness of said pharmaceutical
product.
20. The method of claim 19 wherein said step of ana
lyzing includes the step of performing a time-domain analysis upon said transducer signal.
21. The method of claim 20 wherein said time-domain
analysis step includes the step of detecting a peak region of said transducer signal, wherein magnitude of said transducer signal at said peak region corresponds to said mass of said pharmaceutical product.
22. The method of claim 21 wherein said time-domain
analysis step includes the step of determining the slope
of said transducer signal at a predefined magnitude
thereof wherein said slope corresponds to said hardness
of said pharmaceutical product.