143
Stamina of a non-gasketed flange joint under
combined internal pressure and axial loading
M Abid1∗, A W Awan1,andD H Nash2
1Faculty of Mechanical Engineering, Ghulam Ishaq Khan Institute of Engineering Sciences and Technology, Topi, NWFP, Pakistan
2Department of Mechanical Engineering, University of Strathclyde, Glasgow, UK
The manuscript was received on 14 February 2008 and was accepted after revision for publication on 2 June 2008.
DOI: 10.1243/09544089JPME212
Abstract: The performance of a bolted flange joint is characterized mainly by its ‘strength’ and ‘sealing capability’. A number of numerical and experimental studies have been conducted to study these characteristics under internal pressure loading conditions alone. However, limited work is found in the literature under conditions of combined internal pressure and axial loading. The effect of external, axial loading pressure being unknown, the optimal performance of the bolted flange joint cannot be achieved. Current design codes do not address the effects of axial loading on structural integrity and sealing ability. To study joint strength and sealing capability under combined loading conditions, an extensive experimental and numerical study of a non-gasketed flange joint was carried out. Actual joint load capacity was determined at both design and test stages with the maximum external axial loading that can be applied for safe joint perfor-mance. Experimental and numerical results have been compared and overall joint performance and behaviour is discussed in detail.
Keywords: non-gasketed, combined, bolt-up, operating, axial, sealing, strength
1 INTRODUCTION
Different types of flange joints evolved over the centuries and were used at a low pressure and kept in room temperatures. However, pressure, high-temperature, and different external loading applica-tions led to sealing problems. Leakages (small and large) in flange joints is a perennial safety concern for human lives, environmental effect, and cost. With rapid technological advances in pressure, high-temperature, and external loading applications, trends are changing. A flange joint must have adequate mechanical strength and good leak tightness, there-fore it is important to evaluate integrity and sealing performance in actual operating conditions. Avail-able design rules [1, 2] for flange joints are mainly concerned with the strength of flanges and do not sufficiently consider their sealing. In addition, they do not address the effect of any external loading
on integrity and sealing performance. Non-gasketed flange joints are considered as an alternative to the ‘static mode of load’ under bolt-up and internal pres-sure applications, [3–8] and bolt-up and different temperature loading conditions [9,10] and its better joint strength and sealing capabilities. External load-ing on bolted flange joints have been discussed [11,12] but these studies are for gasketed flange joints and bending loading.
2 ALLOWABLE STRESSES AND FLANGE JOINT CONFIGURATION
Allowable stresses and material properties for flange, pipe, and bolt and symmetry plate are given in Table 1. The material properties for the flange is as per ASTM A105 [13] and for the bolt and washer as per ISO898, class 8.8 [14]. Bilinear kinematic hardening for elasto-plastic material properties is used during the analysis. A bilinear material model consists of two sections each having a linear gradient. In the elastic region up to the yield stress the gradient of the stress–strain curve is Young’s modulus of elasticity. Beyond the yield stress, the gradient (plastic modulus) is 10 per cent [4, 15] of Young’s modulus. The flange dimensions are: thickness 30 mm, taper angle=0.03◦
, number of bolts=16, and bolt diameter 10 mm. A flange joint
equivalent to 4 nominal bore of 900# class is used in the present study.
3 FINITE-ELEMENT MODELLING
[image:2.595.43.490.445.731.2]In the present work, a detailed three-dimensional parametric finite element (FE) model developed in reference [9] is used, as it eliminates the need for simplifications, such as removing the effects
Table 1 Material properties
Non-gasketed joint E(MPa) υ Allowable stress (MPa)
Flange/pipe 203 395 0.3 248.2 (2/3rdσy) Bolt (ISO 898, 204 000 0.3 640
class 8.8)
Washer 204 000 0.3 640
associated with the bolt hole. Fully parametric mod-els are used throughout the study, so that the time involved in building scaled models of different geometries could be minimized. An angular portion (11.25◦
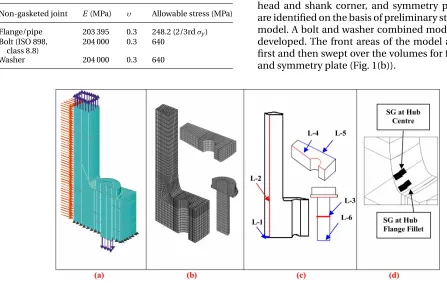
rotation of main profile or 1/32 part) of the flange is modelled based on symmetry with a bolt hole at the required location. The second flange is replaced by a symmetry plate. The resulting flange joint model with its boundary conditions is shown in Fig. 1(a). ANSYS [16] software was used for FEA analysis.
3.1 Element selection and mesh
As stresses in flange, bolt, washer, and symmetry plate are the required outputs, two classes of elements are used.
Solid structural elements. Solid structural elements (SOLID45) are used for structural stress analysis of the flange joint.
Contact elements. Contact elements are used to model the contact between different surfaces of the joint. Three-dimensional surface-to-surface CONTA173 elements, in combination with TARGE170 target elements, are used to simulate contact distribu-tion between the bottom face of the flange and the symmetry plate, and the top of the flange and the bottom of the washers.
Mesh. Mapped meshing is used in the regions of high-stress distribution i.e. flange fillet, bolt-hole, bolt head and shank corner, and symmetry plate, which are identified on the basis of preliminary studies of the model. A bolt and washer combined model has been developed. The front areas of the model are meshed first and then swept over the volumes for flange, bolt, and symmetry plate (Fig. 1(b)).
3.2 Boundary conditions
Internal pressure is applied at inside diameter of pipe and flange, and loading due to the head and additional axial loading is directly applied as nodal forces across the wall of the pipe.
The flanges are free to move in either axial or radial direction, providing flange rotation and permitting the observation of the exact nature of stress in flange, bolt, and symmetry plate. The symmetry plate is con-strained in the axial direction (y-direction) only, and is free to move either in radial or tangential direc-tion. The bolt is constrained along the centre nodes at the bottom surface in x- and z-directions and is free to elongate in they-direction. Contact is defined between the top face of the flange ring and the bot-tom of the bolt head, botbot-tom of the flange ring and top of the symmetry plate. This makes the problem com-plex. Contact analysis is also non-linear analysis due to non-linear behaviour, such as penetration and contact generation. In addition, in the present study, a non-linear material model was used in order to simulate the realistic behaviour of the flange joint components. All these factors make the analysis non-linear. The first non-linear solution step is the contact initiation, the second and third steps occur in the non-linear material model. During the test, each load step was further divided into a number of small substeps, rang-ing from 10 to 1000. The boundary conditions applied are shown in Fig. 1(a). For a complete understanding of the loading applied, the following multi-load step procedure was used.
Step 1: Contact initiation.Contact between flange top surface and washer bottom was defined by giving a small initial displacement of UY= −0.0025 mm in the
axial direction to the bolt-bottom surface.
Step 2: Pre-stress application.A second value of UY= −0.156 mm was applied to bolt’s bottom surface, to
achieve an initial pre-stress value of 474 MPa in the bolt (which is 74 per cent of the yield stress of the bolt mate-rial) although the recommended value is 80 per cent of the yield stress [3–9].
Step 3: Internal pressure application.After pre-stress application, the design pressure of 15.3 MPa and proof test pressure of 23 MPa was applied separately for the two different cases. End-cap loading (21.48
and 32.29 MPa in design and proof test pressures, respectively, due to internal pressure) was applied to the end of the pipe, a suitable distance away from the joint [3–9].
Step 4: Internal pressure plus axial load application.
An axial load ranging from 100 to 640 kN (23.33– 149.4 MPa) was applied in addition to the design pressure of 15.3 MPa and proof test pressure of 23 MPa. Both the cases were analysed to further investigate the joint behaviour.
4 FE MODEL VERIFICATION
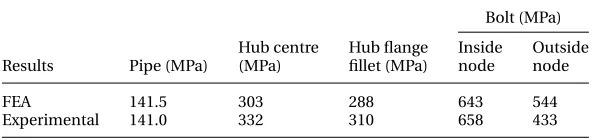
The FE model is verified mathematically at the pipe location. Whereas the FE model is verified with the experimental results at the pipe, hub centre, hub-flange fillet, and bolt under the applied axial loading only (Table 2). Results are compared and are found in good agreement with an axial loading of 664 kN. The Three-dimensional FE model has already been verified by Abidet al. [9] under internal pressure loading only. Lame’s theory is used at the pipe section, as the pipe used falls in the category of thick-walled cylinders [17].
5 FE RESULTS DISCUSSION
Stress and displacement results at the gauge location at pipe, hub centre, hub-flange fillet, maximum at hub, bolt-hole region, bolt (at gauge location and maxi-mum anywhere), and symmetry plate under only axial loading and combined internal pressures plus axial loading are discussed. Graphically plotted results at various locations of the joint components are as given in Fig. 1(c). The hub region is shown in Fig. 1(d).
5.1 Stress variation in pipe and flange
5.1.1 Stress intensity and axial stress in pipe
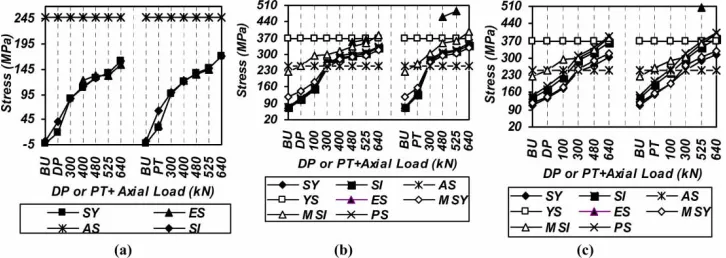
[image:3.595.157.453.689.759.2]Stress intensity and axial stress are found to be within the allowable stress values at all loading conditions i.e. internal pressure (design and proof test) plus axial loading ranging from 100 to 640 kN. FEA results are also found in good agreement with the experimental results (Fig. 2(a)).
Table 2 FE model verification: FEA versus experimental results Bolt (MPa)
Hub centre Hub flange Inside Outside Results Pipe (MPa) (MPa) fillet (MPa) node node
FEA 141.5 303 288 643 544
Fig. 2 SY and SI variation (FEA and experimental) at (a) pipe, (b) hub centre, and (c) hub flange fillet
5.1.2 Stress intensity in flange
At bolt-up plus internal pressure. Stresses (SY and SI) are measured numerically and experimentally at the hub centre (Fig. 2(b)) and hub flange fillet. The maximum SI observed at the hub-flange fillet at design pressure was close to the allowable stress and was slightly higher (261 MPa) at proof test pres-sure. However, the maximum stress intensity was much less than the yield stress of the flange material (Fig. 2(c)).
At design pressure plus axial loading. The maxi-mum SI observed at the hub-flange fillet increased to 294 MPa at design pressure and at an additional axial load of 100 kN. SI further increased linearly up to 381 MPa at 640 kN (Fig. 2(c)). Based on the design/failure criteria at allowable stress for opti-mized joint strength, the flange is safe at design pressure; hence the joint should be used up to the design pressure for some optimized additional axial loading.
At proof test pressure plus axial loading.The maxi-mum SI at the hub-flange fillet increased to 291 MPa at the proof test pressure and at an additional axial load of 100 kN. The SI further increased linearly to 396 MPa at an axial load of 640 kN. Based on the design/failure criteria at the stress allowable for opti-mized joint strength, the flange was observed to be fail even at proof test pressure; hence, the joint should be used up to the design pressure for some optimized additional axial loading (Fig. 2(c)).
5.1.3 Bending stress (SY)
Two strain gauges were bonded at each location i.e. in the axial and hoop directions. Stresses calcu-lated from experimental strains recorded at various strain-gauge locations during bolt-up and operat-ing conditions were converted to principal stresses both in the axial and hoop directions using the expressions given in equations (1) and (2). FEA axial stresses are compared with the experimental stress
results at strain-gauge locations.
σ1= E
1−ν2(ε1+νε2) (1)
σ2= E
1−ν2(ε2+νε1) (2)
The FEA results under different conditions are given below. The experimental setup, procedure, and results are discussed in section 6.
At bolt-up plus internal pressure. At bolt-up, the maximum SY of 117 MPa increased to 144 and 158 MPa at design and proof test pressure, respectively, and is observed to be within the allowable stress of the flange material (Figs 2(b) and (c) and 3(a) and 3(d)).
At design pressure plus axial loading. The maxi-mum SY increased from 144 MPa at design pressure to 183 MPa and then almost linearly to 318 MPa at 640 kN. The maximum SY exceeds the allowable stress limit at 300 kN (Figs 2(b) and (c) and 3(b) and (c)).
At proof test pressure plus axial loading. The maxi-mum SY increased from 158 MPa at proof test pressure and then almost linearly to 331 MPa at 640 kN. The maximum SY exceeded the allowable stress limit at 300 kN (Figs 2(b) and (c) and 3(e) and (f )).
5.1.4 Experimental versus FEA (design pressure plus axial loading )
At hub centre. The principal experimental stresses, 352 and 365 MPa at 480 and 525 kN, respectively, in addition to the design pressure were slightly more than the FEA principal stresses, 303 and 311 MPa, and axial stress, 289 and 296 MPa, respectively, close to the gauge location. This was due to the difference in the applied bolt-up, gauge location, and FEA measured results. The axial stress was found to be within the allowable stress up to 300 kN and then exceeded at 400 kN, whereas principal stress exceeded allowable stress at 300 kN (Fig. 2(b))(Tables 3 and 4).
[image:4.595.110.473.82.211.2]Fig. 3 SY in flange at (a) DP, (b) DP+300 kN, (c) DP+640 kN, (d) PT, (e) PT+300 kN, and
[image:5.595.80.533.79.270.2](f ) PT+640 KN
Table 3 Stress variation (FEA and experimental) at hub centre at DP plus axial loading BU DP +100 kN +200 kN +300 kN +400 kN +480 kN +525 kN +640 kN
SY 68.4 105 147 188 238 278 289 296 317
SI 71.9 109 152 194 264 287 297 304 327
AS 248 248 248 248 248 248 248 248 248
YS 370 370 370 370 370 370 370 370 370
ES 352 365
MSY 117.2 144 183 216 253 279 289 296 318
MSI 226 249 294 290 298 316 334 347 381
PS 73.8 112 156 199 252 293 303 311 334
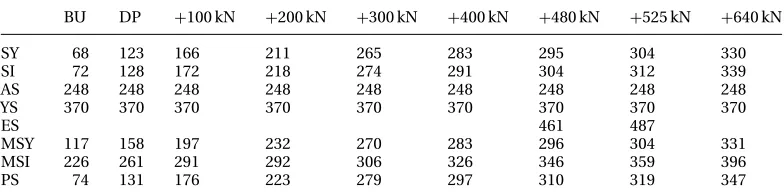
Table 4 Stress variation (FEA and experimental) at hub centre at PT plus axial loading BU DP +100 kN +200 kN +300 kN +400 kN +480 kN +525 kN +640 kN
SY 68 123 166 211 265 283 295 304 330
SI 72 128 172 218 274 291 304 312 339
AS 248 248 248 248 248 248 248 248 248
YS 370 370 370 370 370 370 370 370 370
ES 461 487
MSY 117 158 197 232 270 283 296 304 331
MSI 226 261 291 292 306 326 346 359 396
PS 74 131 176 223 279 297 310 319 347
345 MPa and greater than axial stress of 269 MPa close to the gauge location. Axial stress was found to be within the allowable stress up to 300 kN, but exceeded at 400 kN, whereas the principal stress exceeded at about 120 kN in addition to the design pressure (Fig. 2(c)) (Tables 5 and 6).
5.1.5 Experimental versus FEA (proof test pressure plus axial loading )
At hub centre. The principal experimental stresses, 462 and 487 MPa at 480 and 525 kN, respectively, in addi-tion to the proof test pressure were more than the FEA principal stresses 310 and 319 MPa, and axial stress.
295 and 306 MPa, respectively, close to the gauge loca-tion. These were due to the difference in pressure at bolt-up, larger gauge length, and some difference in gauge location and results measured by FEA. The axial stress was found within the allowable stress up to 300 kN and then exceeded it at 400 kN, whereas princi-pal stress exceeded allowed stress at 300 kN (Fig. 2(b)) (Tables 3 and 4).
[image:5.595.104.505.331.430.2] [image:5.595.109.501.464.562.2]Table 5 Stress variation (FEA and experimental) at hub-flange fillet at DP plus axial loading BU DP +100 kN +200 kN +300 kN +400 kN +480 kN +525 kN +640 kN
SY 107 137 179 216 243 256 269 278 303
SI 139 173 223 267 289 306 322 333 363
AS 248 248 248 248 248 248 248 248 248
YS 370 370 370 370 370 370 370 370 370
ES 297
MSY 117 144 183 216 253 279 289 296 318
MSI 226 249 294 290 298 316 334 347 381
PS 149 185 238 284 311 327 345 356 389
Table 6 Stress variation (FEA and experimental) at hub-flange fillet at PT plus axial loading BU DP +100 kN +200 kN +300 kN +400 kN +480 kN +525 kN +640 kN
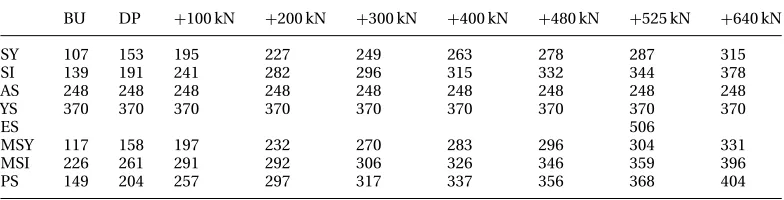
SY 107 153 195 227 249 263 278 287 315
SI 139 191 241 282 296 315 332 344 378
AS 248 248 248 248 248 248 248 248 248
YS 370 370 370 370 370 370 370 370 370
ES 506
MSY 117 158 197 232 270 283 296 304 331
MSI 226 261 291 292 306 326 346 359 396
PS 149 204 257 297 317 337 356 368 404
FEA measured results. Axial stress was found to be within the allowable stress up to 300 kN, whereas prin-cipal stress exceeded allowed stress at about 100 kN (Fig. 2(c)) (Tables 5 and 6).
From the preceding discussion, it can be concluded that the maximum SY at an axial load of 640 kN was 318 and 303 MPa at design pressure plus axial loading, and 331 and 315 MPa at proof test pressure plus axial loading along the hub centre and hub-flange fillet, respectively. The SY observed was less than the yield stress of the flange material. Similarly, the principal stress was 334 and 389 MPa at design pressure plus axial loading, and 347 and 404 MPa at proof test pressure plus axial loading at the hub cen-tre and hub-flange fillet, respectively. Results shows that at 640 kN the hub flange fillet yields. Based on the design/failure criteria at allowable stress for opti-mized joint strength, maximum axial load may be limited to 100 and 120 kN at design pressure plus axial loading and proof test pressure plus axial load-ing, respectively. However, if the design/failure criteria are yield stress limits, then the maximum axial load applied can be up to about 600 and 580 kN for the optimized performance at design pressure plus axial loading and at proof test pressure plus axial loading, respectively.
5.1.6 FEA results of contact stress (SY) at bolt hole
A good full-face contact was observed between the top surface of the flange under the bolt head. At bolt-up, the SY observed was of 299 MPa. Similarly, contact stress observed during internal pressures was 297 and 298 MPa at design and proof test pressure,
respectively. At combined design pressure and addi-tional axial loading of 100–640 kN, it increased from 303 to 330 MPa. At combined proof test pressure and additional axial loading of 100–640 kN, it increased from 303 to 335 MPa. SY found even at bolt-up was higher than allowable stress. However, this localized stress should not be considered as flange failure, as the flange ring has a reasonable thickness. In fact, these stresses arise from the high initial preload applied in the bolts and are always recommended for the non-gasketed joints (Fig. 3(a) to (f )).
5.2 Stress variation in bolts
5.2.1 FEA results of stress intensity (SI)
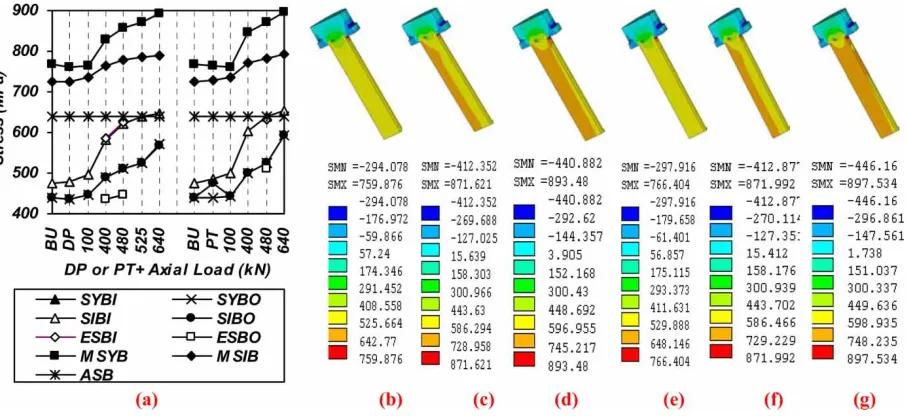
At bolt-up plus internal pressure. The maximum SI of 725 MPa during bolt-up, remained unchanged at design pressure, but increased slightly to 730 MPa under proof test pressure. Close to the gauge loca-tion, SI at the inside and outside nodes was 474 and 440 MPa, respectively, at bolt-up. It increased to 480 and 486 MPa at the inside node and 438 and 474 MPa at the outside node at design and proof test pressure, respectively (Fig. 4(a)).
[image:6.595.95.487.227.327.2]Fig. 4 (a) Stress variation at DP and PT and axial loading at gauge location; FEA versus experimental results, axial stress in bolt at (b) DP, (c) DP+525 kN, (d) DP+640 kN, (e) PT, (f ) PT+480, and
(g) PT+640
axial load of 525 kN in addition to the design pressure (Fig. 4(a)).
At proof test pressure plus axial loading. The maxi-mum SI increased linearly from 736 MPa to 792 MPa at an additional axial load of 100–640 kN. Maxi-mum SI remained more than the allowable stress limit at all loading conditions. Close to the gauge location, SI at inside and outside nodes increased from 500 MPa to 652 MPa and 444 MPa–594 MPa at an additional axial load of 100–640 kN. SI (641 MPa) exceeded the allowable stress limit at an axial load of 480 kN in addition to the proof test pressure (Fig. 4(a)).
5.2.2 FEA results of axial stress (SY)
At bolt-up plus internal pressure. The maximum SY of 769 MPa at bolt-up decreased to 760 and 766 MPa at design and proof test pressure, respectively, and were observed to be higher than the allowable stress limit. Close to the gauge location, SY at the inside and out-side nodes was 474 MPa and 440 MPa, respectively, at bolt-up, which increased linearly from 480 to 485 and 437–438 MPa at design and proof test pressure, respec-tively. The SY observed was within the allowable stress limit up to the proof test pressure at gauge location (Figs 4(a), (b), and (e)). At bolt-bottom (L-6), an SY of 467 MPa at bolt-up increased to 475 and 481 MPa at design and proof test pressure, respectively, at the inside node of the bolt. The SY of 425 MPa at bolt-up decreased to 420 MPa at design and proof test pres-sure at the outside node of the bolt. However, SY remained within the allowable stress limit at both pres-sures at bolt-bottom (Fig. 5(a)). The average bolt stress
of 457 MPa at bolt-up increased to 458 and 461 MPa at design and proof test pressures, respectively and was less than 1 per cent, showing a static mode of load of non-gasketed joint.
At design pressure plus axial loading. The maximum SY increased linearly from 763 MPa to 893 MPa at an additional axial load of 100–640 kN. The maximum SI remained higher than the allowable stress limit at all loads. Close to the gauge location, SY at the inside and outside nodes increased from 498 to 647 MPa and 447–570 MPa, respectively, at an additional axial load of 100–640 kN. SY reached the allowable stress limit at an axial load of 525 kN in addition to the design pressure (Figs 4(a), (c), and (d)). At bolt-bottom (L-6), the SY of 475 MPa at design pressure increased to 494– 654 MPa at the inside node, and the SY of 420 MPa at proof test pressure increased to 429–512 MPa at the outside node of the bolt at an axial load of 100–640 kN. The SY at bolt-bottom reached the allowable stress limit at 525 kN (Fig. 5(a)). The average bolt stress of 448 MPa at design pressure increased to 462–583 MPa (4–31 per cent) at an additional axial load from 100 to 640 kN at bolt-bottom and gauge location. Results showed that bolt-bending increases with an increase in axial loading.
[image:7.595.81.534.80.288.2]Fig. 5 (a) Stress variation at DP and PT and axial loading at bolt bottom: SY variation for DP and PT in symmetry plate, (b) along bolt holes, and (c) between bolt holes
(f ), and (g)). At bolt-bottom (L-6), SY of 481 and 420 MPa at the inside and outside nodes of the bolt at proof test pressure increased from 497 to 661 MPa and 425–533 MPa, respectively, at an additional axial load from 100 to 640 kN. The SY at bolt-bottom reached the allowable stress limit at 480 kN (Fig. 5(a)). An average bolt stress of 451 MPa at proof test pressure increased to 461–597 MPa (3–34 per cent) at an additional axial load from 100 to 640 kN. Results showed bolt-bending increases with the increase of axial loading.
5.2.3 Experimental versus FEA
At design pressure plus axial loading. The SY calcu-lated experimentally, 587 MPa at 400 kN and 626 MPa at 480 kN were close to the FEA results, 581 MPa at 400 kN and 621 MPa at 480 kN at the inside node. The SY calculated experimentally, 437 MPa at 400 kN and 448 MPa at 480 kN were close to the FEA results of 491 MPa at 400 kN and 512 MPa at 480 kN at the out-side node. Results show that SY at the gauge location reached allowable stress limit at 525 kN (Fig. 4(a)).
At proof test pressure plus axial loading. The SY cal-culated experimentally, 632 and 510 MPa at the inside and outside nodes were close to the FEA results, 640 and 526 MPa at the inside and outside nodes, respec-tively, at 480 kN. Results show that SY at the gauge location reached the allowable stress limit at 480 kN (Fig. 4(a)).
5.3 Contact stresses variation between flange faces – FEA results
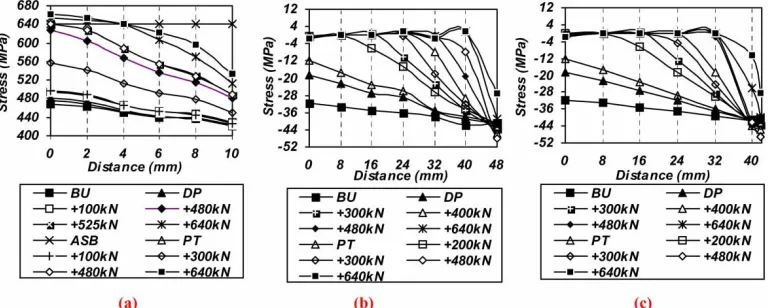
At bolt-up plus internal pressure. At the inside diameter of a symmetry plate, along bolt hole (L-4) and between bolt holes (L-5), a contact stress of−32 MPa at bolt-up
at the inside diameter decreased to−19 MPa at design
pressure and−12 MPa at proof test pressure. Along
L-4 and L-5 at design and proof test pressures, a good
contact stress was found along, concluding no chances of leakage from the joint (Figs 5(b) and (c) and 6(a) and (d)).
At design pressure plus axial loading. At the inside diameter of a symmetry plate along bolt hole (L-4) and between bolt holes (L-5), a contact stress of−19 MPa
at design pressure at the inside diameter decreased to−7 MPa at an additional axial load of 100 kN.
Con-tact stress further decreased rapidly to −0.2 MPa at
200 kN, −0.4 MPa at 300 kN, −0.8 MPa at 400 kN. It
then increased to −1 MPa at 480–640 kN. Along L-4
and L-5, during bolt-up, design pressure and axial load up to 100 kN, a good contact stress was found. Contact start after 4.12 mm at 200 kN, 13.7 mm at 300 kN, 26.7 mm at 400 kN, 26.95 mm at 480 kN, 27 mm at 525 and 640 kN along L-4. Contact stress found along L-5 had similar behaviour as L-4 except for 480 kN, where contact starts after 31.6 mm, 32 mm for 525 kN, and 34.3 mm for 640 kN (Figs 5(b) and (c) and 6(b) and (c)).
At proof test pressure plus axial loading. At the inside diameter of a symmetry plate along bolt hole (L-4) and between bolt holes (L-5), contact stress of
−12 MPa at proof test pressure at the inside
diame-ter decreased to−1 MPa at an additional axial load
of 100 kN. Contact stress further decreased rapidly to −0.3 MPa at 200 kN, −0.6 MPa at 300 kN. It then
increased to −1 MPa at 400–640 kN. Along L-4 and
L-5, during bolt-up, proof test pressure and an axial load up to 100 kN, a good contact stress found. Con-tact start after 11.8 mm at 200 kN, 22.6 mm at 300 kN, 26.85 mm at 400 kN, 26.95 mm at 480 kN, 27 mm at 525 kN, and 640 kN along L-4. Contact stress found along L-5 had similar behaviour as L-4 except for 480 kN, where contact starts after 29.1 mm, 32.7 mm for 525 kN and 37 mm for 640 kN (Figs 5(b) and (c) and 6(e) and (f )).
[image:8.595.100.484.82.236.2]Fig. 6 Contact stress (SY) at (a) DP, (b) DP+300 kN, (c) DP+640 kN, (d) PT, (e) PT+300 kN, and (f )
PT+640 kN
proper contact at the inside diameter is due to the positive taper angle at the flange surface, even up to an axial load of 640 kN. Similarly, reduced contact is observed along L4 and L5. As the bolt inside diam-eter along L4 is measured at a distance of 24.25 mm and this is the shortest path for the leakage; hence this shows that at any load more than 350 kN (for design pressure plus axial loading) and 300 kN (for proof test pressure plus axial loading) there is no possibility of leakage from the bolt holes and between bolt holes.
5.4 Axial displacement – FEA results only
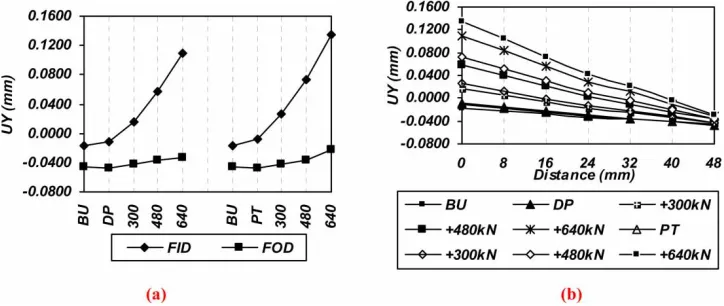
At bolt-up plus internal pressure. At the inside diameter of the flange (L-1), an axial nodal displacement of
−0.0175 mm at bolt-up, increased to−0.0112 mm and −0.0737 mm at design and proof test pressure at the
inside diameter. In addition, no positive axial dis-placement along L4 and L5 shows a good sealing;
hence providing no chance of leakage up to proof test pressure (Figs 7(a) and (b)).
At design pressure plus axial loading. At the inside diameter of the flange (L1), an axial nodal displace-ment of 0.0112 mm at design pressure increased to
−0.0368 mm at 100 kN. It increased to 0.003 77 mm at
200 kN, 0.0162 mm at 300 kN, 0.0368 mm at 400 kN, 0.0574 mm at 480 kN, 0.0706 mm at 525 kN, and 0.11 mm at 640 kN. Along L4 and L5 a good sealing has been observed up to an additional axial load of 100 kN. Axial flange displacement along L4 and L5 beyond 3.23 mm at 200 kN, 11.1 mm at 300 kN, 19.4 mm at 400 kN, 27.3 mm at 480 kN, 30.3 mm at 525 kN, and 35 mm at 640 kN in addition to the design pressure (Figs 7(a) and (b)).
At proof test pressure plus axial loading. At the inside diameter of flange (L1), axial nodal displace-ment−0.0737 mm at proof test pressure increased to −0.000 55 mm at 100 kN. It increased to 0.009 49 mm
[image:9.595.81.534.82.275.2] [image:9.595.124.486.573.726.2]at 200 kN, 0.0263 mm at 300 kN, 0.0505 mm at 400 kN, 0.073 mm at 480 kN, 0.0872 mm at 525 kN, and 0.135 mm at 640 kN. Along L4 and L5, a good seal-ing has been observed up to an additional axial load of 100 kN. Axial flange displacement along L4 and L5 beyond 7 mm at 200 kN, 15.4 mm at 300 kN, 23 mm at 400 kN, 30.4 mm at 480 kN, 32.4 mm at 525 kN, and 37.4 mm at 640 kN in addition to the proof test pressure (Figs 7(a) and (b)).
Summarizing the above, axial flange displacement at the inside diameter at 200 kN and above is more than zero mm, although it is very small. As Compared to the contact stress of −1 MPa up to 664 kN at the
inside diameter it seems to be almost negligible and it appears to be due to the positive taper angle at the flange surface. As the bolt’s inside diameter along L4 and L5 is measured at a distance of 24.25 mm, and this is the shortest path for the leakage; at any load more than 450 and 410 kN at design and proof test pres-sure plus axial loading, respectively, and there could be leakage from the bolt holes (Figs 7(a) and (b)). From these results, it appears that the application of exter-nally applied axial loadings, in addition to the internal pressure applied, has a pronounced effect on the axial displacement and consequently on the sealing of the joint, as it increases with an increase in axial loadings, thereby allowing the possibility of leakage.
6 EXPERIMENTAL PROGRAMME
6.1 Flange type, size, tools, and test rig component selection
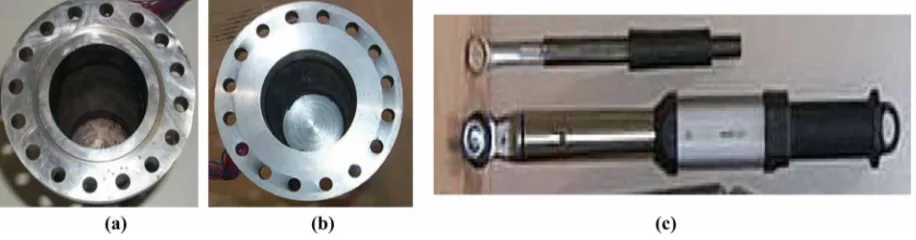
A non-gasketed flange joint equivalent to 4 in, class 900# joint size were selected and an appropriate test rig made. This size is commonly used in the industrial sector, and is easy to handle in the laboratory, and all tooling required are easily available. For all series of tests, non-gasketed flanges with and without O-rings and the tools used to make then joint assembly are shown in Figs 8(a) to (c). Flanges and pipe are arranged recommended by codes and the industrial sector. End caps at the end of the pipe pieces are designed as per
PD5500 [18] and the remaining calculations for the saddle, frame, pin and side-bars are based on a general structure design [4].
6.2 Strain gauging and instrumentation
To measure the strength of the test rig comprising flanges, pipes, bolts, and supporting structure, strain gauges were placed at different major locations. The data logging system was connected to the test rig record results from strain gauges attached at the bolts, frame, flange, pipe section, pressure transducer, and test machine.
Bolts. Two strain gauges of 350 ohm were placed on the shanks at an angle of 180◦
on each bolt and leads were taken out between the washer and bolt head, as shown in Fig. 9(a). Quarter and full bridge circuit were used for strain measurements.
Side frame. For tests, axial load was applied using a hydraulic pump and readings taken from the pressure gauge attached to the pump. To accurately measure the digital or electronic data during the application of different loads, it was decided to attach two pairs of strain gauges of 120 ohm on the frame (free end) side plates that hold the pin (Fig. 9(b)). The side frame was calibrated before using in actual tests, and applied load was calculated from the strain recorded.
Flange and pipe. Four pairs of strain gauges of 120 ohm resistance were attached to hub centre and at hub-flange locations at an angle of 90◦
. At the hub-flange, the intersection strain gauges were attached at the fillet as well as along the elliptical portion to accurately record stress behaviour. Four pairs of strain gauges of 120 ohm were attached at an angle of 90◦
at the pipe centre away from the locations of discontinuity (Fig. 9(c)).
6.3 Calibration of bolts and rig and test rig assembly
Calibration plays an important role when undertaking experimental work, so as to avoid any possibility of unknown errors in strain measurements. To identify
[image:10.595.63.521.608.728.2]Fig. 9 Strain gauging of (a) bolt, (b) side frame, and (c) pipe and flange section
these interactions, before actual experiments, cali-bration of different joint components is performed. During experiments for combined loading a combi-nation of equipment was used: bolts, pressure gauges, pressure transducer, hydraulic pumps, hydraulic pis-tons, machine for bending load, side frame for axial load, and clip gauge for joint opening measurement. Using an ‘hand-tightening’ methodology with ordi-nary spanner, 16 bolts were normally tightened as in the following sequence: i.e. 1, 9, 5, 13, 3, 11, 7, 15, 2, 10, 6, 14, 4, 12, 8, and 16 [4].
6.4 At internal pressure only
Internal pressure loading is currently the prime method of loading as per available codes and stan-dards as flanged pipe joints are designed to withstand this. Pressure loading is applied to the assembled joint via a manually operated hand pump of 50 MPa (500 bar) capacity. Pressure gauges on the pump and a pressure transducer on the test vessel are attached to record fluid pressure. Internal pressure loading up
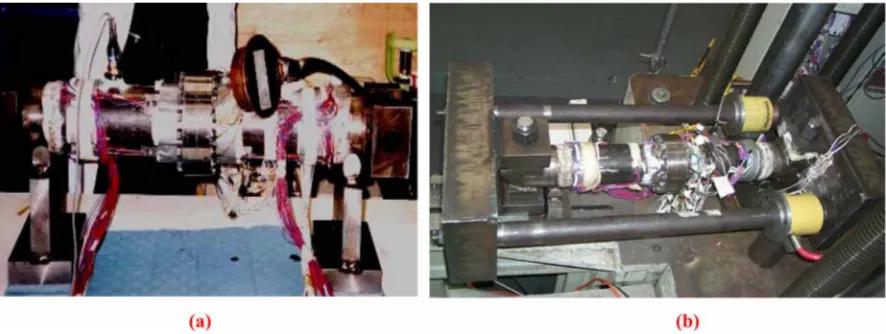
to a design pressure of 15.3 MPa, proof test pressure of 23 MPa, and maximum pressure of 40 MPa at unload-ing was applied in gradual increments and decre-ments of 0.5 MPa (5 bar). The test rig arrangement is shown with sudden pressurization and depressuriza-tion. Results were recorded in Fig. 10(a).
6.5 At combined internal pressure and axial loading
[image:11.595.79.535.83.242.2]After filling the test rig with hydraulic fluid, axial load was applied via two symmetric parallel shafts loaded by hydraulic cylinders (Fig. 10(b)). This tensile load was transferred to the pipe by the heavy end plates and a pin-type connector, which was located between the assembly and the loaded shafts. The end plates were designed such that they were rigid enough to transfer the load from the shafts to the pipe assem-bly. The maximum axial force applied was based on the preload applied in bolts [4] i.e. 480 kN was applied based on recommended torque in bolts. Axial force was applied equal to and more than the calculated
[image:11.595.84.527.571.738.2]force (480, 525, and 664 kN) to see the effect on bolt strain. The load was not applied beyond these maxi-mum values to avoid the pipe and flange yielding, as well as due to the limitation of the hydraulic pump available. The side frame was designed and calibrated for a maximum axial load of 700 kN. Tests were per-formed varying the axial load with internal pressure of 15.3 and 23 MPa (153 and 230 bar), respectively, for loads and in increments of 0.5 MPa (5 bar) at the start and then at about 0.2–0.4 MPa (20–40 bar). Axial load was applied in increments of about 200 psi at the start and then increased to 300–400 psi.
6.6 Experimental results discussion and conclusions
The joint assembly without the O-ring was tested at a maximum axial load of 525 kN, which was more than the applied pre-load of 480 kN in the bolts of the joint. No leakage was observed. The joint assembly with the O-ring was tested for two sets of tests with load variation of up to a maximum axial load of 664 kN (10 per cent more than the load of 594 kN to cause yielding of the bolts). This calculated load was based on the root area (58 mm2) of the bolt. The first set of
tests was completed with a maximum axial load of up to 525 kN, and no leakage was observed. This shows the sealing capability of the non-gasketed joint with-out the O-ring. The second test was performed for a maximum load of 664 kN. At this load, a small open-ing at the bottom of the joint was observed. Two bolts at the bottom were found to have relaxed and they were re-tightened. The test rig was pressurised for the combined load test. A rapid increase in bolt strain was noted at pressure loads lower than the maximum per-missible working pressure. However, it is important to note that no leakage was observed from the joint. All the bolts were then checked and a very small elon-gation in 12 bolts was noted, which was not visible and was felt only by matching the threads with the threads of the virgin or original bolt. However, the leak proof behaviour was also noted during the internal pressure loading. No leakage was observed from the joint assemblies with the O-ring, proving it was leak proof. Even at the load of 664 kN, when the bolts had elongated and an opening was observed in the joint at the bottom, no fluid seepage or leakage was observed from the joint. This shows the sealing capability of the joint.
From the overall strain behaviours all sections of flange and pipe, the material behaviour is almost lin-ear elastic during loading and unloading. However, the possibility of other factors such as deformation pro-duced during welding, dimensional variation during manufacturing, and a slight variation in the location of the gauges cannot be ruled out. For the bolts, the
stress result variation is due to the difference in bolt quality and surface treatment, affecting the pre-load applied in the bolts.
7 CONCLUSIONS
From the results, at bolt-up and up to proof test pressure loading, the almost static-mode-of-load has shown the non-gasketed flange joint’s strength and sealing capability, both experimentally and numeri-cally. However, at additional axial loading, joint per-formance is affected. This highlights the importance of determining the actual joint load capacity for the optimized joint strength and sealing capability, show-ing that any joint designed for only internal pressure may fail under any external axial loading. During the present study, from the detailed experimental and numerical studies, a maximum upper limit with applied design and proof test pressure has been deter-mined and is recommended for an optimized perfor-mance. In this study, a bolt-up of 74 per cent of the yield stress of the bolt material was applied, which resulted in greater stress variation in bolt and flange. However, a minimum initial bolt-up load of 80 per cent of the yield stress of the bolt material is essen-tial for proper joint sealing under combined internal pressure and axial loading. Summarizing based on the static mode-of-load in the joint, both qualitatively and quantitatively, a non-gasketed flange joint with a posi-tive taper angle can be used for any additional axial loading for safe strength and sealing.
ACKNOWLEDGEMENT
The authors are grateful to Department of Mechan-ical Engineering, University of Strathclyde, Glasgow, UK, for providing a test rig for experimental work and the Pakistan Science Foundation, Islamabad, for providing funding to carry out this study.
REFERENCES
1 BS 1560:1989. Steel pipe flanges for the petroleum industry. British Standards Institution, London, UK. 2 ASME boiler and pressure vessel code, section VIII, 1998
(American Society of Mechanical Engineers, New York, USA).
3 Abid, M. and Nash, D. H. Comparative study of the behaviour of conventional gasketed and compact non-gasketed flanged pipe joints under bolt up and operating conditions.Int. J. Press. Vessels Pip., 2004,80, 831–841. 4 Abid, M. Experimental and Analytical studies of
5 Webjörn, J.Flange design in Sweden. In the Petrochemi-cal MechaniPetrochemi-cal Engineering Conference, American Soci-ety of Mechanical Engineers, Philadelphia, USA, 1967, pp. 17–20.
6 Webjörn, J. The bolted joint – a series of problems. Linköping Studies in Science and Technology, Disserta-tion No. 130, 1985.
7 Abid, M., Nash, D. H.,andWebjörn, J.The stamina of non-gasketed flanges. In the International Conference onFatigue2000, Cambridge, UK, pp. 575–584.
8 Abid, M.andNash, D. H.A parametric study of metal-to-metal contact flanges with optimised geometry for safe stress and no-leak conditions.Int. J. Press. Vessels Pip., 2004,81, 67–74.
9 Abid, M.Determination of safe operating conditions for non-gasketed flange joint under combined internal pres-sure and temperature.Int. J. Mech. Mater. Des., 2005,2, 129–140.
10 Abid, M. Design and analysis of non-gasketed bolted flanged pipe joint under combined internal pressure and temperature loading. In the 3rd BSME-ASME Inter-national Conference on Thermal Engineering, Dhaka, Bangladesh, 20–22 December 2006.
11 Morohoshi, T. and Sawa, T. On the characteristics of rectangular bolted flanged connections with gaskets sub-jected to external tensile loads and bending moments.J. Press. Vessel Technol. Trans. ASME, 1994,116(2), 207–215. 12 Fukuoka, T.andTakaki, T.Three dimensional finite ele-ment analysis of pipe flange – effect of flange interface geometry.ASME Press. Vessel Piping, 1998,367, 61–67. 13 ASME boiler and pressure vessel code, section II, part
D, 1998 (American Society of Mechanical Engineers, New York, USA).
14 BS 3692:1967. Specifications for ISO metric precision hexagonal bolts, screws and nuts. British Standards Institution (BSI), London, UK.
15 Spence, J., Macfarlane, D. M.,andTooth, A. S. Metal-to-metal full face taper hub flanges: finite-element model evaluation and preliminary plastic analysis.Proc. Instn Mech. Engrs, Part E: J. Process Mechanical Engineering, 1998,212(E), 57–69.
16 ANSYS elements manual, seventh edition, 2004 (ANSYS Inc., USA).
17 Spence, J. and Tooth, A. S. Pressure vessel design – concepts and principles, 1994 (E & FN Spon, London, New York).
18 PD 5500:1997.Unfired fusion welded pressure vessels, British Standards Institution (BSI), London, UK.
APPENDIX
Notation
E Young’s modulus of elasticity (MPa) SI stress intensity at gauge location at hub
centre/hub fillet/pipe (MPa)
SIBI stress intensity at gauge location at inside node of bolt (MPa)
SIBO stress intensity at gauge location at outside node of bolt (MPa)
SY axial stress at gauge location at hub centre/hub fillet/pipe (MPa)
SYBI axial stress at gauge location at inside node of bolt (MPa)
SYBO axial stress at gauge location at outside node of bolt (MPa)
MSI maximum stress intensity at hub centre/hub fillet (MPa)
MSY maximum axial stress at hub centre/hub fillet (MPa)
MSIB maximum stress intensity in the bolt (MPa)
MSYB maximum axial stress in the bolt (MPa) PS principal stress at gauge location at hub
centre/fillet (MPa)
AS allowable stress of flange/pipe (248 MPa) ASB allowable stress of bolt (640 MPa)
ES experimental principal stress at gauge location at hub centre/hub fillet/pipe (MPa)
ESBI experimental axial stress in bolt at inside gauge (MPa)
ESBO experimental axial stress in bolt at outside gauge (MPa)
DP design pressure (15.3 MPa) PT proof test pressure (23 MPa) YS yield stress of flange (372 MPa) FID flange inside diameter (mm) FOD flange outside diameter (mm) SG strain gauge
υ Poisson’s ratio