Material plastic properties characterization using a genetic algorithm and
finite element method modelling of the plane strain small punch test
Wenke Pan*, Jim Boyle, Mohd. Ramlan, Craig Dun, Mohd. Ismail, Kenji Hakoda
Department of Mechanical Engineering, University of Strathclyde, Glasgow, U.K. *: email: [email protected]
Abstract: In this paper, a novel plane strain small punch test (SPT) method is proposed for material plastic properties characterization. The plane strain SPT is different from the standard SPT in the two ways: (a) a long thin rectangular specimen (with dimensions of about 20mm×8mm×0.5mm) is used, and (b) the resulting test tool components - such as punch head and upper and lower die - are also different. The punch head is a prism with a half-circular shape and the upper and lower die consists of left and right long blocks, with a chamfer at each of the inner top corners of the lower die. The tool components have been designed and assembled and the plane strain small punch tests have been performed to obtain the punch force and the corresponding central displacements of the specimen. This information is then used to characterize the material’s plastic parameters.
Keywords: Plane strain small punch test, Material properties characterization, Genetic algorithm, Finite element method.
Introduction
Material property characterization is very important for structural design, since an optimally designed structure with full use of available material strength can lead to costs being reduced dramatically. It is even more important for ageing power plants with their design life-time almost exhausted if service is expected to be extended. The proper extension of service of such power plants can be not only cost effective but also environmentally friendly; however the material will have deteriorated and this must be taken into account through improved material characterization. There are many testing methods for material property characterization, although the standard simple tensile test remains the most common. But the tensile test is at a disadvantage for in-service components since a cylindrical specimen with a length of around 60mm and a diameter of 10mm is required to be removed from the component, and subsequent repair, such as welding, has to be performed, increasing uncertainty about the structural integrity. The Small Punch Test (SPT) [1] was developed nearly thirty years ago to overcome this difficulty: the dimensions of a typical disc-like SPT sample are a diameter of 6 to 8 mm and a thickness of 0.5mm, therefore much less material is required to be removed. Indeed it is virtually a non-destructive material testing method for a tiny amount of material can be ‘scraped’ directly from the surface of in-service components.
Initially, the SPT technique was proposed by Manahan etc. at MIT for investigation of the behaviour of materials used in nuclear power plant under radiation and high temperature environments in 1981[1]. In the following ten years, the SPT technique has mainly been used to determine properties related to material fracture [2]. Subsequently, it was extended to the characterisation of creep material properties [3-9]. Apart from the mostly ad hoc methods to obtain final material properties from a SPT, the Artificial Neural Network
approach has also been used to determine the material ductile parameters and the fracture parameters [10-11]. Although the standard SPT test has been successfully used to characterize virgin and in-service material properties, it remains difficult to deal with welded in-service components since material properties vary spatially from the parent material to the heat affected zone and to the welding material. One way to deal with this is to cut samples at different zones [8] - this is obviously not a non-destructive method for at least 10 mm depth cut is required to get an 8mm diameter specimen. Moreover, if only the surface disc-like sample is used, it remains a non-destructive sampling method, but the resulting stress field will be very much more complex under the SPT test because the material properties vary from the base to the heat affected zone then to the weld material. To overcome these difficulties, a novel plane strain small punch test [13] was proposed with a long thin rectangular sample. This new type of SPT test is different from the standard SPT in the two ways: (a) a long thin rectangular specimen (with dimensions of about 20mm*8mm*0.5mm) is used, and (b) the resulting test tool components - such as punch head and upper and lower die - are also different. The punch head is a prism with a half-circular shape and the upper and lower die consisting of left and right long blocks, with a chamfer at each of the inner top corners of the lower die. By proper assemblage of the tool components and clamping of the specimen, a plane strain SPT can be performed.
displacement and the corresponding punch force can be obtained. A genetic algorithm [9-11] is then used to derive the material parameters, using a cost function based on the relative difference between the target and simulated forces results under the same corresponding punch head displacement. In the following section, the design details of this new SPT will be given, followed by the FEM modelling and then the genetic algorithm optimization method.
Plane strain small punch test tool design
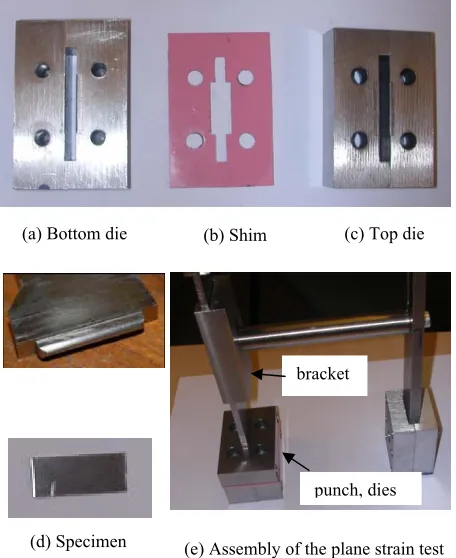
Like conventional SPT tools, this novel plane strain SPT tool also includes a punch, a top die and a bottom die. Instead of a cylindrical punch with hemi-spherical head and hollow cylindrical top and bottom dies, the plane strain SPT punch head is a prism with a half-circular shape and the upper and lower die consists of left and right long blocks, with a chamfer at each of the inner top corners of the lower die. The main components and the assembly of the plane strain SPT are shown in Figure 1a-e. Four M6 threads were created to tie the top and bottom dies. To make sure the punch deforms the specimen vertically; a bracket with a slot shown in Figure 1(e) was designed and manufactured then connected with a relatively rigid frame. It is difficult to hold the specimen in the correct position due to the small size of the specimen (20mm*8mm*0.5mm); it is also invisible after assembling. To overcome this problem, a thin plastic shim shown in Figure 1(b) was designed, manufactured and placed between the top and bottom dies; then, the specimen can sit in its correct position inside the shim.
The height and width of the punch are 380mm and 28mm. The thickness of the main part of the punch is 4mm, and the diameter of the punch head is 2.5mm. The length of the slot of the top and bottom die is 30mm, while the width of slot of the top and bottom dies is 4mm.
A press machine was used for the tests such that the punch deforms the long thin rectangular specimen. The force and the corresponding displacement of the punch were recorded for subsequent material characterization.
Finite element model for the plane strain
small punch test
Non-linear elastic-plastic large deformation FE analyses were carried out to investigate how the specimen deformation varies with punch force under different values of the material parameters. Due to the long thin specimen being used, the whole testing system can be simplified as a plane strain case. The FEM model shown in Figure 2 is the representative cross section of the system, which consists of a punch, a top and bottom die and a specimen. Because of symmetry, only half of the model is needed for the simulation. The width and the thickness of the specimen are 8mm and 0.5mm respectively; the fillet radius of both top and bottom dies was set as 0.2mm. The other dimensions of the tool components have been discussed in the preceding section. To reduce simulation CPU time, the punch, top and bottom dies were assumed to be rigid bodies. The FEM code ABAQUS/Implicit was used for this numerical simulation. The contact between punch and specimen, top die and specimen and bottom die and the specimen were analysed with penalty contact formulations and the constant friction factors between the corresponding surfaces were 0.05, 0.2 and 0.2 respectively. The Ramberg-Osgood material constitutive relationship was used to represent the relationship between stress and strain. This relationship takes the form:
n
E K
E ⎟⎠
⎞ ⎜ ⎝ ⎛ +
=σ σ
ε (1)
where σ and
ε
are stress and strain, E is material Young’s modulus and K, n are material constants. If the stressσ
0.2is defined as the stresses at plastic strain of0.2%, and we define
1 2 . 0
−
⎟
⎠
⎞
⎜
⎝
⎛
=
n
E
K
σ
α
then eqn. (1)can be written in the form n
E ⎟⎟⎠
⎞ ⎜⎜ ⎝ ⎛ +
=
2 . 0
* 002 . 0
σ σ σ
ε
(2)
where
*
0.2=
0
.
2
%
E
σ
α
(3)
(c) Punch
[image:2.595.60.288.465.744.2](d) Specimen (e) Assembly of the plane strain test
Figure 1 The assembly of the plane strain SPT tool
(a) Bottom die (b) Shim (c) Top die
bracket
If αis given,
σ
0.2can be calculated from equation (3); subsequently, from equation (2), the total strain can be obtained with n being given. In this paper, the test material is a type of stainless steel with material Young’s modulus assumed to be 200GPa and a Poisson’s ratio of 0.3 - then only the material constants [image:3.595.324.558.105.692.2]n and αneed to be characterized. By investigating similar types of material tensile stress strain curve, it can be seen that due to the power index n involved in the constitutive equation, slight variation of n can give a huge change of strain, so equation (1) was only used for the plastic range between 0.01% and 2%, then linear hardening was assumed above a plastic strain of 2% and the ultimate tensile stress was assumed as 5% larger than that of 2% plastic strain.
Figure 2 The plane strain FEM model of the small punch test system
A Genetic Algorithm for material
characterization
The genetic algorithm [12] is one type of optimization method which is based on a simple natural rule: survival of the fittest. The fitter creatures will have more chances to survive and to reproduce their off-springs.
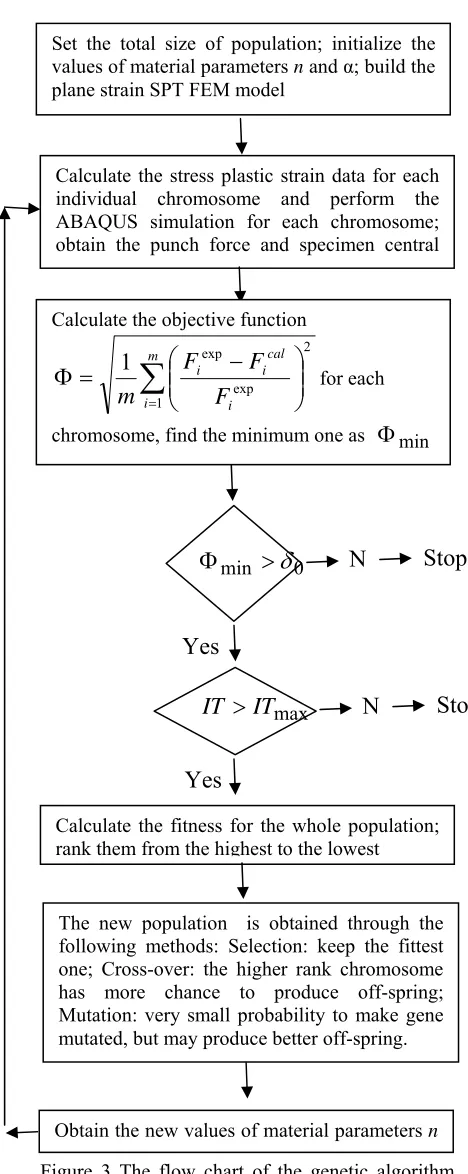
A general GA optimization flow chart for material plastic properties characterization is shown in Figure 3. From this flow chart, it can be seen that the GA procedure consists of selection, crossover and mutation, with higher fitness chromosomes having more chances to be selected and the fittest off-spring at each generation always being kept. The advantages of a GA optimization method over conventional optimization methods is that the former doesn’t require the derivatives of the objective function and is also suitable for parallel simulation; however disadvantages include the fact that a global optimization solution is not guaranteed and large amount of CPU time required.
For practical applications, especially for material properties characterization, the range of these parameters may be known in advance. By comparing the results from the evolution of each generation, the relative optimal results can be obtained.
The fitness function used in this paper was assumed as
Φ
+
=
01
.
0
1
f
(5)
where
Φ
is the square root of the average of the sum of the squares of the relative error between theCalculate the fitness for the whole population; rank them from the highest to the lowest
The new population is obtained through the following methods: Selection: keep the fittest one; Cross-over: the higher rank chromosome has more chance to produce off-spring; Mutation: very small probability to make gene mutated, but may produce better off-spring.
Obtain the new values of material parameters n
N
Stop
Set the total size of population; initialize the values of material parameters n and ; build the plane strain SPT FEM model
Calculate the stress plastic strain data for each individual chromosome and perform the ABAQUS simulation for each chromosome; obtain the punch force and specimen central
li i l di l
Calculate the objective function
∑
=
⎟⎟
⎠
⎞
⎜⎜
⎝
⎛
−
=
Φ
mi i
cal i i
F
F
F
m
12
exp exp
1
for each
chromosome, find the minimum one as
Φ
min0 min
>
δ
Φ
Yes
N
Stop
max
IT
IT
>
[image:3.595.75.258.259.355.2]Yes
experimental and the simulated punch forces corresponding to the pre-set specimen central line displacements, without considering the initial elastic stages. The cross-over probability was set as 80% while a relative large mutation rate of 0.05 was specified due to the small population used in this simulation. The GA iteration (evolution) procedure stops when the set criterions, the maximum allowable iteration number (ITmax) or the minimum value(
δ
0) of the objective function, are met.Results
Finite element results
Some initial trial and error simulations were performed and by comparison between the experimental and simulated forces at the corresponding pre-set displacements, reasonable values of αand n can be obtained. A 20% variation of n and
α
values may be expected, so the range of these parameters can be defined to start the GA optimization procedure. A plane strain 4-node element with reduced integration was used for the finite element simulations. Mesh convergence was examined first: four meshes with different mesh density were used - the undeformed FEM meshes are shown in Figure 4. The total number of elements in each of the four meshes from the coarsest to the finest are 32, 128, 288 and 512 respectively, while the corresponding node numbers are 51, 165, 343 and 585 respectively.Tab. 1 Mesh convergence test on punch force under the punch head displacement of 1.47mm (n=10.0 and
85 . 0 =
α )
Punch force acting onto the specimen (N)
Relative error (%), based on mesh4
Mesh 1
5,346 0.99
Mesh 2
5,321 1.45
Mesh 3
5,294 1.95
Mesh 4
5,399 NA
Tab. 2 Mesh convergence test on specimen’s bottom central displacement under the punch head displacement of 1.47mm (n=10.0 & α=0.85)
Displacement at the bottom central line (mm)
Relative error (%), based on mesh4
Mesh 1 -1.5559 4.80
Mesh 2 -1.5122 1.86
Mesh 3 -1.4908 0.42
[image:4.595.300.522.331.467.2]Mesh 4 -1.4846 NA
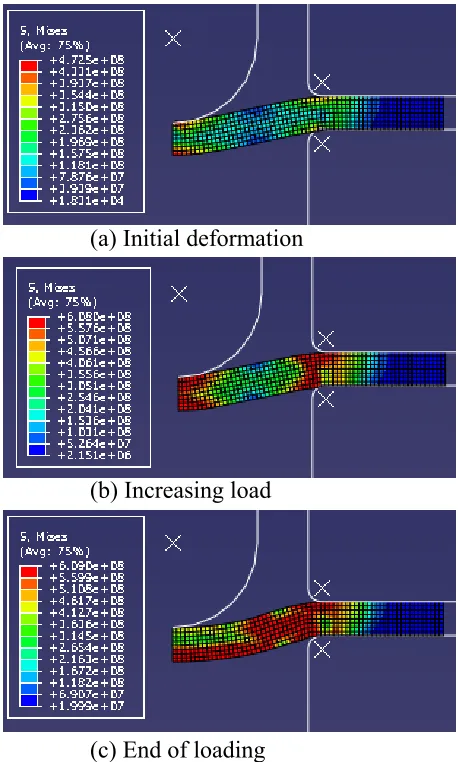
[image:4.595.70.277.549.698.2]Table 1 and Table 2 show the punch force acting on the specimen and the specimen’s bottom central point vertical displacement under the punch head displacement of 1.47mm respectively. From Table 1 it can be seen that the calculated punch forces doesn’t vary much with the mesh density. The maximum relative error of the punch forces to that of the finest mesh is less than 2%. From Table 2, the relative error for the coarsest mesh is about 5%, while for Mesh 2, it is less than 2%. Therefore, to save CPU time, Mesh 2 was used for all subsequent simulations. The deformed mesh and the stress contours at different deformation stages are shown in Figure 5(a) to (c). By examining the stress values from the stress contours, it can be seen that
Figure 4 FEM meshes used for convergence tests: from (a) the coarsest to (d) the finest
(a)
(b)
(c)
at the beginning of the deformation stage, the maximum Von-Mises stress occurs at the centre of the specimen; with increasing punch force, the Von-Mises stress at the die shoulder area increases quickly - with the further increase of load, the higher stress area extends to one third of the die radius area.
Experimental results
Eleven sets of plane strain SPTs were performed; a lubricant was added to the top surface of the specimen for some of the tests. Test results show that the punch forces are higher for those without lubrication. Although there are some differences between the test cases under same test conditions, the test results show consistency. Here only the results from Specimen No.11 with lubrication are reported. A plot of punch force against punch head displacement curve is shown in Figure 6. The deformed specimen is shown in Figure 7. This curve was divided uniformly into 20 segments and the forces corresponding to different displacement were used for material characterization using the GA optimization method. The deformation can be described as three stages: the first stage is elastic deformation
dominated, the second stage is an elastic and plastic transition stage and this is followed by a plastic deformation stage due to material strain hardening behaviour. The trend of experimental force as it varies with corresponding displacement is similar to those of conventional SPT [9].
Genetic Algorithm results
Each of the Ramberg-Osgood material parameters n and
α
were represented by seven binary strings. The initial values of n andα
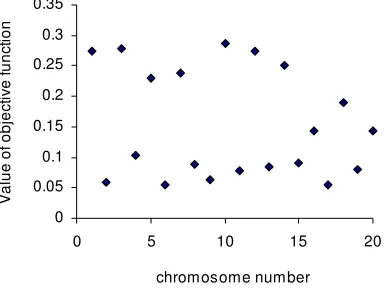
were assigned random values within their ranges. The total number of the population was set as 20. For each generation, with the selection, crossover and mutation, different bits of the strings were obtained, then new n and αwere used to create strain plastic data for the ABAQUS simulation. The punch forces and the corresponding displacement were obtained by the ABAQUS post-processor simulation for each case. Using interpolation, the punch force corresponding to the pre-set experimental displacement points were obtained. Then, the objective function was calculated, and using equation (5) the fitness for each individual was evaluated. Figure 8 shows the values of the objective function within the 1st generation. A smaller value of the objective function will have a larger value of fitness. After each iteration, a ‘better’ individual may be found. The GA optimization procedure stops if any of the set criteria are satisfied. Figure 9 shows the values of the fitness function of the 5th generation. The best values obtained for n and αare 9.375 and 0.932 respectively. A plot of stress against plastic strain curve is shown in Figure 10. The ultimate tensile strength obtained is about 572MPa and this value is within the range (from 510 to 620MPa) of annealed stainless steel which was used for the test. Finally, a comparison of plots of punch forces against specimen central displacement between FEM and experimental results areFigure 7 The deformed specimen
Specimen central vertical displacement, m 0
1000 2000 3000 4000 5000 6000
0.0000 0.0005 0.0010 0.0015
Punch force varies with specimen central vertical displacement
P
unc
h f
o
rc
e,
[image:5.595.54.283.69.450.2]N experiment results
Figure 6
Figure 5 Stress contours at different deformation stage
(a) Initial deformation
(b) Increasing load
[image:5.595.308.527.143.266.2]shown in Figure 11. It can be seen that apart from the elastic range, the predicted results are in good agreement with that of experiment results.
Discussion
There are many aspects of this new plane strain SPT which could have an effect on the simulation modelling. For example, the fillet radius of the bottom die, the accuracy of the punch head dimensions, the friction between the contact surfaces and also the clamping force between the top and bottom dies. Other aspects include the formulation of the constitutive relationship - in this paper, only two material parameters were used. So far, only one experimental curve has been used for material characterization although several experiments were performed. The experimental results exhibit some scatter so the statistical variation of the material parameters should be studied. Due to the need for large numbers of ABAQUS simulations resulting in some parts of the overall optimisation procedure having to be done manually, there could only be a limited number of iterations in the current genetic algorithm optimization. An automatic procedure which links ABAQUS FEA simulation and GA optimization must be studied in the future.
Conclusions
A novel plane strain SPT tools for material plastic properties characterization have been successfully designed, assembled and tested. From the view point of tool component design, the manufacture of the punch head for this plane strain SPT is much easier and more accurate than to make a conventional spherical head.
An FEA model has been established and by the comparison between the experimental and FEM simulation results using genetic algorithms for optimization, a characterization procedure for general material properties has been established. With the application of the method described in this paper, the Ramberg-Osgood parameters have been characterized. This method can be used for other types of materials and material models and has a particular potential advantage for characterization material properties in welded regions. It is virtually a non-destructive method and could be used for in-service material characterization without interruption of service. Further The values of objective function for each
chromosome
0 0.05 0.1 0.15 0.2 0.25 0.3 0.35
0 5 10 15 20
chromosome number
V
alue
of
objec
ti
v
e f
unc
ti
[image:6.595.332.541.82.212.2]on
Figure 8
chromosome number
0 4 8 12 16 20
0 5 10 15 20
Fitness values varies within the generation
fi
tn
e
ss va
lu
[image:6.595.86.278.121.265.2]e
Figure 9
Specimen central vertical displacement, m 0
1000 2000 3000 4000 5000 6000
0.0000 0.0005 0.0010 0.0015
Comparison between the experimental and predicted results
P
unc
h f
or
c
e,
N
experiment results
predicted results
Figure 11
strain,% 0
200 400 600
0 5 10 15 20 25
The predicited Stress strain curve
S
tr
e
ss,
M
P
[image:6.595.92.290.295.469.2]a
[image:6.595.70.270.522.642.2]work will look at the extension of this research to material damage and creep properties characterization.
Acknowledgement
The authors would like to thank Douglas Collier for the manufacture of the tool parts and Andrew Crocket for his help to perform the tests.
References
[1] Manahan, M.P,, Argon, A.S., and Harling O.K., “The development of a miniaturized disk bend test for the determination of post-irradiation mechanical properties,” J. of Nuclear Materials, 103&104, North-Holland Publishing Company, 1981, PP. 1545-1550.
[2] Mao, X., Takahashi, H., “Development of a further miniaturized specimen of 3mm diameter for TEM disk small punch tests”, J. of Nuclear Material, 1987, vol. 150, North Holland Publi. Co., pp44-52.
[3] Parker, J.D., Stratford, G.C., Shaw, N., Spink, G. and Tate, E., “Deformation and fracture processes in miniature disc tests of CrMoV rotor steel”, Proceedings of third international charles parsons turbine conference, Vol.2, Institute of Materials, 1995, pp418-428.
[4] F. Dobes and K. Milicka, “On the Monkman-Grant relation for small punch test data”, Materials science and Engineering, A336(2002) pp245-248.
[5] R. Sturm, M. Jenko and B. Ule, “A creep-properties evaluation of P91 steel weldments using short-term testing”, Materiali in Technologije 36(6) pp319-324(2002).
[6] R.W. Evans and M. Evans, “Numerical modeling of small disc creep test”, Material Science and Technology, vol.22,No.10, 2006, pp1155-1162.
[7] R. Hurst V. Bicego and J. Foulds, “Small Punch Testing for FCreep – Progress in Europe”, Proceeding of CREEP8, Eighth International Conference on Creep and Fatigue at Elevated Temperatures, July 22-26, 2007, San Antonio, Texas.
[8] Y. Li and R. Sturm, “Determination of creep properties from small punch test”, Proceeding of PVP2008, 2008 ASME Pressure and Piping Division Conference, July 27-31, Chicago, Illinois, USA.
[9] Xiang Ling, Yangyan Zheng, Yingjun You and Yuxin Chen, “Creep damage in small punch creep specimens of Type 304 stainless steel” International Journal of Pressure Vessels and Piping, Volume 84, Issue 5, May 2007, Pages 304-309
[10] M. Abendroth and M. Kuna, “Determination of
deformation and failure properties of ductile materials by means of the small punch test and neural networks”, Computational Materials Science, 28(2003), pp633-644.
[11] M. Abendroth and M. Kuna, “Identification of ductile damage and fracture parameters from the small punch test using neural networks”, Engineering Fracture Mechanics, 73(2006),pp710-725.
[12] C.F. Castro, C.A.C. Antonio and L.C. Sousa, “Optimisation of shape and process parameters in metal forging using genetic algorithms”, J. of Materials Processing Technology, 146(2004), pp356-364.