ON THE RATCHET ANALYSIS OF A CRACKED WELDED PIPE
Tianbai Li, Haofeng Chen*, Weihang Chen, James Ure
Department of Mechanical Engineering, University of Strathclyde, Glasgow, G1 1XJ, UK
Abstract: This paper presents the ratchet limit analysis of a pipe with a symmetric crack in a
mismatched weld by using the extended Linear Matching Method (LMM). Two loading conditions are considered: i) a cyclic temperature load and a constant internal pressure; and ii) a cyclic temperature load and a constant axial tension. Individual effects of i) the geometry of the Weld Metal (WM), ii) the size of the crack, iii) the location of the crack and iv) the yield stress of WM on the ratchet limits, maximum temperature ranges to avoid ratchetting and limit loads are investigated. Influence functions of the yield stress of WM on the maximum temperature ranges and limit loads are generated. The results confirm the applicability of the extended LMM to the cracked welded pipe.
Keywords: shakedown, ratchet limit, limit load, crack, welded pipe
1 Introduction
The circumferential butt welded pipes are widely used in nuclear power plants and usually subjected to complex varying thermal and mechanical loads [1-2]. Under such loads, the pipes may fail either from the accumulated plastic deformations during the increasing load cycles or from the reverse plastic deformations. The former is known as ratchetting, which leads structures to incremental collapse; the latter is named plastic shakedown, which gives rise to local low cycle fatigue. For a pipe with a crack in the weld, the elastic stress singularity at the crack tip violates the elastic shakedown condition, hence the non-existence of a finite shakedown limit. Therefore the ability to calculate the ratchet limit of the cracked pipe is particularly desirable. The obtained ratchet limit may then be used to calculate the ratchetting reference stress to predict material deformation and rupture [3].
Ratchetting analysis of loaded structures has been investigated by many researchers in past decades [2-20]. The complexity of ratchetting means that analytical solutions are rare, and thus
* Corresponding author.
incremental Finite Element Analysis (FEA) is widely used. Incremental FEA can only show if ratchetting occurs, and therefore many calculations are required to generate the Bree-like diagram [4].
In order to overcome the difficulties of the step-by-step elasto-plastic FEA, a number of direct methods based upon the Koiter's [5] kinematic and/or the Melan's [6] static theorems have been developed including: i) the nonlinear superposition method [7]; ii) mathematical programming methods [8-10]; iii) the Generalized Local Stress Strain (GLOSS) r-node method [11]; iv) the Elastic Compensation Method (ECM) [12]; and v) the Linear Matching Method (LMM) [13-20]. The LMM is distinguished from other simplified methods by ensuring that equilibrium and compatibility are satisfied at each stage. The LMM has been shown to give accurate shakedown analysis to complex geometries and load histories [13, 14]. The LMM has also been extended to evaluate ratchet limits [15-18] for defect-free components subjected to cyclic load conditions from two-load extremes [15-17] to multi-load extremes [18]. However, the application of the latest LMM ratchet limit method [18] to structures with a discontinuity in the geometry and material has not yet been undertaken.
In this paper, the method is used to address ratchet limits of a circumferentially welded pipe with a circumferential crack in the weld subjected to a varying temperature load and a constant i) internal pressure or ii) axial tension. The remainder of this paper comprises five parts. In section 2, the LMM ratchet limit method is briefly described. Section 3 presents the pipe geometry and material properties. This is followed by the FE model of the pipe. The ratchet limit analysis is presented in Section 5. In this section, the effects of strength of the WM, location and size of the crack, width of the WM, and finally the coefficient of thermal expansion of the WM on the ratchet limit are discussed.
2 Linear Matching Method
Consider a body of volume, V, with a surface area
S
. The body is subjected to varying mechanical loads, P (xi,t)V
, over a fraction of the surface area, Sp, and varying thermal loads )
, (xi t
V
θ . A zero displacement rate condition is applied over the remainder of the surface area, Su
such that u&i =0. Over a time cycle 0≤t ≤Δt , these loads are decomposed into constant and cyclic components such that
) , ( ) ( ) ,
(x t P x P x t
Pv i =λ i + i
, (xi,t) (xi) (xi,t)
v λθ θ
where λ is a load multiplier.Pand θ are the constant mechanical and thermal load distribution respectively. Pand θ are the cyclic mechanical and thermal load respectively. The corresponding linear elastic stress history σˆijis then given as
) , ( ˆ ) , ( ˆ ) ( ) , (
ˆ x t x xk t ij xk t
P ij k ij k ij θ σ σ σ λ
σ = + + (2) where σij(xk)is the elastic stress due to P and θ . ˆ (xk,t)
P ij
σ and σˆijθ(xk,t) are the elastic stress
histories corresponding to P(xk,t)and θ(xk,t), respectively. The cyclic stress history σij(xk,t) over the time cycle is given by
(x ,t) ˆ (x ,t) (x ) r(xk,t) ij k ij k ij k
ij σ ρ ρ
σ = + + (3) where ρij(xk) is a constant residual stress and corresponds to λσij(xk). (xk,t)
r ij
ρ is a changing residual stress corresponding to P
ij
σˆ and σθ
ij
ˆ during a cycle and satisfies: ) ( ) , ( ) 0 , ( 0 k ij k r ij k r
ij x ρ x t ρ x
ρ = Δ = (4) where 0( )
k ij x
ρ is the constant element of
ρ
ijrConsider an energy function
dtdV I c ij V t ij c ij c
ij λ σ σ ε
ε& =∫ ∫Δ − &
0
) (
) ,
( (5) where
ε
&ijc is a kinematically admissible strain rate.c ij
σ
represents a stress at yield corresponding toc ij
ε& .
The determination of the ratchet limit is implemented by a two-stage nonlinear minimisation procedure: i) a changing residual stress
ρ
ijr is computed by an incremental minimisation of theenergy function I and satisfies Eq. (4), with the application of the cyclic load; and ii) a global minimisation of the upper bound shakedown theorem is performed to evaluate the additional constant load, which leads the load state to the ratchet limit.
Consider a body subjected to a cyclic load involving multi-load extremes. It is assumed that plastic strains only occur at the extremes corresponding to the time instants tk (k=1,...,K ). The
instants tk represents a sequence of time points in the cyclic load history such that
∑ Δ = Δ = K k k p ij c ij t
1 ε ( )
ε , where ( k)
p ij t
ε
Δ is the plastic strain increment at tk. Hence we have the function
dV t t I I k ij k r ij k ij V K k k ij K k k c
ij λ σ σ ρ ε
ε =∑ =∫ ∑ − − Δ
=
= ( ˆ ( ) ( ))
) , (
1 1
& (6) where
= +∑ Δ = k
m ij m ij
k r
ij t t
1
0 ( )
)
( ρ ρ
) 2 /( ) ) ( ) ( ˆ ) ( ˆ ( )
( k k
r ij k ij k P ij k p
ij t σ t σ t ρ t μ
ε = + θ + ′
Δ (9) where T
ij
ε
Δ is compatible and Δρij satisfies equilibrium. An upper 'dash' refers to deviatoric
components. μk is an iterative shear modulus and determined by the linear matching condition
[15,16]
3 ( ( )) 2 k p ij y k t
ε
ε
σ
μ
Δ= (10)
where
σ
y is the yield stress and ( (k)) p ij tε
ε Δ is the effective plastic strain increment.
The changing residual stress is computed by the minimisation of the I via the iterations among Eqs. (7-10). We denote n( k)
ij t
ρ
Δ as an evaluated changing residual stress at kth load instance after th
n iteration, where k=1,...,K and n=1,...,N . At nth
iteration, ( k)
n ij t
ρ
Δ is computed for all K load instances. The converged solution occurs if the summation of all changing residual stresses at
th
N iteration vanishes, i.e. ( ) 0
1 = ∑ Δ = k K k N ij t
ρ . Hence the constant residual stress 0
ij
ρ can also be determined by
∑ ∑ Δ = = = K k N n k n ij ij t 1 1
0 ρ ( )
ρ (11) The ratchet limit can be determined by the minimisation of the upper bound shakedown theorem [15], with the elastic solution augmented by the changing residual stress r( k)
ij t
ρ . The theorem gives
dV t t
dV t
t k ij k
v K k c ij k ij V K
k1σij(k)Δε ( ) =∫ ∑1σ ( )Δε ( )
∫ ∑
=
= (12) Where σijis given in Eq. (3). For the application of the von Mises yield criterion, we have
t t dV ij tk dV
v K k y k ij k v K k c
ij( ) ( ) ( ( ))
1
1σ ε σ ε ε
Δ ∫ ∑ = Δ ∫ ∑ =
= (13) Thus, an upper bound ratchet limit multiplier is given by solving Eq. (12) with consideration of Eqs. (2), (3) and (13).
∫ ∑ Δ
Δ +
∫∑ Δ −∫ ∑ +
=
=
= =
V K
k ij ij k
k ij k r ij k
V k ij
K k V K k P ij k ij y dV t dV t t t t dV t 1 1 1 ) ( ) ( )) ( ) ( ) ( ( )) ( ( ε σ ε ρ σ σ ε ε σ λ θ (14)
where ε(Δεij(tk))= 32ΔεijΔεij is the effective plastic strain increment at tk . This multiplier
λ
gives the capacity of the body subjected to cyclic loads Pand θ to withstand constant loads Pand
3 Pipe Geometry and Material Properties
Consider a circumferentially welded pipe, with a circumferential symmetric inner/central/outer surface crack in the weld (Fig. 1). The inhomogeneous pipe includes two different material domains - Parent Material (PM) and Weld Metal (WM). Each material is isotropic, elastic perfectly plastic and satisfies the von Mises yield criterion. The length L, inner radius Ri, wall thickness w, crack length a and weld width H are shown in Fig. 1 and Table 1. The material properties including the yield stress σy, Young’s modulus E, Poisson’s ratio
ν
, conductivity k and coefficient of thermal expansionα
adopted in this paper for the baseline calculation are given in Table 2, where WM and PM have same values of E, k andν
.4 Loading Conditions and Finite Element Modelling
In this analysis, the pipe is subjected to two loading conditions: i) Δθ +p, a cyclic temperature θ
Δ and a constant internal pressure p (with closed end conditions) (Fig. 2a) or (ii) Δθ +T , a cyclic temperature Δθ and a constant axial tension T (Fig. 2b).
Fig. 2 shows the two-dimensional axisymmetric model, with a symmetry condition applied in the axial direction. The end of the pipe is constrained to remain in-plane, simulating the expansion of a long pipe. The closed end condition of the pipe is simulated by applying an equivalent axial tension
) 2
/( 2
2
w w R pR
q= i i + .
It is assumed that the ambient air temperature outside of the pipe is θ0, and the operating
temperature of the fluid contained within the pipe fluctuates between ambient and a higher value, θ
θ0 +Δ (Fig. 3). Due to the dissimilar material in the pipe, the applied cyclic thermal loading may be constructed by three thermal stress extremes: i) a thermal stress field produced by a linear temperature gradient through the wall thickness; ii) a thermal stress field due to the different thermal expansion coefficients between the PM and WM occurring at the highest uniform temperature; and iii) a zero thermal stress field simulating a uniform ambient temperature. If θ0 is
zero, the maximum effective elastic thermal stresses for these three extremes can be determined by the maximum temperature difference Δθ . Hence the thermal load history can be characterised by
θ Δ .
axisymmetric heat transfer quadrilateral elements with reduced integration scheme are used for the heat transfer analysis (Fig. 4).
5 Results and Discussions
In this paper, a mismatch rate
r
in the yield stress between the WM and the PM is introducedPM y WM y
r =σ /σ (15)
5.1 Effect of Crack Location and Yield Stress of Weld Metal σWMy on the Ratchet Limits
In this subsection, pipes with inner/central/outer surface cracks in the weld are considered. The values of yield stress of the WM
σ
WMy used are 115, 230 and 460MPa, respectively, andPM y
σ is held constant at 230MPa (i.e. r=0.5, 1 and 2).
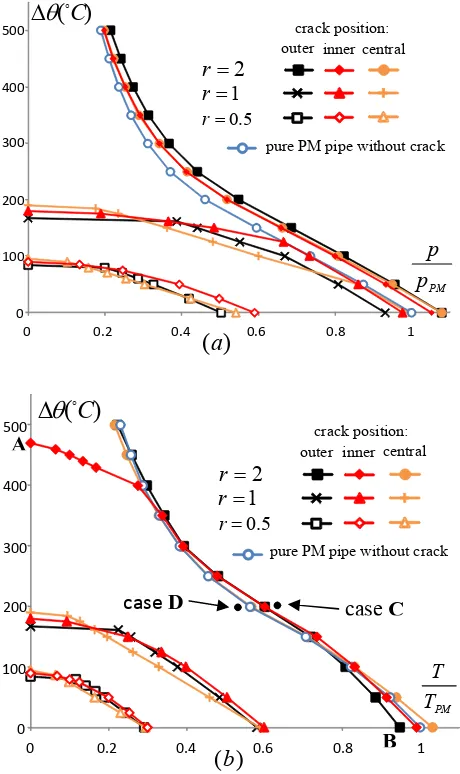
Fig. 5 show the converged ratchet limit interaction curves of cracked welded pipes with r=0.5, 1, 2 and a pure PM pipe (r=1) without a crack, subjected to Δθ+p(Fig. 5a) or Δθ+T (Fig. 5b). In this diagram, a normalised internal pressurep/ pPM(or axial tension T/TPM) and a temperature
range Δθ are chosen as an abscissa and an ordinate respectively. pPM and TPM are the limit internal pressure and limit axial tension of the pure PM pipe without a crack, respectively.
In the Fig. 5, it can be seen that only the ratchet limit boundaries of the pure PM pipe without a crack and the welded pipe (r=2) with an inner/central/outer crack (excluding an inner crack in Fig. 5b) exhibit typical Bree-like diagrams. The ratchet limit boundaries in other cases interacts the y-axis. For example, the point A in Fig. 5b represents a maximum temperature range to avoid ratchetting for an applied cyclic thermal load and a particular form of a potential mechanical load. The point B denotes the limit load for the applied mechanical load.
Fig. 5 shows that for all r, the three different locations of the symmetric crack have little effect on the ratchet limit boundaries, except for the case of r =2 and Δθ ≥400oC in Fig. 5b, where the
inner surface crack produces much lower ratchet limits than the central crack and outer surface crack.
It can be observed that the ratchet limit boundaries including the limit internal pressure / axial tension and the maximum temperature range to avoid ratchetting reduce with the decreasing r. It is also noted that for the case of Δθ+p, when r≥1 and Δθ<100oC ( Fig. 5a), the change in
r
hasThree typical failure modes are given in Fig. 6 which shows the non-ratchetting/ratchetting mechanisms for the inner cracked welded pipe (Fig. 5a), subjected to a cyclic temperature range
θ
Δ and a constant internal pressure (p/pPM =0.15). When r =2 and Δθ =500oC(Fig. 6a), no
ratchetting mechanism occurs and the pipe still has a capacity to resist an additional internal pressure. When r =1 , Δθ =88oC (Fig. 6b) or r=0.5 , Δθ =185oC (Fig. 6c), a ratchetting
mechanism occurs at the weld material, and the pipe will experience incremental plastic collapse after a limited number of cycles.
It is particularly interesting that for the case of r=2, after the pipe is subjected to the cyclic temperature range Δθ ≥470oC , the pipe with an inner surface crack can withstand an internal
pressure but cannot withstand an axial tension. This is because the thermal stress in the plastic zone could be reduced by the superposition of the mechanical stress caused by an internal pressure, but not by an axial tension.
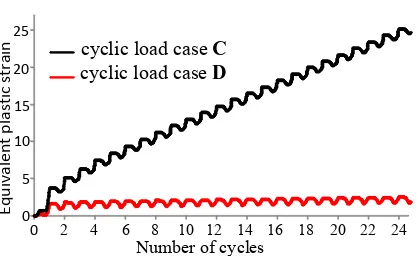
Consider two load cases C and D (Fig. 5b), which are just outside and inside the predicted ratchet limit domain at temperature range Δθ =200oC . The plastic strain histories (Fig. 7)
calculated by the ABAQUS step-by-step analysis verified the accuracy of LMM ratchet limit boundary by showing that i) under the load case C, the maximum equivalent plastic strain increases with load cycles to give a strong ratchetting mechanism; and ii) under the load case D, the maximum equivalent plastic strain ceases to increase after 20 load cycles, giving a non-ratchetting mechanism.
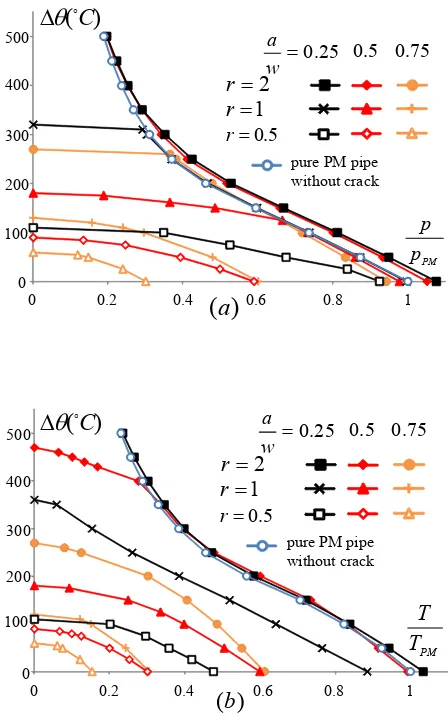
5.2 Effect of Crack Size
Three symmetric crack lengths are considered: a=0.25w, 0.5w and 0.75w. For each crack length, three yield stresses are considered as per the previous sections, r=0.5, 1 and 2.
Fig. 8 gives ratchet limit interaction curves of the pipe subjected to Δθ+ p (Fig. 8a) or
T
+
Δθ (Fig. 8b). It shows that i) when r≤1 (excluding the case of r=1 and a≤0.5w in Fig. 8a), the ratchet limit boundaries including the limit internal pressure / axial tension and the maximum temperature range to avoid ratchetting reduces with the increasing a ; ii) when r =2 and
C o 300
<
5.3 Effect of Weld Width
In order to study the effect of weld width, values of H =0.25w, 0.5w and
w
were chosen. Similarly, all limits for three different width are computed based on three different yield stresses of WM: r=0.5, 1 and 2.Fig. 9 gives ratchet limit interaction curves of the pipe subjected to Δθ + p (Fig. 9a) or
T
+
Δθ (Fig. 9b). It shows that for all r(excluding the cases of r =2 and H =0.25w), the change in H has little effect on the ratchet limit diagrams.
Fig. 9b shows that when r =2, the width H =0.25w gives a smaller limit tension than that of
w
H =0.5 and w. This is because the pipe failure zone is a 45 degree inclined strip which is from the crack tip to the side boundary. Hence, the smaller width H of WM means that this 45 degree slip line must travel further through weaker parent material, which causes the lower limit tension of the pipe. The width H =0.25w also gives a smaller maximum temperature range to avoid ratchetting than that of H =0.5w and w due to the aforementioned reason.
5.4 Effect of Coefficient of Thermal Expansion of Weld Metal αWM
Three values of αWM αPM =0.5
, 0.95 and 2 were chosen. The thermal expansion of the PM material was given a fixed value of αPM =1.8 ×10⁻⁵ oC−1. All limits for the three different αWM are computed based on three different yield stresses of WM: r=0.5, 1 and 2.
Fig. 10 gives ratchet limit interaction curves of the pipe subjected to Δθ+ p(Fig. 10a) or
T
+
Δθ (Fig. 10b). It shows that for all
r
, i) the change in αWMhas no effect on the limit internal pressure (or limit axial tension) due to the purely mechanical nature of the load; and ii)
2 / PM =
WM α
α gives a smaller maximum temperature range to avoid ratchetting in comparison with the cases of αWM/αPM =0.5 and 0.95. This is because a larger difference in thermal expansion
coefficients between the PM and the WM leads to a larger field of high thermal stress around the interface between two materials, which may interact with the another high stress field either around the crack tip or in the parent material, thus causing failure at smaller temperature range.
5.5 Discussions
In the previous subsections, the results show that five parameters -- the yield stress of WM WM y
coefficient
α
WMof WM have the different effects on the ratchet limits, maximum temperature ranges to avoid ratchetting, and limit loads. Among these parameters, WM
y
[image:9.595.87.537.315.567.2]σ is the most sensitive parameter to the ratchet limit boundary, and the crack location is the least sensitive one. A further investigation of the effect of these parameters is given in the Fig. 11 and Tables 3-6.
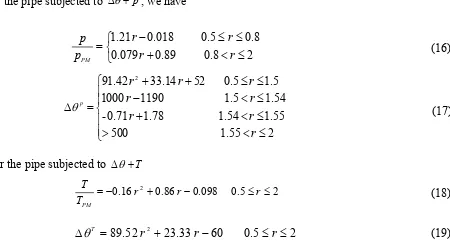
Fig. 11 shows how the yield stress of WM affects the ratchet limit of the pipe with an inner surface crack. It suggests that the higher WM yield strength leads to a larger limit load and a larger maximum temperature range to avoid ratchetting for both loading cases. It is noted that for the case of Δθ+ p, there is a rapid increase in limit load up to r=0.75, with the increases being small in comparison when r>0.75 (shown in Fig. 11a). When r>1.5, the maximum temperature range to avoid ratchetting steeply rises with the increasing r, shown in Fig. 11b. All trend lines are fit to the data to give the functions, shown in Eqs. (16-19).
For the pipe subjected to Δθ+p, we have
⎩ ⎨ ⎧ ≤ < + ≤ ≤ − = 2 0.8 0.89 0.079 0.8 0.5 0.018 21 . 1 r r r r p p PM (16) ⎪ ⎪ ⎩ ⎪ ⎪ ⎨ ⎧ ≤ < > ≤ < + ≤ < − ≤ ≤ + + = Δ 2 1.55 500 1.55 1.54 1.78 0.71 -1.54 1.5 1190 1000 1.5 0.5 52 14 . 33 42 . 91 2 r r r r r r r r p θ (17)
For the pipe subjected to Δθ+T
2 0.5 098 . 0 86 . 0 16 .
0 2 + − ≤ ≤
−
= r r r
T T
PM (18) 2 0.5 60 33 . 23 52 .
89 2 + − ≤ ≤
=
ΔθT r r r
(19) where pPM and TPMare the limit internal pressure and limit axial tension of the pure PM pipes without a crack, respectively. Δθp or ΔθT represents the maximum temperature range to avoid ratchetting for the pipe subjected to an applied cyclic thermal load Δθ and a potential internal pressure p or axial tension T , respectively.
6 Conclusion
The extended Linear Matching Method (LMM) is successfully applied in this study for the ratchet limit analysis of circumferentially welded pipes containing a circumferential crack subjected to a cyclic temperature Δθ and a constant i) internal pressure p or ii) axial tension T. Based on the results obtained in this study, the following conclusions are given: i) When compared with a pure Parent Material (PM) pipe without a crack, the discontinuity in material (due to the Weld Metal (WM)) and in geometry (due to a crack) may lead to a significant change in the ratchet limit boundary including the maximum temperature range to avoid ratchetting and limit load; ii) Among five parameters, variation of the yield stress WM
y
σ of the WM has the largest impact on the ratchet limits. The limit load and the maximum temperature range to avoid ratchetting rise with the increasing WM
y
σ . The relationship between them has been formulated; iii) An increase in the symmetric crack length adecreases the maximum temperature range to avoid ratchetting and limit load, but the crack location has the least effect on the ratchet limit out of the parameters considered in this work; iv) The weld width Hhas little effect on the limits for all r, except for the case of
2
=
r and H =0.25w when the pipe is under axial tension, where the ratchet limit boundary is significantly reduced in comparison with cases of r =2 and H ≥0.5w; v) The large difference in the coefficient of thermal expansion between the WM and the PM significantly decreases the maximum temperature ranges to avoid ratchetting, but the limit load is unaffected by any changes in αWM/αPM .
Acknowledgements
The authors gratefully acknowledge the support of the Engineering and Physical Sciences Research Council of the United Kingdom (EP/G038880/1), and the University of Strathclyde during the course of this work.
References
1. Brickstad, B., and Josefson, B.L., 1998, “A parameter study of residual stress in multi-pass butt-welded stainless steel pipes”, International Journal of Pressure Vessels and Piping, 75, pp.11-25. 2. Roos, E., Schuler, X., and Stumpfrock, L., 2009, “Numerical evaluation of ratchetting effect on
3. Carter, P., 2005, “Analysis of cyclic creep and rupture”. Part 1: boundary theorems and cyclic reference stress. International Journal of Pressure Vessels and Piping, 82, pp.15-26.
4. Bree, J., 1989, “Plastic deformation of a closed tube due to interaction of pressure stresses and cyclic thermal stresses”. International Journal of Mechanical Sciences,; 31(11-12), pp.865-892. 5. Koiter, W.T., 1960, “General theorems for elastic plastic solids”. Progress in solid mechanics,
Sneddon JN and Hill R, eds., North Holland, Amsterdam, 1, pp.167-221.
6. Melan, E., 1936, “Theorie statisch unbestimmter systeme aus ideal-plastichem baustoff”. Sitzungsber. d. Akad. d. Wiss., Wien 2A 145, pp.195–218.
7. Muscat, M., Mackenzie, D., and Hamilton, R., 2003, “Evaluating shakedown by non-linear static analysis”. Computers and Structures, 81, pp.1727-1737.
8. Vu, D.K., Yan, A.M., and Nguyen-Dang, H., 2004, “A primal–dual algorithm for shakedown analysis of structures”. Computer Method in Applied Mechanics and Engineering, 193, pp.4663-4674.
9. Staat, M., and Heitzer, M., 2001, “LISA a European project for FEM-based limit and shakedown analysis”. Nuclear Engineering and Design, 206, pp.151-166.
10.Chen, H.F., Liu, Y.H., Cen, Z.Z. and Xu, B.Y., 1999, “On the Solution of Limit Load and Reference Stress of 3-D Structures under Multi-loading Systems”. Engineering Structures, 21, pp. 530-537.
11.Seshadri, R., 1995, “Inelastic evaluation of mechanical and structural components using the generalized local stress strain method of analysis”. Nuclear Engineering and Design, 153(2-3), pp.287-303.
12.Mackenzie, D., Boyle, J.T., and Hamilton, R., 2000, “The elastic compensation method for limit and shakedown analysis: a review”. Trans IMechE, Journal of Strain Analysis for Engineering Design, 35(3), pp.171-188.
13.Chen, H.F., and Ponter, A.R.S., 2001, “Shakedown and limit analyses for 3-D structures using the Linear Matching Method”. International Journal of Pressure Vessels and Piping, 78, pp.443– 451.
14.Chen, H.F., and Ponter, A.R.S., 2005, “Integrity assessment of a 3D tubeplate using the linear matching method”. Part 1. Shakedown, reverse plasticity and ratchetting, International Journal of Pressure Vessels and Piping, 82(2), pp.85-94.
16.Chen, H.F., and Ponter, A.R.S., 2001, “A method for the evaluation of a ratchet limit and the amplitude of plastic strain for bodies subjected to cyclic loading”. European Journal of Mechanics, A/Solids, 20(4), pp.555-571.
17.Chen, H.F., and Ponter, A.R.S., 2006, “Linear Matching Method on the evaluation of plastic and creep behaviours for bodies subjected to cyclic thermal and mechanical loading”. International Journal for Numerical Methods in Engineering, 68, pp.13-32.
18.Chen, H.F., 2010, “A direct method on the evaluation of ratchet limit”. Journal of Pressure Vessel Technology. 132, 041202.
19.Chen, H.F., Ponter, A.R.S., and Ainsworth, R.A., 2006, “The Linear Matching Method applied to the high temperature life integrity of structures”, Part 1: Assessments involving constant residual stress fields. International Journal of Pressure Vessels and Piping, 83(2), pp.123-135. 20.Chen, H.F., Ponter, A.R.S., and Ainsworth, R.A., 2006, “The Linear Matching Method applied
Table Captions
Table 1 Shape parameters of a welded pipe with a symmetric crack Table 2Material properties of a welded pipe
Table 3 Limit load and maximum temperature range of the pipe with the different crack locations and the different r , where a/w=0.5, H/w=0.5 and αWM /αPM =0.95 . The pipe is subjected to (a) Δθ+p or (b) Δθ+T
Table 4 Limit load and maximum temperature range of the inner cracked pipe with the different crack length
a
and the differentr
, where H/w=0.5 and αWM /αPM =0.95. The pipe is subjected to (a) Δθ+p or (b) Δθ+TTable 5 Limit load and maximum temperature range of the inner cracked pipe with the different thickness of the WM H and the different
r
, where a/w=0.5 and αWM /αPM =0.95. The pipe is subjected to (a) Δθ+p or (b) Δθ+T
Table 6 Limit load and maximum temperature range of the inner cracked pipe with the different WM
α and the different
r
, where αPM =1.9(×10−5 −1C o
Table 1 Shape parameters of a welded pipe with a symmetric crack
) (mm
w L Ri
a
H40
5w7
.
5
w
0
.
5
w
0.5wTable 2 Material properties of a welded pipe
PM y
σ
(MPa)
WM y
σ (MPa)
E
(GPa)PM
α
) 10 ( −5 oC−1
WM
α
) 10 ( −5 oC−1
k
)
(Wm−1oC−1
ν
[image:14.595.99.502.408.509.2]Table 3 Limit load and maximum temperature range of the pipe with the different crack locations and the different r, where a/w=0.5, H/w=0.5and αWM /αPM =0.95. The pipe is subjected to
(a) Δθ+p or (b) Δθ+T
Normalised limit load PM
p
p/ (T/TPM)
Maximum temperature range Δθpor ΔθT(
C
o )
Loading condition
crack location
5 . 0 =
r
r
=
1
r
=
2
r=0.5r
=
1
r
=
2
inner 0.59 0.98 1.05 90 180 - outer 0.50 0.93 1.08 84 167 -
p
+
Δ
θ
central 0.54 0.99 1.08 95 190 - inner 0.30 0.60 0.99 90 180 470 outer 0.29 0.58 0.95 84 167 - T
+ Δθ
central 0.29 0.59 1.03 95 190 -
Table 4 Limit load and maximum temperature range of the inner cracked pipe with the different crack length
a
and the differentr
, where H/w=0.5 and αWM /αPM =0.95. The pipe issubjected to (a) Δθ+p or (b) Δθ+T
Normalised limit load
PM
p
p/ (T/TPM )
Maximum temperature range Δθpor ΔθT
(oC)
Loading
condition crack size
w
a/ r=0.5
r
=
1
r
=
2
r
=
0
.
5
r =1 r =20.25 0.93 1.00 1.08 110 320 - 0.50 0.59 0.98 1.05 90 180 - p
+ Δ
θ
0.75 0.30 0.60 0.94 60 130 270 0.25 0.48 0.89 1.03 110 360 - 0.50 0.30 0.60 0.99 90 180 470 T
+ Δ
θ
[image:15.595.92.502.512.678.2]Table 5 Limit load and maximum temperature range of the inner cracked pipe with the different thickness of the WM Hand the different
r
, where a/w=0.5and αWM /αPM = 0.95. The pipe issubjected to (a) Δθ+p or (b) Δθ+T
Normalised limit load
PM
p
p/ (T/TPM)
Maximum temperature range Δθpor ΔθT (oC)
Loading condition
WM width
w
H
/
r
=
0
.
5
r
=
1
r
=
2
r =0.5r
=
1
r
=
2
0.25 0.72 0.98 1.02 90 180 420
0.5 0.59 0.98 1.05 90 180 -
p
+ Δ
θ
1 0.59 0.98 1.09 80 160 -
0.25 0.37 0.60 0.84 90 180 300
0.5 0.30 0.60 0.99 90 180 470
T
+ Δ
θ
1 0.30 0.60 1.05 80 160 -
Table 6 Limit load and maximum temperature range of the inner cracked pipe with the different WM
α and the different
r
, where αPM =1.9(×10−5 oC−1), a/w=0.5 and H/w=0.5. The pipe issubjected to (a) Δθ+p or (b) Δθ+T
Normalised limit load
PM
p
p/ (T/TPM)
Maximum temperature range Δθp or ΔθT
(oC)
Loading
condition
α
WM /α
PM5 . 0 =
r
r
=
1
r
=
2
r=0.5r
=
1
r
=
2
0.5 0.59 0.98 1.05 100 200 470
0.95 0.59 0.98 1.05 90 180 -
p
+
Δ
θ
2 0.59 0.98 1.05 52 110 220
0.5 0.30 0.60 0.99 100 200 410
0.95 0.30 0.60 0.99 90 180 470
T
+
Δ
θ
[image:16.595.92.505.512.685.2]Figure Captions
Fig.1 Welded pipe configurations with (a) an inner surface crack, (b) a central crack and (c) an outer surface crack
Fig. 2 Thermal and mechanical loads and boundary conditions of the cracked welded pipe: (a) Δθ+p or (b) Δθ+T
Fig. 3 The operating temperature history of the fluid contained within the welded pipe Fig. 4 Finite element mesh of the welded pipe with an inner crack a=0.5w
Fig. 5 Ratchet limit interaction curves of the welded pipe with the different r and the different crack locations. The pipe is subjected to (a) Δθ+p or (b) Δθ+T.
Fig. 6 The non-ratchetting/ratchetting mechanisms for the inner cracked welded pipe (Fig. 5a) subjected to a cyclic temperature range Δθ and a constant internal pressure (p/ pPM =0.15), when (a) r=2, Δθ =500oC (no ratchetting mechanism), (b) r=1, Δθ =185oC (ratchetting
mechanism in WM) and (c) r=0.5, Δθ =88oC (ratchetting mechanism in WM)
Fig. 7 Abaqus verification of the ratchet limit for the cyclic temperature of Δθ =200oC using
detailed step by step analysis
Fig. 8 Ratchet limit interaction curves of the welded pipe with the different crack sizes
a
and the differentr
. The pipe is subjected to (a) Δθ+p or (b) Δθ+TFig. 9 Ratchet limit interaction curves of the pipe with the different thicknessH of the WM and the different
r
. The pipe is subjected to (a) Δθ+p or (b) Δθ+TFig. 10 Ratchet limit interaction curves of the pipe with the different thermal expansion coefficients of the WM αWMand the different
r
, where αPM =1.9(×10−5 oC−1). The pipe is subjected to(a) Δθ+p or (b) Δθ+T
Fig. 11 The effect of the yield stress of WM WM y
Fig.1 Welded pipe configurations with (a) an inner surface crack, (b) a central crack and (c) an outer surface crack
Fig. 2 Thermal and mechanical loads and boundary conditions of the cracked welded pipe: (a) Δθ+p or (b) Δθ+T
Centre-line of weld
Centre-line
of the pipe
θ
θ
0+
Δ
T
)
(
b
0
θ
Centre-line
of the
pi
pe
θ
θ
0+
Δ
p
)
(
a
q
Centre-line of weld
0
θ
) (a
Ce
n
tr
e
‐
line
of
th
e
pi
p
e
PM
WM
L H a
i
R W
) (b
PM
WM a
PM
WM
a
[image:18.595.117.471.480.726.2]Fig. 3 The operating temperature history of the fluid contained within the welded pipe
Fig. 4 Finite element mesh of the welded pipe with an inner crack a=0.5w
)
(
t
θ
θ
θ
0+
Δ
0
θ
t
2
t
1
[image:19.595.213.373.483.620.2]
Fig. 5 Ratchet limit interaction curves of the welded pipe with the different
r
and the different crack locations. The pipe is subjected to (a) Δθ+p or (b) Δθ+T.0 100 200 300 400 500
0 0.2 0.4 0.6 0.8 1
outer inner central 2
=
r 1
=
r
5 . 0
=
r
pure PM pipe without crack crack position:
PM
T T
) (b
A
B
caseC
case D
) (oC θ
Δ
0 100 200 300 400 500
0 0.2 0.4 0.6 0.8 1
outer inner central 2
=
r
1
=
r
5 . 0
=
r
pure PM pipe without crack crack position:
PM
p p
) (a
) (oC θ
Fig. 6 The non-ratchetting/ratchetting mechanisms for the inner cracked welded pipe (Fig. 5a) subjected to a cyclic temperature range Δ
θ
and a constant internal pressure ( p/pPM =0.15), when(a)
r
=
2
, Δθ =500oC (no ratchetting mechanism), (b)r
=
1
, Δθ =185oC (ratchetting mechanism in WM) and (c) r=0.5, Δθ =88oC (ratchetting mechanism in WM)Fig. 7 Abaqus verification of the ratchet limit for the cyclic temperature of Δθ =200oC using
detailed step by step analysis
0 5 10 15 20 25
0 2 4 6 8 10 12 14 16 18 20 22 24
cyclic load case C
cyclic load case D
Number of cycles
Eq
uivalent
p
lastic
strain
crack
)
(a (b) (c)
Failure pattern No failure
PM PM PM
[image:21.595.202.411.573.701.2]Fig. 8 Ratchet limit interaction curves of the welded pipe with the different crack sizes
a
and the differentr
. The pipe is subjected to (a) Δθ+p or (b) Δθ+T0 100 200 300 400 500
0 0.2 0.4 0.6 0.8 1
PM
T T 2
=
r 1
=
r
5 . 0
=
r
pure PM pipe without crack
25 . 0
=
w
a 0.5 0.75
) (b
) (oC θ
Δ 0 100 200 300 400 500
0 0.2 0.4 0.6 0.8 1
PM
p p
) (a
2
=
r 1
=
r
5 . 0
=
r
pure PM pipe without crack
25 . 0
=
w
a 0.5 0.75
) (oC θ
Fig. 9 Ratchet limit interaction curves of the pipe with the different thicknessH of the WM and the different
r
. The pipe is subjected to (a) Δθ+p or (b) Δθ+T0 100 200 300 400 500
0 0.2 0.4 0.6 0.8 1
PM
T T
) (b
2
=
r
1
=
r
5 . 0
=
r
pure PM pipe without crack
25 . 0
=
w H
5 . 0 1 )
(oC θ
Δ 0 100 200 300 400 500
0 0.2 0.4 0.6 0.8 1
2
=
r
1
=
r
5 . 0
=
r
pure PM pipe without crack
25 . 0
=
w H
5 .
0 1
PM
p p
) (a
) (oC θ
Fig. 10 Ratchet limit interaction curves of the pipe with the different thermal expansion coefficients of the WM
α
WMand the different
r
, where αPM =1.9(×10−5 oC−1). The pipe is subjected to (a) Δθ+p or (b) Δθ+T
0 100 200 300 400 500
0 0.2 0.4 0.6 0.8 1
PM
T T
2
=
r
1
=
r
5 . 0
=
r
pure PM pipe without crack
5 . 0
=
PM WM
α α
95 .
0 2
) (b )
(oC θ
Δ
0 100 200 300 400 500
0 0.2 0.4 0.6 0.8 1
PM
p p
) (a
2
=
r
1
=
r 5 . 0
=
r
pure PM pipe without crack
5 . 0
=
PM WM
α α
95 .
0 2
) (oC θ
Fig. 11 The effect of the yield stress of WM WM y
σ on (a) the limit loads and (b) the maximum temperature ranges of the pipe under i) Δθ+p or ii) Δθ+T
0 100 200 300 400 500
0.5 0.7 0.9 1.1 1.3 1.5 1.7 1.9 2.1
( )
CT p θ o
θ Δ Δ ,
r
⎪ ⎪ ⎩ ⎪ ⎪ ⎨ ⎧ ≤ < > ≤ < + ≤ < − ≤ ≤ + + = Δ 2 1.55 500 1.55 1.54 1.78 0.71 -1.54 1.5 1190 1000 1.5 0.5 52 14 . 33 42 . 91 2 r r r r r r r r P θ 2 0.5 60 33 . 23 52 .89 2+ − ≤ ≤
=
ΔθT r r r
temperature range temperature range trend trend p θ Δ T θ Δ ) (b 0 0.2 0.4 0.6 0.8 1 1.2
0.5 0.7 0.9 1.1 1.3 1.5 1.7 1.9 2.1
⎩ ⎨ ⎧ ≤ < + ≤ ≤ − = 2 0.8 0.89 0.079 0.8 0.5 0.018 21 . 1 r r r r p p PM 2 0.5 098 . 0 86 . 0 16 .
0 2+ − ≤ ≤
−
= r r r
T T PM
r
PM PM T T p p ,limit pressure p trend limit tension T trend