City, University of London Institutional Repository
Citation
:
Stankovic, S. B. & Kyriacou, P. A. (2011). Comparison of thermistor linearization techniques for accurate temperature measurement in phase change materials. Journal of Physics: Conference Series, 307(1), 012009. doi: /10.1088/1742-6596/307/1/012009This is the accepted version of the paper.
This version of the publication may differ from the final published
version.
Permanent repository link: http://openaccess.city.ac.uk/13328/
Link to published version
:
/10.1088/1742-6596/307/1/012009Copyright and reuse:
City Research Online aims to make research
outputs of City, University of London available to a wider audience.
Copyright and Moral Rights remain with the author(s) and/or copyright
holders. URLs from City Research Online may be freely distributed and
linked to.
Comparison of thermistor linearization techniques for
accurate temperature measurement in phase change materials
S B Stankovic1,3 and P A Kyriacou1,2,3
1 School of Engineering and Mathematical Sciences, City University London,
Northampton Square, London EC1V 0HB, UK
2 E-mail: [email protected]
Abstract. Alternate energy technologies are developing rapidly in the recent years. A significant part of this trend is the development of different phase change materials (PCMs). Proper utilization of PCMs requires accurate thermal characterization. There are several methodologies used in this field. This paper stresses the importance of accurate temperature measurements during the implementation of T-history method. Since the temperature sensor size is also important thermistors have been selected as the sensing modality. Two thermistor linearization techniques, one based on Wheatstone bridge and the other based on simple serial-parallel resistor connection, are compared in terms of achievable temperature accuracy through consideration of both, nonlinearity and self-heating errors. Proper calibration was performed before T-history measurement of RT21 (RUBITHERM® GmbH) PCM. Measurement results suggest that the utilization of serial-parallel resistor connection gives better accuracy (less than ±0.1°C) in comparison with the Wheatstone bridge based configuration (up to ±1.5°C).
1. Introduction
Recent years have witnessed an increasing development of alternative energy technologies. One of the main objectives in this area can be achieved through application of phase change materials (PCMs) for reduction of energy consumption.
Thermal characterization of PCMs is essential prior to any profound utilization of these materials. Current methods for the investigation of thermo-physical properties of PCMs (e.g. differential scanning calorimeter – DSC) show significant drawbacks especially in terms of the limited sample size [1] [3]. Therefore, the measurements in this study were performed through implementation of the method specifically designed for the investigation of PCMs, the temperature history (T-history) method [3].
Since PCMs are able to store/release large amounts of heat in a narrow temperature range of few degrees, the accurate thermal investigation of these materials is of key importance. However, the majority of the T-history studies in the literature have not emphasized the accuracy of temperature measurements [3]-[8]. Also, it must be taken into an account that sensors for measurements inside the PCM samples need to be small in order to reduce the interference with the phase change process.
Consequently small thermistors (model Newark MA100GG103A) were selected for this investigation [9].
Thermistor’s nonlinearity and self-heating errors are the biggest problems in any temperature application. Several linearization techniques have been developed over the years based on voltage divider or bridge circuits, discrete active elements, and different software solutions [10] [11]. In this paper two techniques based on the Wheatstone bridge design and simple serial-parallel resistor circuit are compared in terms of achievable temperature accuracy.
T-history based characterization of RT21 PCM (RUBITHERM® GmbH) specimen with the expected phase change temperature range between 18°C and 23 °C requires measurements in the range from 11°C to 30 °C [12]. Hence, the thermistor characteristic was linearized in the range from 10°C to 39 °C in order to meet application requirements. Firstly, the linearization methods were theoretically evaluated through calculations of temperature-output voltage dependencies and absolute errors introduced by linearization circuits. Subsequently calibration was performed in 1 °C step temperature program from 10 °C to 39 °C and calibration curves were determined along with the absolute errors. Finally, T-history measurement on RT21 PCM and distilled water as a reference material was performed.
2. Materials and methods
2.1. Temperature sensors
Since the sensors used for temperature measurements in PCMs need to be small, a negative temperature coefficient (NTC) MA100GG103A thermistor model with a 2 mm diameter probe and a 28 wire gauge was used [9]. The temperature dependence of the thermistor resistance Rt is given by the table of resistances with the nominal resistance of 10kΩ at 25 °C. Its operating range is from 0 to 50 °C. Therefore, linearization was performed for the range between 10°C and 39 °C due to indicated application requirements.
2.2. Linearization circuits
The principle of thermistor linearization circuit is to provide relatively linear dependency between temperature and the circuit’s output voltage. In addition to linearization the main goal of this study were accurate temperature measurements. The first design goal was to minimize the thermistor self-heating error ΔT to 0.05 °C. This error defines the value of thermistor maximum permissiblecurrent
Imax as indicated by equation (1):
(1) where C represents thermistor dissipation constant. Critical value (in air) of this constant for the selected thermistor is 2.5∙10-3 mW/°C. Rt,min represents the minimal thermistor resistance in the operating temperature range. The second design goal was to keep the supply voltage VCC equal to the standard value of 5V in order to minimize the circuit’s power dissipation. Nonlinearity error is determined by appropriate temperature-output voltage curve fitting. The first (linear) and the third (cubic) order polynomial fitting equations were determined.
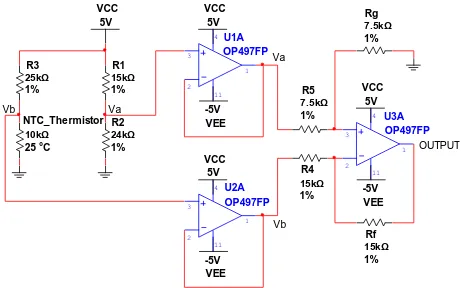
The first linearization circuit is more common and based on Wheatstone bridge (WB) (see figure 1). Since the Wheatstone bridge is just a form of a voltage divider the maximum permissible thermistor current defines the value of resistor R3 and automatically determines the shape of temperature-output voltage curve and nonlinearity error. The values of the two other resistors determine the output voltage range, but do not affect the shape of the temperature-output voltage linearization curve.
configuration allows shaping of temperature-output voltage curve in order to minimize the nonlinearity error and achieve better accuracy in the particular temperature range.
The value of resistor R2 (in figure 2) was determined by equating the second temperature derivative of temperature-output voltage transform function with zero in order to determine the linear region of the transform function.
Figure 1. Wheatstone bridge thermistor linearization circuit.
[image:4.595.84.322.201.345.2]
Figure 2. Serial-parallel resistor thermistor linearization circuit.
2.2.1. Theoretical evaluation of temperature-output voltage dependencies
The temperature-output voltage dependency was calculated for both linearization circuits based on the temperature-thermistor resistance characteristic. Calculations were performed for a temperature range between 10°C and 39 °C. MATLAB® code was developed to determine linear and cubic order polynomial fitting equations of calculated curves [13]. The absolute errors between real and fitted temperature values were calculated (see figure 3 and figure 4).
Figure 3. Theoretical absolute error values when using linear fitting for WB and Ser_Par
linearization circuits.
Figure 4. Theoretical absolute error values when using cubic fitting for WB and Ser_Par
linearization circuits.
2.2.2. Practical evaluation of temperature-output voltage dependencies
Prior to PCM T-history measurements proper sensor calibration for the two linearization circuits was performed. Each sensor was subjected to 1 °C step temperature program from 10 °C to 39 °C. The calibration measurement was performed in a thermally controlled environment. Data acquisition performed utilising a NI 6212 USB 14-bit DAQ card at a sampling rate of 10Hz [14]. Recorded output voltage data were evaluated at known temperatures (10 °C to 39 °C in 1°C step) and the calibration curves were determined. Once again, the calculation of absolute errors between expected and fitted
measured temperature data was evaluated based on MATLAB® linear and cubic calibration curve fitting equations [13].
2.3. PCM T-history experimental protocol
T-history measurement of RT21 PCM was performed in a temperature controlled chamber. PCM sample and distilled water (H2O) reference were subjected to the sharp temperature step between 30°C
and 11 °C and their temperature history recorded along with the environmental temperature. Measurements were performed using both linearization circuits. Data acquisition parameters were the same as those used in the calibration measurements. Temperature values from the measured voltage data were calculated through previously determined calibration curve fitting equations.
3. Results
3.1. Result from theoretical evaluation of thermistor linearization circuits
As indicated in figure 3 linear fitting equations for the theoretical temperature-output voltage relationship for the Wheatstone bridge configuration suggest an unacceptable maximum and mean errors of 1.69 °C and 0.67 °C respectively. On the other hand the errors for the serial-parallel resistor configuration are much smaller, with maximum and mean errors of 0.25 °C 0.07 °C respectively.
Cubic curve fitting gives much better and acceptable results for both, WB and Ser_Par circuits. Again as seen in figure 4, the serial-parallel resistor connection gives one order of magnitude better results (maximum and mean errors of 0.009 °C and 0.002 °C respectively) in comparison with the WB results (maximum and mean errors of 0.06 °C and 0.02 °C respectively).
3.2. Results from the calibration measurements
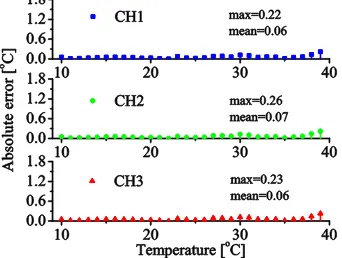
[image:5.595.78.254.485.621.2]As indicated in figure 5 and figure 6 the linear fitting results for calibration based measurement for the two linearization circuits show good agreement with the theoretical predictions; therefore utilization of Ser_Par configuration seems acceptable even for the case of linear curve fitting (maximum and mean errors being not greater than 0.26 °C and 0.07 °C, respectively for all three channels and maximum error occurring high above 30 °C – highest temperature in T-history measurement).
Figure 5. Calibration measurement based absolute error values when using linear fitting for
WB linearization circuit; CH1 – later used for environment (ENV) measurement; CH2 – PCM
[image:5.595.322.493.489.618.2]measurement; CH3 – H2O measurement.
Figure 6. Calibration measurement based absolute error values when using linear fitting for Ser_Par linearization circuit; CH1 – later used for environment (ENV) measurement; CH2 – PCM
measurement; CH3 – H2O measurement.
°C, respectively for all three channels) and entirely for the Ser_Par circuit (maximum and mean errors being not greater than 0.05 °C and 0.01 °C, respectively for all three channels). It is important to emphasize that the absolute error results obtained by measurements are better for the Ser_Par configuration even for the case of linear fitting, in comparison with the WB configuration (either linear or cubic fitting).
Figure 7. Calibration measurement based absolute error values when using cubic fitting for the WB linearization circuit; CH1 – later used for environment (ENV) measurement; CH2 – PCM
[image:6.595.322.493.187.318.2]measurement; CH3 – H2O measurement.
Figure 8. Calibration measurement based absolute error values when using cubic fitting for the Ser_Par linearization circuit; CH1 – later used
for environment (ENV) measurement; CH2 –
PCM measurement; CH3 – H2O measurement.
3.3. Results from PCM T-history measurement
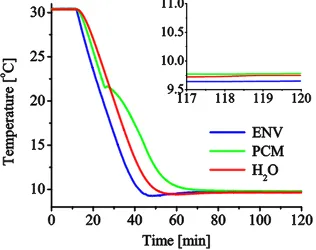
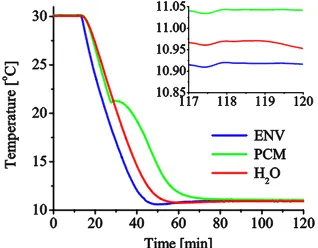
PCM T-history temperature measurement was performed between 30 °C and 11 °C. Results from the WB configuration are shown in figure 9 and figure 10 for the linear and cubic fit respectively. Parts of the graphs are zoomed in at the expected temperature of 11 °C. It can be seen that the linear fit shows a large deviation of around 1.5 °C, while the cubic fit gives a deviation of 0.2 °C. As seen in figure 11 and figure 12 the deviation from 11 °C in the case of the Ser_Par circuit does not exceed 0.1 °C for both, linear and cubic fittings.
Figure 9. The WB configuration - PCM T-history curves when using linear fitting.
Figure 10. The WB configuration - PCM T-history curves when using cubic fitting.
4. Conclusions
[image:6.595.322.480.503.628.2] [image:6.595.78.236.505.630.2]The overall accuracy of the thermistor based measurement systems depend on self-heating and nonlinearity errors. These errors can be reduced by selecting the most appropriate temperature linearization method.
Figure 11. The Ser_Par configuration - PCM T-history curves when using linear fitting.
Figure 12. The Ser_Par configuration - PCM T-history curves when using cubic fitting.
Experimental results in this study showed that contrary to theoretical prediction, a lower absolute error was obtained by measurements performed when using the serial-parallel resistor connection in the case of linear fitting than with those performed with the Wheatstone bridge configuration in the case of cubic fitting. Therefore, it is concluded that the linearization techniques based on voltage divider and bridge circuits do not provide sufficient accuracy. Circuits with additional series or parallel resistors compared to voltage divider circuits enable more flexible linearization and therefore better accuracy in certain temperature ranges of interest.
References
[1] Mehling H and L F Cabeza 2008 Heat and Cold Storage with PCM(Berlin: Springer)
[2]
Castellon C, Günther E, Mehling H, Hiebler S and Cabeza L F 2008 Int. J. Energy Res. 321258-65
[3]
Zhang Y, Jiang Y and Jiang Y 1999 Meas. Sc. Technol. 10 201-5[4] Marin J M, Zalba B, Cabeza L F and Mehling H 2003 Meas. Sc. Technol.14 184-9
[5] Lázaro A, Günther E, Mehling H, Hiebler S, Marin J M and Zalba B 2006 Meas. Sci. Technol.
17 2168–74
[6] Lázaro A, Zalba B, Bobi M, Castellon C, Cabeza L F 2006 Environ. Energy Eng.52 804-8 [7] Kravvaritis E D, Antonopoulos K A and Tzivanidis C 2010 Meas. Sci. Technol. 21 5103-12 [8] Moreno-Alvarez L, Herrera J N and Meneses-Fabian C 2010 Meas. Sci. Technol.21 7001-5 [9] http://www.newark.com/
[10] Tsai C-F, Li L-T, Li C-H and Young M-S 2009 Proc. 5th Int. Conf. on Intelligent Infromation Hiding and Multimedia Signal Processing (Kyoto, Japan, 12-14 September 2009)
(Washington: IEEE Computer Society) p 530
[11] Nenova Z P and Nenov T G 2009 IEEE Trans. Instr. Meas. 58 441-9 [12] http://www.rubitherm.com/english/index.htm