City, University of London Institutional Repository
Citation
:
Dodd, S. J., Chalashkanov, N. M., Fothergill, J. and Dissado, L. A. (2010).
Influence of the temperature on the dielectric properties of epoxy resins. Paper presented at
the International Conference on Solid Dielectrics ICSD, 4 - 9 July 2010, Potsdam, Germany.
This is the unspecified version of the paper.
This version of the publication may differ from the final published
version.
Permanent repository link:
http://openaccess.city.ac.uk/1366/
Link to published version
:
Copyright and reuse:
City Research Online aims to make research
outputs of City, University of London available to a wider audience.
Copyright and Moral Rights remain with the author(s) and/or copyright
holders. URLs from City Research Online may be freely distributed and
linked to.
City Research Online:
http://openaccess.city.ac.uk/
publications@city.ac.uk
Influence of the temperature on the dielectric
proper-ties of epoxy resins
S.J. Dodd, N.M. Chalashkanov, J.C. Fothergill, L.A. Dissado
Department of Engineering University of Leicester
Leicester, UK
Abstract — Electrical degradation processes in epoxy resins, such as electrical treeing, were found to be dependent on the tempera-ture at which the experiments were carried out. Therefore, it is of considerable research interest to study the influence of tempera-ture on the dielectric properties of the polymers and to relate the temperature effect on these properties to the possible electrical degradation mechanisms. In this work, the dielectric properties of two different epoxy resin systems have been characterized via dielectric spectroscopy. The epoxy resins used were bisphenol-A epoxy resins Araldite CY1301 and Araldite CY1311, the later being a modified version of the former with added plasticizer. The CY1301 samples were tested below and above their glass transition temperature, while the CY1311 were tested well above it. Both epoxy systems possess similar behaviour above the glass transition temperature, e.g. in a flexible state, which can be char-acterized as a low frequency dispersion (LFD). On the other hand, it was found that below the glass transition temperature CY1301 samples have almost “flat” dielectric response in the frequency range considered. The influence of possible interfacial features on the measured results is discussed.
Keywords - dielectric relaxation; low frequency dispersion; in-terfacial phenomena; bulk response; epoxy resin
I. INTRODUCTION
Electrical degradation processes in epoxy resins, such as electrical treeing, have been found to be dependent on the envi-ronmental conditions [1, 2], in particular temperature. There-fore, it is of considerable interest to study the influence of tem-perature on the dielectric properties of the polymers and to relate the temperature dependence of these properties to the possible electrical degradation mechanisms [3].
According to the Dissado-Hill many-body theory, dielectric relaxations in solids can be viewed as cooperative motions within and between clusters [4]. A cluster response may be excited by an external constraint such as the onset of a polaris-ing electric field. The development of this excitation follows a pattern in time that results in a frequency dependent suscepti-bility given by the expression [4, 5]:
1 1 2 1 0 1 ; 2 ; 1 , 1 F 1 2 Γ 1 Γ 1 Γ c c c n m n n m m n m n i i (1)
where Г(x) denotes the gamma function and 2F1( , ; ;) is the
Gaussian hypergeometric function. In the above expression the
susceptibility χ is given as a function of the reduced frequency
ω⁄ωc.
Equation (1) gives a dielectric dispersion when the parameters
n and m are in the range, 0 n 1.0 m 1, with the asymp-totic fractional power law frequency behaviour:
c m c n for 0 for 1 (2)
When n n2 and m n1 1 with 0 n1 0.5a form of
re-sponse is produced called low frequency dispersion (LFD) by Jonscher [5] and quasi-DC (QDC) by Dissado and Hill [4]. This is described by the behaviour of (3) below [6, 7]
c n c n for for 1 1 1 2 (3)
and differs from the dielectric dispersion at low frequencies where a fractional power law exists similar to that found at high frequencies but with a power law that is close to ω-1. LFD
occurs in carrier dominated systems, where ion transport be-tween the clusters is possible at times longer than ωc-1, where
ωc is the characteristic frequency of the process. However, this
transport is limited to the neighbouring clusters and there is no entire percolation path to connect the two electrodes, which is the major difference between DC conduction and LFD (QDC). Hence, two power laws exist below and above ωc. In the case,
where charge transport between the clusters is not possible, the theory states that a loss peak (D) occurs with fractional power laws m and n-1 below and above the peak frequency ω
c.
In this work, it is shown that both response processes can be observed in epoxy resins. The temperature dependence of the dielectric response spectra is investigated and it is shown that the LFD process is a bulk process whereas the loss peak is due to interfacial features.
II. EXPERIMENTAL
A. Sample preparation
produce epoxy resin sheets in thicknesses of approximately 0.8 mm and 1.7 mm. The thickness of the samples was measured with a micrometer. The sample to sample variation was within ±0.05mm. The epoxy samples were left to cure for two days in the mould. Afterwards, they were post-cured for an hour in a vacuum oven at 100 C and slowly cooled down to room tem-perature. All samples were stored in sealed containers under controlled temperature and humidity conditions.
B. Dielectric spectroscopy
[image:3.595.318.550.53.252.2]A special electrode cell was implemented for the dielectric measurements, which allows stable values of temperature and humidity to be maintained and monitored during the experi-ments. The temperature and humidity lags of the system were measured and care was taken to ensure enough time for reach-ing the equilibrium temperature and humidity before measurreach-ing the impedance of the sample. The electrode cell is shown in Fig.1. A standard three electrode configuration was used with a guard electrode. The electric current (amplitude and phase) flowing through the bulk of the sample is measured with re-spect to an applied AC electric field between two parallel plate electrodes. The function of the guard electrode is to prevent detection of surface currents which may obscure the bulk re-sponse of the material. The applied voltage was scaled with the sample thickness, so that all samples were measured at ap-proximately equal magnitudes of the applied electric field. The voltage levels were 1.5V rms for samples with thickness 1.7mm and 0.6V rms for samples with thickness 0.8mm. The frequency range was 3.710-4 to 1.0105 Hz. A compression spring was loaded by the weight of the guard electrode so that good contact was provided between the measuring electrode and the epoxy sample. In this way, the volumetric expansion of the epoxy sample resulting from the increased temperatures was opposed. A probe was placed in the cell to monitor the temperature during the experiments. The dielectric properties of CY1301 samples were measured in the temperature range 20
to 80 C, and the corresponding temperature range was 20 to 60 C for CY1311 samples. Therefore, the CY1301 samples were tested below and above their glass transition temperature, while the CY1311, were tested at least 20 C above it.
III. RESULTS AND DISCUSSION
[image:3.595.87.483.459.682.2]The dielectric response of a CY1301 samples is shown in Fig.2. Below the glass transition temperature, the real compo-nent of the relative permittivity is almost “flat” in a log-log plot and the imaginary component is dominated by instrumental noise. Above the glass transition temperature, a dispersion process appears that it is most pronounced at 80oC. The
imagi-nary part steadily increases at frequencies lower than the peak frequency of the dispersion process. The real component of the relative permittivity also shows signs of increment in the same
Fig. 2: Real (solid markers) and imaginary (open markers) parts of the relative permittivity of epoxy resin CY1301 for temperatures 20 C(), 40 C(), 60 C() and 80 C(), sample thickness 1.7mm
75 44 50
Bottom Electrode
Sealed Aluminium chamber
Upper Electrode I
E
Temp. probe
Epoxy sample
Vents
60 Guard Electrode
Insulator
Sample LV Electrode
HV Electrode Spring
Insulation
frequency range. This behaviour resembles (3) in the vicinity of the characteristic frequency ωc.
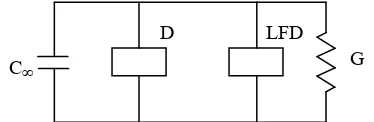
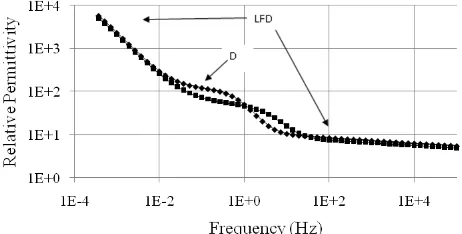
The dielectric spectra of CY1311 samples reveal low frequency dispersion (LFD) and mid frequency dispersion (D), the char-acteristic frequencies of which shift towards higher frequencies at elevated temperatures. The temperature dependence of the dielectric response of a CY1311 sample is shown in Fig. 3. In accordance with (3), in a log-log plot, the real and imaginary parts of the permittivity are parallel at very low and very high frequencies. The dispersion (D) is superimposed on the LFD response in the mid frequency range. The measurement data was fitted to the Dissado-Hill model using a computer gramme. The overall equivalent circuit used in the fitting pro-gramme is shown in Fig. 4. It was necessary to add a dc con-duction process to improve the fit. The values of the character-istic parameters obtained from the fitting routine are presented in Table 1 for a CY1311 sample. All characteristic parameters increase with temperature suggesting thermally activated proc-esses.
The activation energy of a thermally activated process can be obtained from an Arrhenius plot. An Arrhenius plot of the processes included in the Dissado-Hill model is shown in Fig. 5 using the data in Table 1. The values of the activation energy
[image:4.595.62.519.60.304.2]obtained from the slopes of the plots are 1.5 to 1.7eV.
Fig. 4: Equivalent circuit representing dielectric data obtained
Both spectra (Fig. 2 and Fig. 3) have similar features above the glass transitions temperature, i.e. when the resin is in a flexible state. A comparison between a CY1301 sample meas-ured at 80oC and a CY1311 sample measured at 30oC is pre-sented in Fig. 6. Both temperatures are 25-30oC above the
glass transition temperature of the corresponding resin. The two spectra are almost identical other than a small frequency shift of the mid frequency dispersion process. Another striking similarity is that the dielectric increment (real part) associated with the dispersion (D) has the same amplitude in both cases.
G C∞
[image:4.595.337.524.361.422.2]LFD D
Fig. 3: Real (filled) and imaginary (open markers) components of the relative permittivity of epoxy resin CY1311 at 20 C(), 40 C(), and 60 C(), sample thickness 1.7mm
TABLE I. FITTED PARAMETERS OF DISSADO-HILL MODEL AS A FUNCTION OF TEMPERATURE
T,
oC fHz c D, fc LFD, Hz Conductance, pS
20 0.02 2.0 40.3
30 0.12 14.7 180.5
40 0.88 80.0 1507.2
50 2.85 356.3 9414.1
[image:4.595.312.540.571.708.2] [image:4.595.51.276.627.721.2]It is of primary importance to be able to differentiate between the features in the dielectric spectra due to the bulk response of the material under study and those features which occur as a result of electrode-sample interfaces. The standard procedure for identification of interfacial effects is to study samples with different thicknesses [8]. If a feature in the estimated suscepti-bility spectra appear to be proportional to the sample thickness it can be considered to be interfacial in nature, i.e. an interfa-cial capacitance will be independent of sample thickness and hence conversion to a susceptibility/permittivity using
meas
r C
A d
0 (4)
where Cmeas is the measured capacitance, will give an apparent
value for 0 rthat increases with sample thickness d. This ap-proach is adopted in the current study. The frequency depend-ence of the real part of the relative permittivity measured at 40 C of two CY1311 samples with thicknesses 0.8 and 1.7 mm is shown in Fig.7. The extreme left and right parts of the two spectra almost entirely coincide; while the dielectric increment associated with the mid frequency dispersion (D) shows con-siderable thickness dependence. Therefore, the LFD can be assumed to be a bulk material property, while the mid fre-quency dispersion is most likely an interfacial phenomenon. Further research is necessary to verify the interfacial nature of the mid frequency dispersion.
IV. CONCLUSIONS
The following conclusions can be drawn on the basis of the observed dielectric spectra:
Both resins CY1301 and CY1311 show similar response above the glass transition temperature, although CY1311 is a chemically modified version of CY1301 with added plasticizer. From the dielectric response spectra a LFD, a mid frequency dispersion, and a DC conduction were identified as parallel processes. All of them are thermally activated processes, which can be observed above the glass transition temperature of the corresponding resin. The values of the activation energy of these processes are in the range 1.5-1.7eV.
LFD is a bulk material property of the two epoxy resins systems studied, which is observed in the frequency range considered here only above the glass transition. The di-electric response of the two epoxy resin systems suggest that inter-cluster charge transport is possible only when significant polymer chain motions occur, i.e. above the glass transition temperature at least in the frequency range considered here. The same is valid for the dc conduction process.
The mid-frequency dispersion observed in the dielectric spectra is an interfacial feature and should not be taken to be a material property.
REFERENCES
[1] Dissado, L.A. and J.C. Fothergill, Electrical Degradation and Break-down in Polymers. IEE Materials and devices series 9. 1992: Peter Pere-grinus Ltd.
[2] Champion, J.V. and S.J. Dodd, An assessment of the effect of externally applied mechanical stress and water absorption on the electrical tree growth behaviour in glassy epoxy resins. J. Phys. D: Appl. Phys., 1999. 32: p. 305-316.
[3] Hong, T.P., O. Lesaint, and P. Gonon, Water Absorption in a Glass-Mica-Epoxy Composite I: Influence on Electrical Properties. IEEE Trans. Dielectrics and Electrical Insulation, 2009. 16(1): p. 1-10. [4] Dissado, L.A. and R.M. Hill, A Cluster Approach to the Structure of
Imperfect Materials and Their Relaxation Spectroscopy. Proc. R. Soc. A, 1983. 390: p. 131-180.
[5] Jonscher, A.K., Universal relaxation law. 1996, London: Chelsea Di-electrics Press. 415.
[6] Das-Gupta, D.K. and P.C.N. Scarpa, Modeling of Dielectric Relaxation Spectra of Polymers in the Condensed Phase, in IEEE Electrical Insula-tion Magazine. 1999. p. 23-32.
[7] Dissado, L.A. and R.M. Hill, Anomalous Low-frequency Dispersion. J. Chem. Soc., Faraday Trans. 2, 1984. 80: p. 291-319.
[image:5.595.47.283.59.188.2][8] Jonscher, A.K., Dielectric relaxation in solids. 1983, London: Chelsea Dielectrics Press. 380.
[image:5.595.45.276.575.692.2]Fig. 7: Real components of the relative permittivity of CY1311 epoxy resin samples at 40oC, sample thickness 0.8 () and 1.7mm ()
Fig.6: Real (solid) and imaginary (open markers) of the relative permittiv-ity of epoxy resin CY1311, 30 C () and CY1301, 80 C (), thickness =