Risk Analysis for RoPax Vessels
Dimitris Konovessis, Dracos Vassalos and George Mermiris
*Universities of Glasgow and Strathclyde
Abstract
The paper presents the results of a recent risk analysis study for RoPax vessels, carried out as part of the activities of the SAFEDOR Integrated Project. The objective of this study was to investigate the causes of hazards during RoPax operation and quantify, to the ex-tent possible, their frequencies and consequences. Poex-tential scenarios initially identified and prioritised during a Hazard Identification (HAZID) session were used in the pro cess.
The work has been performed in accordance with the IMO FSA Guidelines (IMO 2002). A previous comprehensive study on the safety assessment of RoPax vessels sailing in North West European waters, covering the period until 1994, was used as the basis in putting together a high-level risk model for the current study. All scenarios are presented in the form of event trees, quantification of which is done on the basis of world-wide accident experience (from 1994 to 2004), relevant past studies and judgment. The study estimates the risk of loss of life among passengers and crew (by calculating for each scenario the In di -vidual Risk, the Potential Loss of Life – PLL and plotting the corresponding F-N curves), and compares them with current risk acceptance criteria. The resulting high-level risk model is used to provide recommendations for improvement in the form of proposed risk control options (RCOs).
Key words: Marine Accident Analysis, Formal Safety Assessment, Risk Acceptance Cri-teria
1
Introduction
The overall scope of this high-level, generic risk analysis study is to investigate credi-ble accident scenarios of a certain scale that may occur during RoPax operations. Occupational hazards that would affect individual members of the crew and passen-gers’ personal accidents, such as slips and falls, have not been included in the study. The following operational phases, as considered during a HAZID session, provide the range that is taken into account in performing this study:
•
Loading;•
Departing quay;•
Transit and navigation in coastal waters;•
Transit in open sea;© World Maritime University. All rights reserved. ISSN: 1651-436X print/1654-1642 online
•
Arriving at port, mooring and preparing for unloading;•
UnloadingIn this respect, no analysis has been carried out for accident scenarios that may occur during construction, sea-trials, dry docking, repairs and scrapping, as well as for se-curity hazards.
2
Safety Regulations
The main consequences on a RoPax following an accident may be graceful sinking or capsize and/or fire which can result in great loss of life among the passengers and crew onboard. Some of IMO’s regulations are particularly relevant to RoPax operations and are briefly outlined in the following under the headings: subdivision and damage stabil-ity; fire safety; and implementation of the International Safety Man age ment (ISM) Code.
2.1
Subdivision and Damage Stability (SOLAS Chapter II-1)
Currently the global standard for damage stability of RoPax ships is the vessel to be able to sustain any two-compartment damage and also fulfilling a set of deterministic requirements known as SOLAS 90. This represents a significant improvement with the standards applicable at the beginning of 1990s and is in general considered a suf-ficient and satisfactory standard. In North West Europe, an increased standard is applied for existing ships, known as the “Stockholm Agreement” or SOLAS 90+50, which requires either fulfillment of the deterministic standards of SOLAS 90 with an additional height of water on deck (maximum of 50 cm), or the demonstration by means of model experiments that the vessel can survive in damaged conditions the sea state at the area of operation.
The IMO’s Sub-Committee on Subdivision, Load Lines and Fishing Vessel Safety (SLF) has developed a new set of probabilistic rules for all ship types for global appli cation from 2009 onwards. These rules follow the approach developed at Resolution A.265 (IMO issued this resolution at 1974, as an alternative to the deterministic SOLAS damage stability requirements) and are mainly based on extensive research work carried out at the late 1990s/early 2000s as part of the activities of the EC-funded re-search project HARDER.
2.2
Fire Safety (SOLAS Chapter II-2)
To accommodate novel designs and issues relating to the human element, the IMO Sub-Committee on Fire Protection undertook an 8-year effort that led to the adoption of an entirely new structure for SOLAS Chapter II-2 which may better accommo-date the way port and flag states and ship designers would deal with fire safety issues in the future.
requirements were moved to a new International Fire Safety Systems (FSS) Code and each regulation will now have a purpose statement and functional requirements to assist port and flag states in resolving matters which may not be fully addressed by prescriptive requirements.
The revised SOLAS Chapter II-2 also has a new Part E that deals exclusively with hu-man element matters such as training, drills and maintenance issues and a new Part F that sets out a methodology for approving alternative (or novel) designs and arrange -ments. With regards to the latter, the regulations contained in Part F will be supported by a new set of guidelines. The new guidelines, once adopted, are intended to provide technical justification for alternative design and arrangements to SOLAS Chapter II-2. The guidelines will outline the methodology for the engineering analysis required by the new SOLAS Regulation II-2/17, dealing with alternative design and arrange-ments, where approval of an alternative design deviating from the prescriptive re-quirements of SOLAS Chapter II-2 is sought.
The revised SOLAS Chapter II-2 and the associated FSS Code entered into force on 1 July 2002 and will apply to all ships built on or after 1 July 2002, although some of the amendments apply to existing ships as well as new ones.
2.3
ISM Code (SOLAS Chapter IX)
The ISM Code was adopted by the 1993 Assembly at IMO as Resolution A.741(18). The ISM Code is made mandatory for all SOLAS ships, regardless of their year of con-struc tion.
The Code requires a Safety Management System (SMS) to be established by the ship -owner or manager to ensure compliance with all mandatory regulations and that codes, guidelines and standards recommended by IMO and others are taken into account. Companies are required to prepare plans and instructions for key shipboard opera-tions and to make preparaopera-tions for dealing with any emergencies which might arise. The importance of maintenance is stressed and companies are required to ensure that regular inspections are held and corrective measures taken where necessary. The procedures required by the ISM Code should be documented and compiled in a Safety Management Manual, a copy of which should be kept onboard. Regular checks and audits should be held by the company to ensure that the SMS is being complied with and the system itself should be reviewed periodically to evaluate its efficiency. The ISM Code is being applied on RoPax ships since July 1998.
3
Reference Data
3.1
World RoPax Fleet
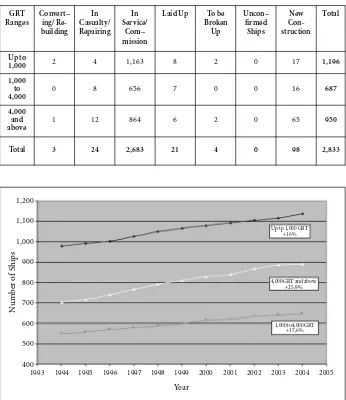
Table 1 shows the number and size distribution of the RoPax fleet world-wide, as of March 2006, according to Lloyds Register – Fairplay (LRFP) data.
Figures 2 and 3 illustrate the age distribution of RoPax ships. It can be deducted from these two graphs that newer ships are usually of bigger tonnage.
Finally, Table 2 shows the distribution of the maximum carrying passenger capacity of 1,153 RoPax vessels.
3.2
Data Used
To carry out the risk analysis study for RoPax a set of reference, generic data should be considered. As illustrated in Section 3.1 the distribution of sizes of the RoPax fleet is wide, hence it is considered that by selecting a RoPax ship with specific character-istics would greatly limit the scope of the study. Hence, the following considerations/ assumptions are made:
•
RoPax ships of 1,000 GRT and below, are usually engaged on short crossings and pas sages and are often of an open-type configuration. A representative RoPax for a gen eric risk analysis study should be of a closed-type configuration and part of her trip is usually exposed to weather. On this basis, all RoPax ships of 1,000 GRT and below are excluded from this study.•
To distinguish between small and larger RoPax ships, two categories are initially con -sidered: one of 1,000 to 4,000 GRT and one of 4,000 GRT and above. The purpose for this consideration is to investigate differences on accidents frequencies between small and larger RoPax.•
The distribution of number of passenger of Table 2, reproduced from (Kanerva 2001), indicates an average maximum carrying capacity of around 1,000 passengers.In carrying out risk estimations for Individual Risk, Potential Loss of Life (PLL) and producing the F-N diagram plot, the following assumptions are made:
•
Different traffic loads indicate great fluctuations on the number of passengers car-ried, depending on the period of the year. Taking into account the average maximum carrying capacity of 1,000 passengers, traffic seasonality is assumed as follows: – 25% of trips carrying full passenger load (1,000 passengers)– 25% of trips carrying half of maximum passenger load (500 passengers) – 50% of trips carrying 75% of maximum passenger load (750 passengers)
•
Crew onboard a RoPax is usually between 75 and 120. For the purpose of this study,crew number of 100 is considered as an average.
4
Risk Criteria
Figure 1. RoPax Fleet development, world-wide data (1994–2004)
4.1
Individual Risk Criteria
Individual risk is the risk experienced by a single individual (passenger or member of crew) in a given time period, who, in our case, is exposed to hazards relating to Ro-Pax operations. The individual risk is usually expressed as the frequency of an indi-vidual fatality per year.
SAFEDOR (2005) proposes criteria for individual risk for shipping operations at the same level as those used by the UK Health and Safety Executive. These criteria are reproduced in Table 3. On the basis of these criteria, intolerable, ALARP and negligible risk levels for individuals (passengers and crew) are determined.
GRT Ranges
Convert– ing/ Re -building In Casualty/ Repairing In Service/ Com– mission
Laid Up To be Broken Up Uncon– firmed Ships New Con-struction Total Up to
1,000 2 4 1,163 8 2 0 17 1,196
1,000 to 4,000
0 8 656 7 0 0 16 687
4,000 and above
1 12 864 6 2 0 65 950
[image:5.595.126.472.153.553.2]Total 3 24 2,683 21 4 0 98 2,833
Table 1. Current RoPax Fleet, world-wide data, March 2006
1,200 1,100 1,000 900 800 700 600 500 400 N u mber of Ships
1993 1994 1995 1996 1997 1998 1999 2000 2001 2002 2003 2004 2005
Year
Up tp 1,000 GRT +16%
4,000 GRT and above +25,9%
In this study, average individual risks are estimated on the basis of potential accident scenarios which form the generic risk model developed. These estimations can then be weighted with different exposure expected for crew members and passengers, in order to determine risk acceptability or not.
1,400
1,200
1,000
800
600
400
200
0
N
u
mber of
Ships
0–4 5–9 10–14 15–19 20–24 25+
[image:6.595.126.474.205.669.2]Year
Figure 2 and 3. Age distribution of RoPax Fleet in 2004
5 000 000
4 500 000
4 000 000
3 500 000
3 000 000
2 500 000
2 000 000
1 500 000
1 000 000
500 000
0
G
ross T
o
nnage
0–4 5–9 10–14 15–19 20–24 25+
Table 2. World RoPax Fleet – distribution of passenger carrying capacity (2000) – (Kanerva 2001)
Group Number of Passengers
LOA (m) Below 500 500 to 1,000 1,000 to 1,500 1,500 to 2,000 Above 2,000 Total
Below 100 162 192 56 4 1 415
100–120 33 67 62 15 7 184
120–150 22 93 100 53 23 291
150–180 23 49 25 33 31 161
Above 180 7 34 26 18 17 102
Total 247 435 269 123 79 1,153
4.2
Societal Risk Criteria
Societal risk is the total risk experienced by the whole group of people (passengers or crew members) travelling on a ship. It is usually plotted on an F-N log-log diagram which shows the relationship between the cumulative frequency F of incidents with N or more fatalities against the number of fatalities N.
Risk criteria on an F-N diagram distinguish intolerable, ALARP and negligible risk areas. The criteria are plotted on the basis of “anchor” points and a selected gradient (usually a slope of –1 is chosen, risk averse). The usual approach is the societal crite-rion for accidents with 1 death to correspond to the prescriptive individual critecrite-rion (also meaning that the anchor points are usually taken at N = 1). Different activities and industry sectors will require different criteria to reflect the corresponding level of risk considered tolerable.
Table 4 contains the anchor points for societal criteria suggested in SAFEDOR (2005) for RoPax vessels, using anchor points at N = 10. That report also states that these cri-teria have been derived on the basis of economic importance.
Figure 4 illustrated the criteria lines using the anchor points of Table 4 and assuming risk adverse perception (slope of the lines equal to –1).
Table 3. Individual risk criteria
Individual risk criterion Value
Maximum tolerable risk for crew members 10–3per year
Maximum tolerable risk for passengers 10–4per year
Table 4. Societal criteria for RoPax
Anchor points for societal criteria Values
Boundary between negligible and tolerable risk (10, 10–4)
Boundary between tolerable and intolerable risk (10, 10–2)
Figure 4. Societal criteria for RoPax vessels
5
HAZID Results
SAFEDOR (2006) reports on the outcome of a HAZID session for RoPax. The HAZ -ID session was organised by personnel from LMG Marin (Norway) and The Ship Sta-bil ity Research Centre and involved personnel from Color Line Marine (Nor way), Flens burger Shipyard (Germany), Det Norske Veritas (Norway) and the Maritime and Coast guard Agency (UK). Various RoPax operational phases were considered for which haz ards, their causes and consequences were recorded and analysed qualita-tively in a structured manner.
A risk register has been developed, comprising the most relevant hazards that may occur in RoPax operations. A total of 58 hazards were identified within the follow-ing operational phases:
•
Loading (7 hazards);•
Departing quay (8 hazards);•
Transit and navigation in coastal waters (12 hazards);•
Transit in open sea (6 hazards);•
Arriving in port, mooring and preparing for unloading (6 hazards);•
Unloading (6 hazards);1.00E-01
1.00E-02
1.00E-03
1.00E-04
1.00E-05
1.00E-06
1 10 100 1000
Intolerable
Alarp
•
Bunkering, treatment of fluid and solid garbage (3 hazards);•
Emergency evacuation and drills (8 hazards);•
Other (2 hazards).Based on subjective, qualitative estimates of their frequencies and consequences by the HAZID participants, the hazards have been ranked to derive a prioritised list of the most significant hazards. Table 5 contains the top-ranked hazards identified during the HAZID session. Of relevant is also Table 6, containing top-ranked hazards with high frequency of occurrence, but of low consequences.
The HAZID results have confirmed the hazards expected to be significant. In this respect, scenarios initiated by collisions, groundings, fire and flooding from other causes are carried forward for consideration in the risk analysis study of this report.
Table 5. Top-ranked high-consequence hazards
Hazard FI SI RI
Failure of evacuation equipment during an emergency 4.78 3.33 8.11
Fire in accommodation while in open sea or navigating in coastal waters 3.89 4.00 7.89
Human error and/or lack of training during an evacuation 4.56 3.22 7.78
Collision with other ships while in open sea or navigating in coastal waters 3.22 3.78 7.00
Fire on vehicle deck while unloading due to accumulation of fuel spills 3.33 3.22 6.56
Fire in machinery spaces while in open sea or navigating in coastal waters 3.44 3.11 6.56
Evacuation arrangements and plans not as effective as designed for 3.44 3.11 6.56
No or reduced visibility and high toxitity due to smoke during evacuation 3.00 3.33 6.33
Evacuating following a fire or explosion 3.11 3.00 6.11
Grounding while navigating in coastal waters 3.22 2.89 6.11
Table 6. Top-ranked high-frequency hazards
Hazard FI SI RI
Failure of evacuation equipment during an emergency 4.78 3.33 8.11
Collision between a car and the vessel or between two cars during loading 6.22 1.78 8.00
Human error and/or lack of training during an evacuation 4.56 3.22 7.78
Heavy ship movements due to weather while in open sea 5.89 1.11 7.00
Failure of loading equipment (gangways, ramps, cranes, etc.) 4.67 2.11 6.78
Own wash effect while navigating in coastal waters 5.00 1.44 6.44
Passengers misbehaving 4.44 2.00 6.44
Relative movement ship-shore while loading 4.89 1.11 6.00
Fire or explosion during loading 4.33 1.56 5.89
6
Casualty Data Analysis
This work is based on casualty historical data for the period 1994–2004, obtained by the Lloyds Maritime Information Unit (LMIU) and on fleet statistics for the same period, obtained by Lloyds Register – Fairplay (LMFP). These two sources are considered the most comprehensive for casualty data and fleet-at-risk data, respectively. The reason for the selection of the said period is that the safety assessment study for RoPax ves-sels carried out as part of the North West European (NWE) Project, DNV Technica (1996a&b), covered the period 1978–1994, hence providing some reasonable basis of comparison of the corresponding safety records for the two periods.
6.1
Frequency Analysis
The LMIU casualty database includes 1,147 incidents for RoPax ships world-wide for the period 1994 to 2004. 54 incidents have happened during repairs or conven-tions, labour and other disputes, on vessels that were already laid-up or to be broken up (9 incidents for RoPax of 1,000 to 4,000 GRT range and 45 incidents for RoPax of 4,000 GRT and above). These incidents have not been taken into account in the analysis. Also, there were a further 3 incidents which are attributed as acts of terror-ism (notably one explosion involving considerable number of fatalities), which have also not been taken into account in the analysis.
A further 42 incidents have happened on RoPax of 100 to 1,000 GRT. These are also excluded from the analysis for the reasons given in Section 3.2, however, given the great number of RoPax ships under 1,000 GRT (1,196 ships according to LRFP data, March 2006), this casualty figure indicates serious under-reporting of casualties.
Casualty records held by LMIU classify incidents as serious and non-serious. An in-cident is considered as serious if it has involved a single or multiple fatalities, damage to the vessel that has interrupted her service or if the vessel has been lost.
Tables 7, 8 and 9 contain an analysis of the LMIU RoPax casualty data for the period 1994–2004, for RoPax of 1,000 GRT to 4,000 GRT, for RoPax of 4,000 GRT and above and for RoPax of 1,000 GRT and above, respectively.
Other recent studies have also estimated accident frequencies, covering periods sim-ilar to the one analysed in this report. More specifically:
•
In Vanem and Skjong (2004a) the frequency of collisions for all passenger ships over 4,000 GRT for the period 1990–2000 was estimated as 5.16E-03 per ship year. Table 8 indicates a collision frequency of 1.59E-02 per ship year, of which only 57% represent collisions under way, i.e. a frequency of collisions under way of 9.06E-03 per ship year.•
Similarly, Vanem and Skjong (2004a) reports a frequency of groundings for all pas-senger ships over 4,000 GRT for the period 1990–2000 of 1.03E-02 per ship year. Table 8 above indicates a grounding frequency of 1.13E-02 per ship year.5,000 GRT for the period 1990–2002 was estimated as 1.90E-03 per ship year. Table 8 indicates a frequency of 4.18E-03 per ship year.
[image:11.595.125.475.283.486.2]Taking into account the differences in reporting periods, different samples (importantly the fact that the figures presented in Vanem and Skjong (2004a) refer to all pas -senger ships, including cruise ships and RoPax) and possibly different definitions of casualty categories and/or the way data are used, it can be considered that fairly agree -ment exists with results of relevant studies.
Table 7. Number of incidents and drequencies, RoPax 1,000 GRT to 4,000 GRT (1994–2004)
# Incidents
% Total % Serious
Frequency (per ship year)
Total Serious Total Serious
Collision 53 4 18.6% 8.2% 8.01E-03 6.04E-04
Contact 62 8 21.8% 16.3% 9.37E-03 1.21E-03
Fire/Explosion 29 13 10.2% 26.5% 4.38E-03 1.96E-03
Wrecked/Stranded 48 14 16.8% 28.6% 7.25E-03 2.11E-03
Hull Damage 5 0 1.8% 0.0% 7.55E-04 0.00E+00
Foundered 0 0 0.0% 0.0% 0.00E+00 0.00E+00
Machinery damage 75 10 26.3% 20.4% 1.13E-02 1.51E-03
Miscellaneous 13 0 4.6% 0.0% 1.96E-03 0.00E+00
Total 285 49 100.0% 100.0% 4.31E-02 7.40E-03
Fleet at Risk (1994–2004) 6,620
Table 8. Number of incidents and frequencies, RoPax 4,000 GRT and above (1994–2004)
Fleet at Risk (1994–2004) 8,848 # Incidents
% Total % Serious
Frequency (per ship year)
Total Serious Total Serious
Collision 141 16 18.4% 12.1% 1.59E-02 1.81E-03
Contact 131 13 17.1% 9.8% 1.48E-02 1.47E-03
Fire/Explosion 99 37 12.9% 28.0% 1.12E-02 4.18E-03
Wrecked/Stranded 100 33 13.0% 25.0% 1.13E-02 3.73E-03
Hull Damage 30 7 3.9% 5.3% 3.39E-03 7.91E-04
Foundered 2 2 0.3% 1.5% 2.26E-04 2.26E-04
Machinery damage 214 21 27.9% 15.9% 2.42E-02 2.37E-03
Miscellaneous 50 3 6.5% 2.3% 5.65E-03 3.39E-04
[image:11.595.126.473.520.719.2]6.2
Comparison with Previous Periods
A comparison with frequencies calculated in DNV Technica (1996a&b) referring to North West European experience for the period 1978–1994 is attempted in this sec-tion. The following are the points that can be made:
•
Collision.The frequency of collisions under way at North West Europe during the period 1978–1994 was 1.32E-02 per ship year. From Table 9 and considering that collisions under way represent only 63% of the total frequency, the frequency of col-lisions under way world-wide for the period 1994–2004 is estimated to be 7.88E-03 per ship year. This indicates a frequency reduction of 40%.•
Grounding.The frequency of groundings at North West Europe during the period 1978–1994 was 2.00E-02 per ship year. From Table 9, the frequency of groundings world-wide for the period 1994–2004 is estimated to be 9.57E-03 per ship year. This indicates a frequency reduction of 52%.•
Impact.The frequency of impacts at North West Europe during the period 1978– 1994 was 4.90E-02 per ship year. From Table 9, the frequency of impacts world-wide for the period 1994–2004 is estimated to be 1.25E-02 per ship year. This indi-cates a frequency reduction of 74%.•
Flooding from other causes.Data comparison indicates no chance on this frequency.•
Fire.The frequency of fires at North West Europe during the period 1978–1994 was 1.00E-02 per ship year. From Table 9, the frequency of fires world-wide for the period 1994–2004 is estimated to be 8.28E-03 per ship year. This indicates a fre-quency reduction of 17%. [image:12.595.125.474.158.353.2]•
Overall frequency.The overall frequency for all critical scenarios (collisions under way, groundings, impacts, flooding from other causes and fires) at North West Eu rope during the period 1978–1994 was estimated to be 9.44E-02 per ship year. From Table 9, the overall frequency for these accident scenarios world-wide for the periodTable 9. Number of incidents and frequencies, RoPax 1,000 GRT and above (1994–2004)
Fleet at Risk (1994–2004) 15,468 # Incidents
% Total % Serious
Frequency (per ship year)
Total Serious Total Serious
Collision 194 20 18.4% 11.0% 1.25E-02 1.29E-03
Contact 193 21 18.3% 11.6% 1.25E-02 1.36E-03
Fire/Explosion 128 50 12.2% 27.6% 8.28E-03 3.23E-03
Wrecked/Stranded 148 47 14.1% 26.0% 9.57E-03 3.04E-03
Hull Damage 35 7 3.3% 3.9% 2.26E-03 4.53E-04
Foundered 2 2 0.2% 1.1% 1.29E-04 1.29E-04
Machinery damage 289 31 27.5% 17.1% 1.87E-02 2.00E-03
Miscellaneous 63 3 6.0% 1.7% 4.07E-03 1.94E-04
1994–2004 is estimated to be 4.05E-02 per ship year. This indicates an overall fre-quency reduction of 57%.
Due to differences in reporting (LMIU started systematic collection of casualty data on 1994; before that mainly serious accidents were reported only) the frequency reduc -tions calculated above should be used for reference only. At any case, the calculated reductions provide a concise indication that safety records have improved during the period 1994–2004.
6.3
Potential Loss of Life
Table 11 contains a list of the 14 fatal incidents occurred world-wide during the period 1994–2004. The fatalities data from this list have been used to produce the F-N curve presented in Figure 5.
[image:13.595.125.473.398.569.2]It is noted that this set of data does not include the al-Salam Boccaccio 98 incident, which happened on 3 February 2006 with around 1,000 fatalities. Including this in-cident in a PLL calculation for the period 1994–2006, we obtain a figure of 1.35E-01 per ship year.
Table 10. PLL, RoPax 1,000 GRT and above, 1994–2004
# Incidents # Fatalities PLL (per ship year) %
Collision 2 7 4.53E-04 0.5%
Fire/Explosion 8 378 2.44E-02 25.6%
Wrecked/Stranded 1 94 6.08E-03 6.4%
Hull Damage 3 995 6.43E-02 67.5%
Total 14 1,474 9.53E-02 100.0%
Fleet at Risk (1994–2004) 15,468
7
Risk Model
7.1
Description of the Model
This section describes the high-level risk model for RoPax operations. The risk mo del comprises event trees containing potential outcomes for the following initiating events:
1. Collision
2. Grounding (incidents classified by LMIU as “wrecked/stranded”) 3. Impact (incidents classified by LMIU as “contact”)
4. Other flooding (incidents classified by LMIU as “hull damage” or “foundered”) 5. Fire/explosion
these initiating events provide a sufficient basis for the derivation of a complete risk profile for RoPax operations, since:
Table 11. RoPax fatal incidents, world-wide, period 1994–2004
1 Location of Casualty: BAL – Baltic; EME – East Mediterranean and Black Sea; ED – Red Sea;
SCH – South China, Indochina, Indonesia and Philippines; WME – West Mediterranean
Incident Date Vessel Year Built Event Incident
Location1 Fatalities
18.05.1994 Al-Qamar Al-Saudi Al-Misri 1970 Fire/Explosion RED 21
28.06.1994 Tag Al Salam 1969 Fire/Explosion BAL 1
28.09.1994 Estonia 1980 Flooding BAL 852
18.09.1998 Princess of the Orient 1974 Flooding SCH 94
01.11.1999 Spirit of Tasmania II 1988 Fire/Explosion EME 14
25.11.1999 Dashun 1983 Fire/Explosion SCH 282
23.12.1999 Asia South Korea 1972 Fire/Explosion SCH 56
16.07.2000 Ciudad de Ceuta 1975 Collision WME 6
17.08.2000 Gurgen 2 1966 Fire/Explosion EME 1
26.09.2000 Express Samina 1966 Grounding EME 94
22.06.2002 Al Salam Petrarca 90 1971 Fire/Explosion RED 1
11.08.2002 Tacloban Princess 1970 Fire/Explosion SCH 2
22.10.2002 Mercuri 2 1984 Flooding EME 49
01.07.2003 Paglia Orba 1994 Collision WME 1
Figure 5. RoPax F-N Curve (Historical Risk)
1.00E-01
1.00E-02
1.00E-03
1.00E-04
1.00E-05
1.00E-06
1 10 100 1000
Intolerable
Alarp
Negligible
World-wide 1994–2006 NW Europe
1978–1994
F
requency of
N or M
o
re
F
atalities (per y
ear)
•
All fatal incidents were initiated by one of these causes as shown on Tables 10 and 11; also in previous relevant studies, for example Aldwinckle and Prentice (1990) and DNV Technica (1996a&b).•
These five initiating causes represent 66.5% of all incidents and 81.2% of serious incidents recorded for the period 1994–2004 (Table 9). This is mainly due to the fact that incidents recorded as “machinery damage/failure” are not taken forward for further analysis and elaboration. Incidents recorded as such by LMIU did not deve-lop to any subsequent accident of the five categories mentioned above. Extended time off-service for repair is the reason LMIU recorded a number of “machinery damage/failure” incidents as serious.Potential outcomes (accident scenarios) for the five initiating events taken forward for analysis are based on the analysis carried out in the safety assessment study of the Joint North West European project (DNV Technica 1996a&b). Since the risk model required by this study is at a high-level, this previous work is sufficient for this purpose.
For clarity, definitions for the five initiating events considered within the high-level risk model are as follows, adopting the accident classification of DNV Technica (1996a-&b):
•
Collisions:events where two vessels accidentally come into contact with each other. This may lead to sinking, grounding or to a fire on the vessel, but these are counted as collisions if this was the cause. This definition includes collisions between two ships under way, and also events sometimes known as “strikings”, where a moving ship strikes another ship at a berth.•
Groundings:cases where a vessel comes into contact with the sea bed or shore, in-cluding underwater wrecks. If the ship is struck fast, this is known as “stranding”. If the ship sinks, this is sometimes known as “wreck”. The category “wreck/stranded” used by LMIU is equivalent to the term “grounding” used in this study.•
Impacts:cases where a vessel comes into contact with objects other than ships, the sea bed or the shore. This includes impacts on berths, bridges and offshore plat-forms. It is known by LMIU as “contact”.•
Other flooding:cases where water enters a ship for reasons other than collision, im-pact or grounding (treated separately). Some of these events are included by LMIU under the category “hull/machinery damage”. If the ship sinks, this is known by LMIU as “foundering”. The “other flooding” category is also taken to include weather damage, cargo shifting and intact instability events which would lead to flooding if the ship were to sink.•
Fire/explosion:cases where fires and/or explosions occur for reasons other than collision, impact or grounding (treated separately).7.2
Summary Calculations
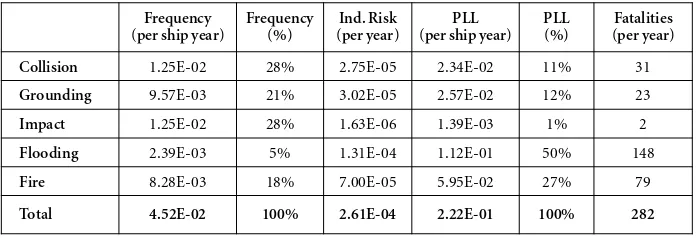
Table 12 summarizes the risk calculations carried out on the basis of the risk model.
The individual risk calculated by the risk model is 2.61E-04 per year, assuming the vessel being at sea and a person being onboard for the full duration of the year, as recorded in Table 12. To provide an estimate of the individual risk experienced by crew members and passengers, the following considerations can be made:
•
For crew members: assuming a 50–50 rotation scheme and that the vessel is at sea half of each day, the model predicts an overall individual risk for crew of 6.52E-05 per year. If we assume 3 crews rotating on a vessel (this is not a widespread practice, but is valid for some crew positions onboard a RoPax) then the overall individual risk becomes 4.34E-05 per year.•
For passengers: a passenger that spends 1 week per year travelling onboard a Ro Pax, experiences an individual risk 5.01E-06 per year. For a RoPax sailing at sea for 12 hours per trip, the assumption of 1 week per year means that the passenger takes 7 return journeys a year. Considering a passenger that makes 1 such return trip a week, the individual risk becomes 3.72E-05 per year(this estimation may be appro-priate for a truck driver that travels regularly on a RoPax route). [image:16.595.126.474.465.681.2]Considering the figures above, it can be concluded that individual risk levels are within the ALARP region for both passenger and crew members.
Figure 6 presents the F-N curve calculated by the risk model.
1.00E-01
1.00E-02
1.00E-03
1.00E-04
1.00E-05
1.00E-06
1 10 100 1000
Intolerable
Alarp
Negligible
F
requency of
N or M
o
re
F
atalities (per y
ear)
Number of Fatalities N
Table 12. Risk calculations, RoPax 1,000 GRT and above, world-wide, period 1994–2004
Frequency (per ship year)
Frequency (%)
Ind. Risk (per year)
PLL (per ship year)
PLL (%)
Fatalities (per year) Collision 1.25E-02 28% 2.75E-05 2.34E-02 11% 31
Grounding 9.57E-03 21% 3.02E-05 2.57E-02 12% 23
Impact 1.25E-02 28% 1.63E-06 1.39E-03 1% 2
Flooding 2.39E-03 5% 1.31E-04 1.12E-01 50% 148
Fire 8.28E-03 18% 7.00E-05 5.95E-02 27% 79
Total 4.52E-02 100% 2.61E-04 2.22E-01 100% 282
8
Risk Control Options
On the conclusion of risk analysis it is necessary to decide upon a series of actions that will prevent and/or mitigate the harmful effects of the identified risks. That is, a list of Risk Control Options (RCOs). The contribution of each RCO will be assessed against the benefit it offers and the cost to implement it. The Gross Cost of Averting a Fatality (GrossCAF) and the Net Cost of Averting a Fatality (NetCAF) indices are used for this task. They are defined as follows (IMO 2002):
GrossCAF =ΔC and NetCAF =ΔC–ΔB
ΔR ΔR
•
ΔC: the cost per ship of RCO;•
ΔB: the economic benefit per ship, resulting from the implementation of each RCO;•
ΔR: the risk reduction (number of lives saved) per ship, resulting from theimple-mentation of each RCO.
The selection of the appropriate list of RCOs should reflect the nature of operation of the ship under study and it focus on the findings of the risk analysis. That is, bear-ing in mind that collision frequency is at least 1.5 times higher that the rest, special attention should be paid to the navigational issues and procedures for averting haz-ards the might lead to such an outcome. These RCO are naturally concerned with navi-gational systems and the contribution of human element.
Under this perspective, the RCOs list identified in IMO (2004) was adopted in this study with all the relevant modifications to reflect the operational risks of RoPax ves -sels. As such, the following list is representative of the final RCOs considered here:
•
Safety and security centre on board the ship;•
Implementation of a series of navigational aids like Electronic Log Book (ELB), Electronic Chart Display System (ECDIS), Automatic Identification System (AIS);•
Duplication of navigational systems for increasing reliability;When considering the human element in potentially hazardous and unwanted situ-ations, then the RCOs list was extended further to include:
•
A second officer on watch;•
Improvement in the training procedures of navigators;•
Implementation of Bridge Resource Management (BRM);•
Etc.Except navigational-related risks, due attention should be paid to the rest of the iden-tified risks by selecting appropriate RCO which reflect the operational profile of the vessel under consideration. It should be mentioned here that the FSA study at this stage is heavily supported by expert judgment. As such, the views and experience of the expert panel are manifested by extending further the existing RCOs list by haz-ards related to the whole range of operations like:
•
Bunkering;•
Oil leakage of fuel mains and fire prevention;•
Electrical fires;•
Etc.All these RCOs can be accommodated under the fire risk category.
The final step of this phase of the FSA study is to assess the potential contribution of each RCO in terms of its NetCAF index. This would entail two distinct elements: (i) access to commercial information, operational data and costs for the calculation of the implementation cost of each RCO, (ii) establishment of the measure of benefit when human lives was the point of interest (other than just material or property damage due to an unwanted event).
In the first case, consultancy with marine operators provided the required data along with important operational experience regarding the soundness of application for each RCO. The cost for implementation was calculated based on the conventional Net Present Value (NPV) approach according to the formula:
NPV = C +
N
∑
j=1 A(1 + i)j
Where:
C is the initial amount spent for each RCO
A is the annual cost for each RCO (e.g. maintenance) i is the interest rate
N is the number of periods
with IMO guidelines, SAFEDOR (2005) and IMO (2000), and set this value to 3 mil-lion USD.
Considering all the above information, it becomes obvious that if the cost of imple-menting an RCO is less than the gained benefit (i.e. ΔC–ΔB <0), then this RCO should be adopted in practice. In this particular study this was the case for improving the human intervention in the operation and the adoption of a series of navigational aids like ECDIS, AIS, ELB, etc.
9
Conclusions
The main conclusions of the study are the following:
•
The frequency of anycollision, grounding, impact, flooding from other causes or fire/explosion incident happening is 4.52E-02 per ship year (1 in 22 ship years; world-wide casualty data, 1994–2004). This breaks down as collision (28%), ground-ing (21%), impact (28%), floodground-ing from other causes (5%) and fire/explosion (18%).•
The frequency of a seriouscollision, grounding, impact, flooding from other causes or fire/explosion incident happening is 9.50E-03 per ship year (1 in 105 ship years; worldwide casualty data, 1994–2004). This breaks down as collision (14%), ground -ing (32%), impact (14%), flood-ing from other causes (6%) and fire/explosion (34%).•
These values are in general agreement with other published studies, covering periodscontemporary to that of this study.
•
There is significant reduction in the frequency of incidence occurrence. As an indication, comparison of the data above with data of the North West European Project on the Safety of RoPax ships (period 1978–1994) shows a reduction of 40% of collision frequency, 52%on grounding frequency, 74%on impact frequency, 17% on fire/explosion frequency and 57%on the overall frequency of these events.•
During the period 1994–2004 there have been 14 fatal incidents, resulting in 1,474fatalities. The corresponding Potential Loss of Life is 9.53E-02 per ship year (approx-imately 134 fatalities per year). The figure is dominated by incidents involving flood-ing from other causes (67.5% of fatalities), followed by fire/explosion (25.6%) and grounding incidents (6.4%).
•
Comparison on the F-N curve of the PLL for the period 1994–2004 world-wide with North West European experience for the period 1978–1994, demonstrates a considerable risk reduction, however, it also demonstrates that risk is still high at the ALARP region (Figure 5).•
Frequency and consequences reductions indicate an improving safety record of the RoPax fleet world-wide. This can be attributed to the application of contem-porary rules and regulation and implementation of robust safety procedures in operating the vessels. However, risks are still high at the ALARP region, indicating more measures need to be taken.•
Probabilities for the various accident scenarios considered were derived from acci -dent experience of the period 1994–2004 and where this was not sufficient these predictions were based on previous studies (accident experience from earlier periods, relevant calculations or judgement). However, use of expert judgement was kept to a minimum.•
Risks are found to be high at the ALARP region, indicating the need for further risk control options to be assessed and recommended.•
Uncertainties in using the model refer mainly to the average fatality rates used for the various accident scenarios considered. In this study, these are based solely on past actual experience with RoPax vessels. This has proven inevitable, since no other feasible alternative was available for the wide range of accident scenarios consid-ered.Acknowledgements
The work reported in this paper has been carried out under the SAFEDOR project, IP-516278, with partial funding from the European Commission. The opinions ex-pressed are those of the authors and should not be construed to represent the views of the SAFEDOR partnership.
References
Aldwinckle, D.S. and D. Prentice. 1990. The Safety Record and Risk Analysis of Ro-Ro Passenger Ferries. Proceedings of the International Symposium on The Safety of Ro-Ro Passenger Ships, 26–27 April, London, 20 p.
DNV Technica. 1996a. Safety Assessment of Passenger Ro-Ro Vessels. Main Report (Docu -ment Number: REP-T09-003), Joint North West European Project, 28.10.1996.
———. 1996b. Safety Assessment of Passenger Ro-Ro Vessels. Appendices (Docu ment Num ber: REP-T09-003A), Joint North West European Project, 28.10.1996.
Kanerva, M. 2001. From Handy Size up to Large Cruise Ferries, elements required to design and build successful configurations. Proceedings of the Euro-Conference on Passenger Ship Design, Construction, Safety and Operation. October 2001, Crete, 83– 112.
International Maritime Organization (IMO), Maritime Safety Committee (MSC). 2000.Formal Safety Assessment: Decision Parameters including Risk Acceptance Cri -teria. MSC72/16, Submitted by Norway. London: IMO.
———. 2002. Guidelines for Formal Safety Assessment (FSA) for use in the IMO rule-making process. MSC/Circ.1023. London: IMO.
SAFEDOR. 2005. Risk Evaluation Criteria. SAFEDOR Deliverable D4.5.2.
———. 2006. HAZID for RoPax. SAFEDOR Deliverable D4.2.1.
Vanem, E. and R. Skjong. 2004a. Collision and Grounding of Passenger Ships – Risk Assessment and Emergency Evacuations, Proceedings of the 3rdInternational Con
fer-ence on Collision and Grounding of Ships. ICCGS 2004. October, Izu, Japan, 195–202.
———. 2004b. Fire and Evacuation Risk Assessment for Passenger Ships. Pro ceed ings of the 10thInternational Conference on Fire Safety and Engineer ing, INTERFLAM
Appendix
[image:22.595.129.473.416.546.2]Figure A.1. Generic collision event tree (world-wide experience, 1994–2004)
Figure A.2. Generic grounding event tree (world-wide experience, 1994–2004)
[image:22.595.122.473.584.692.2]