T h e o p e n – a c c e s s j o u r n a l f o r p h y s i c s
New Journal of Physics
Effects of laser prepulses on laser-induced
proton generation
D Batani1,5, R Jafer1, M Veltcheva1, R Dezulian1, O Lundh2, F Lindau2, A Persson2, K Osvay2, C-G Wahlström2, D C Carroll3, P McKenna3, A Flacco4 and V Malka4
1Dipartimento di Fisica ‘G Occhialini’, Università di Milano Bicocca, Milan,
Italy
2Department of Physics, Lund University, PO Box 118, S-22100 Lund, Sweden 3SUPA, Department of Physics, University of Strathclyde, Glasgow G4 0NG,
UK
4LOA, Ecole Polytechnique, Palaiseau, France
E-mail:batani@mib.infn.it
New Journal of Physics12(2010) 045018 (15pp) Received 23 November 2010
Published 30 April 2010 Online athttp://www.njp.org/
doi:10.1088/1367-2630/12/4/045018
Abstract. Low-intensity laser prepulses (<1013W cm−2, nanosecond duration)
are a major issue in experiments on laser-induced generation of protons, often limiting the performances of proton sources produced by high-intensity lasers (≈1019W cm−2, picosecond or femtosecond duration). Depending on the intensity regime, several effects may be associated with the prepulse, some of which are discussed in this paper: (i) destruction of thin foil targets by the shock generated by the laser prepulse; (ii) creation of preplasma on the target front side affecting laser absorption; (iii) deformation of the target rear side; and (iv) whole displacement of thin foil targets affecting the focusing condition. In particular, we show that under oblique high-intensity irradiation and for low prepulse intensities, the proton beam is directed away from the target normal. Deviation is towards the laser forward direction, with an angle that increases with the level and duration of the ASE pedestal. Also, for a given laser pulse, the beam deviation increases with proton energy. The observations are discussed in terms of target normal sheath acceleration, in combination with a laser-controllable shock wave locally deforming the target surface.
1. Introduction
In the context of proton generation by irradiation of foil targets with ultra-high-intensity laser beams, it is predicted that the use of very thin targets gives higher proton energies. Indeed this expectation is somewhat met in several experiments, including the experimental results of Kaluza et al [1]. Figure 1 shows the results of Kaluza et al, i.e. the correlation between proton cut-off energy and target thickness at I ≈1019W cm−2 and with a prepulse duration of ≈0.5 ns, together with more recent measurements done by Flacco et al at LOA at a greater intensity (I ≈5×10¹⁹W cm−2). There is a clear trend towards increasing proton energy when
the target thickness is reduced. However, below a certain thickness, the trend is reversed due to prepulse effects breaking the target (note that the inversion point is practically the same for the two sets of points, despite the greater intensity used by Flaccoet al[2], a result that was possible thanks to the advancement in techniques for improving laser contrast). (Also note, comparing the two experiments, that while in the paper by Kaluzaet al[1], there was a nanosecond pedestal (of duration 0.5 ns), in the case of measurements performed at LOA with the XPW system, there was only a picosecond prepulse (pedestal) of about 25 ps duration, rising from 10−10 to 10−8 contrast ratio (i.e. reaching a maximum intensity61012W cm−2).
However, in such results, the trend is reversed below a certain thickness, which is related to the duration of the laser prepulse. This is a clear indication that below a certain thickness, the effects of laser prepulse destroy the targets themselves creating a plasma on the rear side with a long plasma scale length, which kills the process of proton acceleration.
1 2 3 4
0.1 1 10 100
Kaluza et al.
Flacco et al.
Proton energy (MeV)
[image:3.595.148.402.95.351.2]Target thickness (micron)
Figure 1. Correlation between proton cut-off energy and target thickness at
I ≈1019W cm−2 and with a prepulse duration ≈0.5 ns [1] and at I ≈5×
1019W cm−2[2].
We will show how, depending on target thickness and prepulse intensity, three different regimes can be obtained. The first two are well known in the literature:
1. For ‘thick’ targets and at low pedestal intensities, the shock is very weak and travels slowly in the material. Thereby it has no time to break out on the target rear side before the arrival of the main laser pulse (picosecond duration), accelerating the energetic proton beam. 2. For ‘thin’ targets and high pedestal intensities, a strong shock is launched in the material
and travels quickly. Thereby it has the time to break out on the target rear side and induces a vaporization of the material (plasma formation) with the creation of a long gradient scale length, which prevents significant proton acceleration.
3. Finally, there is an intermediate regime, in which the shock breaks out on the target rear side but it is so weak that it just produces a deformation of the target surface but not its vaporization. This may produce deformation of the target rear side and therefore interesting effects consisting in the deflection of the laser beam, which indeed could even be controlled.
Also note that a thin foil target can also be displaced as a whole by the effect of ablation pressure, thereby strongly affecting focusing conditions (especially because in this kind of experiment, tight focusing is used to achieve large intensities on the target).
Figure 2. High-pressure phase diagram of Al [6] (1 Mbar=100 GPa) showing the melting curve, the vaporization curve, and the shock adiabatic, together with experimental data.
2. Laser-produced shocks and proton generation
The effects related to the shock induced by the laser prepulse depend on the following:
1) Shock pressure (which increases with laser intensity): at high pressure the shock will produce vaporization of the target rear side and plasma formation.
2) Target thickness and pedestal duration: to avoid breakout, we need the target thickness d
to satisfy the relation
d> Dτ, (1) where D is the shock velocity andτ the duration of the laser prepulse (before the arrival of the main laser pulse). The shock velocity is related to shock pressure by the relation [3]
D=
s γ + 1
1
PS
ρo
, (2)
where PS is the shock pressure, γ the adiabatic constant of the material and ρo its initial
density. Although (2) is strictly valid only for a perfect gas, in reality in the high pressure range (Megabar) all materials approach the perfect gas state so that relation (2) is qualitatively true for most materials and, quantitatively, is quite close to the real numbers.
Finally, the shock pressure is given by [4]
PS(Mbar)=8.6 I
1014 2/3
λ−2/3 A
2Z
1/3
, (3)
Figure 3. Density profile of a 6µm thick aluminium target after 1.5 ns for different laser intensities. The dotted line shows the unperturbed density profile. At 1012W cm−2, laser ablation generates a relatively cold and plastic deformation of the target. Increasing the intensity by one order of magnitude heats the shocked material and creates a density ramp at the rear surface. Such a ramp has been shown to decrease the maximum proton energy.
of about 10 and 13 km s−1 (i.e. µm ns−1). Therefore, if for instance we consider a prepulse
duration of 1 ns, we see that the shock does not have the time to break out for Al targets thicker than 13µm.
Indeed the two velocities are not so different due to the weak dependence of velocity on pressure and to the weak dependence of pressure on intensity. However, in order to assess the real effects of shock breakout, we must locate such pressures in the high-pressure phase diagram of Al [6], shown in figure 2. Here, we can notice the melting temperature of Al at standard pressure (T ≈933 K), the melting point along the Hugoniot of the material (T ≈5000 K) and, the boiling temperature at standard pressure (T ≈2500 K). The Hugoniot curve is the ensemble of states in a material that can be reached by shock compression. This is named as shock adiabat in figure2.
We must also consider the fact that, as described in [3], at the time at which the shock breaks out on the target rear side, the shock pressure will not be maintained since the shocked material will face vacuum (or a gas at very low pressure). This will cause the motion of the material in the forward direction (i.e. the direction of the shock front), while at the same time a relaxation wave is created. If the shock is not too strong it can be shown that the velocity of the free surface of the material is about 2U(whereU is the fluid velocity in the material behind the shock front moving with velocity D), while the relaxation wave, virtually decompressing the material to zero pressure, travels back in the material at the corresponding sound velocityCs.
Figure 4. Time–position plot of the 1D hydrodynamics of a 6µm Al foil irradiated by a flat-top laser intensity of 5×10¹²W cm−2. Scale in false colours
(see top of the figure) shows material density.
and they may therefore be termed as the case of strong shock pressure and the case of small shock pressure.
3. Detailed hydrodynamics simulations
In order to get a more quantitative description of the involved phenomena we performed numerical simulations using the hydrodynamics codes MULTI [7] and MULTI 2D [8]. Figure3 shows the typical density profiles obtained in a 6µm thick Al-target irradiated at various pedestal laser intensities (in all cases the temporal laser profile is flat-top). Figure 4 shows a time–position plot of the results of the simulation at a laser intensity of 5×10¹²W cm−2(a case with no plasma creation on the target rear side). We see indeed that the density profile on the rear side remains steep (unlike the front side).
However, the simulation in figure 4 shows another effect related to laser prepulses: after the breakout of the shock (here taking place about 0.6 ns after the beginning of irradiation with the 1.5 ns long laser pedestal), the whole target begins to move with a velocity of about 2U (as we said before). At 1 ns after shock breakout, the target has already moved almost by 10µm. Of course the displacement will be larger for higher laser intensities (larger shock pressures) and for thinner targets (earlier shock breakout time, less mass to be moved). Often a very tight focus is realized in this kind of experiment, in order to obtain a greater intensity, which usually implies a very short depth of focus. Therefore, in same cases, the target may go out of focus due to its motion, and this can be a further reason for inefficient proton generation.
Note that the target motion, as shown in figure 4, is characterized by a series of accelerations every time the shock breaks on the target rear. It is also clear, however, that the overall behaviour, on a longer time scale, shows a parabolic trend that is characteristic of a constant acceleration. Indeed, it can be shown that the target displacement is approximately given by
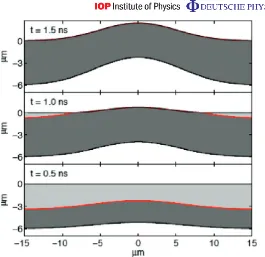
x = 1
2
P
Figure 5.Propagation and breakout of a shock wave driven in a 6µm Al target by a 1012W cm−2pedestal with a 10µm diameter focal spot. The red line represents the position of the shock front. The light grey region is unperturbed Al. Darker grey is the shocked Al (at the edge of the spot, the shock is very weak, or negligible, the shock velocity corresponds to the sound velocity in unperturbed Al, and the degree of compression approaches 1). Along the axis of the laser beam, instead, shock compression and shock velocity reach their maximum.
a distance that must be compared with the typical depth of focus:
l≈ ±2F2λ θ
θDL ,
where we have introduced theF-number of the system, the divergence of the laser beam and the diffraction-limited divergence.
4. Two-dimensional effects and proton beam deviation
Until now, we have only considered one-dimensional (1D) hydrodynamics effects. These may lead to the formation of a plasma gradient on the target rear side and also to target defocusing (due to target displacement after shock breakout).
In reality, due to the small lateral dimension of the laser focal spot, two-dimensional (2D) effects in shock propagation and in target deformation are very important. To achieve this goal, we have performed hydro simulations using the code MULTI 2D [7]. Figure5shows the propagation and breakout of a shock wave driven in a 6µm Al target by a 1012W cm−2pedestal
case of resonant absorption, fast electrons will be mainly directed along the target normal. If instead ponderomotive effects are dominant, fast electrons will be mainly directed along the laser beam axis. In general, the two absorption mechanisms may be acting at the same time and will lead to the generation of different fast electron populations, the more energetic ones usually being related to ponderomotive effects.
The question of which is the dominant mechanism for laser absorption (and for fast electron generation) is a complicated matter and is still open to debate. While on the basis of simple scaling laws, one would expect ponderomotive effects to dominate at intensities larger than a few times 1019W cm−2, the situation is indeed far more complex. For instance,
recent measurements [9] show temperatures consistent with the scaling expected from resonant absorption still at very high intensities. Actually this depends not only on the scale length of the preplasma but also on the focusing conditions (from the experimental point of view, with tight focusing there is always a range of incident angles on targets and the conditions for resonant absorption may be different from what one expects with simple ‘planar’ laser beams). Also deformation of the front surface (due to ponderomotive pressure, plasma expansion and other effects) may change the interaction conditions. A more detailed discussion is outside the scope of the present paper, which aims to study the effects on proton emission, rather than going too deep into the mechanisms of fast electron generation. However, we would like to point out that estimating which acceleration mechanism dominates is important and must be addressed also at the experimental level. Developments in diagnostics techniques and analysis, like the important one contained in [10], may indeed help to address such a problem at the experimental level.
Figure 6 shows the sequential illustration of proton acceleration in a shocked target following the general scheme we have just described.
Also note that interesting features are expected to appear in the case of stronger shocks, which may vaporize the material near the centre of the shock front but not at the edges. In this case, acceleration of protons may be completely prevented from the central region. Nearby, however, the strong will be weaker and the target will be deformed but not vaporized. Proton acceleration may still be produced here leading to the formation of an annular emission region.
5. Experimental results
Figure 6. Sequential illustration of proton acceleration in a shocked target. (a) Before main pulse arrival, the ablation pressure induced by the ASE deforms the target. (b) The main pulse arrives under oblique incidence and generates a population of hot electrons. (c) The most energetic electrons traverse the target and set up a strong electric field in an area where the local target normal is shifted toward the laser axis, away from the global target normal. Consequently, during the plasma expansion, the most energetic protons are accelerated in a direction that is shifted toward the laser axis, with an angle that increases with the magnitude of the local deformation.
aluminium filter mask placed before it to enable the measurement of both the proton spatial and energy distributions. This is shown together with the expected proton pattern in figure7(a) (assuming a beam directed along the target normal and with divergence decreasing with increasing proton energy). Figures 7(b)–(d) show examples of the actual patterns observed in the experiments, together with plots of the deviation from the target normal to the laser direction versus proton energy (degrees versus MeV) for different parameters of the experiment (target thickness, pedestal level and pedestal duration). We see that deviation is larger when we expect so according to the physical picture described in the previous paragraphs, i.e. when the target is thin and the laser pedestal is intense or long. In all these cases, the shock has the time to burn through and deform the rear surface of the target, while the shock itself remains low enough not to cause the vaporization of the material and the formation of a plasma with sufficient extension on the rear side.
Results obtained by changing the target material confirm the effect. For instance, we have compared 6µm targets of Cu and Al. The shock speed increases with laser intensity, but is lower in Cu than in Al, due to the greater density of Cu as shown by equation (2). The lower shock speed in Cu makes shock effects less important. Indeed, experimental results (figure 8) show that in comparable conditions, deviation is smaller for Cu than for Al.
Figure 7. Deviation from the target normal to the laser direction versus proton energy (degrees versus MeV) for protons above different threshold energies. The lines through the images on the right indicate the target normal direction. (a) The effect of changing the target thickness from 12 to 6µm while keeping the pedestal duration constant (1 ns more than its minimum value) and a contrast of 3×10⁷. (b) The effect of increasing the pedestal duration by 1 ns
with a 6µm target and a contrast of 3×10⁷. (c) The effect of decreasing the
contrast (increasing the ASE level to 6×10⁶, corresponding to an estimated ASE
intensity of 5×10¹²W cm−2with a 6µm target and minimum pedestal duration
(≈1 ns) (data from [9]).
Note that although some papers (e.g. [13]) have predicted deviation of the proton emission direction, these were purely theoretical/numerical works that do not describe any experimental results. Also the context is very different, and does not refer to deviations produced by deformation of the target rear side due to the shock from a low-intensity prepulse.
6. Front side effects
Figure 8. Influence of target properties on the energy-dependent emission direction for Cu and Al foils of different thicknesses. The pedestal intensity and duration were 2×10¹²W cm−2 and 1.0 ns. The top and middle rows show representative proton beam patterns. The complete dataset is compiled in the two bottom diagrams where the error bars denote the standard deviation, taken over three consecutive shots (data from [11]).
In this way, it is possible to build a preplasma as desired in order to maximize absorption and shape the fast electron distribution. In this context, Andreevet al[14] suggest that the energy of the laser-generated protons peaks at Lo/λ≈4, where L is the characteristic scale length of the plasma profile.
From an experimental point of view, the obvious way to characterize preplasma is by performing interferometry. This was done, for example, in [15]. The experimental characterization of the preplasma, supported by computer hydrodynamics simulations, allows one to predict the evolution of the preplasma. However, at the same time, hydro simulations allow one to follow the evolution of the shock travelling in the target up to shock breakout (again such predictions can be corroborated by experimental measurements, as shown in figure 10). In turn this finally allows one to determine the minimum target thickness that is required to prevent shock breakout on the rear side. An example of how front and rear side predictions can be used together is shown in figure 10. The laser source used in the experiment was a CPA Ti:sapphire yielding 40 mJ on the target in 150 fs duration, resulting in a peak intensity on the target of 4×10¹⁵W cm−2. We see that in order to obtainL/λ≈4 (as predicted in [14])
Figure 9. Comparison of the prediction of the shock model and experimental results: proton deflection versus pedestal duration. Targets were 6µm Al and Cu at a pedestal intensity of 2×10¹¹W cm−2. The proton beam stays on the target normal for the shortest pedestals (bottom right panel). After shock breakout, the beam is steered toward the laser axis (top right panel). The inset shows the calcu-lated shape of the foil for a 2.0 ns pedestal. Emission direction (solid lines) is cal-culated as the local target normal where the laser axis intersects the rear surface.
Figure 10. Left: Temporal evolution of the plasma profile: the dotted line represents the propagation of the critical density front nc=1.72×1021cm3,
for λ=800 nm; the continuous line gives the gradient length Lo evaluated between nc and nc/e. Right: Shock propagation in the bulk material obtained
from hydro simulations and compared to shock breakout measurements obtained by the reflectivity diagnostics. The linear interpolation yields a quasi-constant shock velocityD≈16 km s−1. 0 marks the position of the target surface
[image:12.595.148.468.417.600.2]Figure 11.Cut-off proton energy (MeV) versus the delay between the prepulse beam and the main beam (in picoseconds).
Actual measurement of proton energy versus the scale length of the front preplasma was performed by various groups. Figure11shows the measurements by Flaccoet alshowing some enhancement. However, firstly the enhancement was much smaller than was expected from simulations (∼17% against 50% predicted by Andreevet al) and, secondly, it was not always reproducible. This points to a different effect than that studied in [14].
Similar, but more robust, experimental results were obtained by McKennaet al[16,17] in an experiment at RAL. They observed not only a significant enhancement in proton energy (see figure12) but also, in exactly the same conditions, an increase in conversion efficiency (proton number), implying an increased absorption of laser light.
However, the enhancement was taking place at a large scale length, in a range different from that predicted in [14]. In this case, an interferometric analysis of the interacting target showed the presence of laser beam channelling, or laser beam filamentation, in the ‘preplasma’ corona. Therefore, we are looking at the consequences of nonlinear interaction, which completely alters the laser intensity on the target and the interaction conditions.
We can therefore conclude that at the moment, the effect predicted in [14] is probably not observed yet, while nonlinear interactions in the plasma corona are also showing interesting consequences on proton generation, which probably deserves more careful studies in order to be routinely used in future experiments for laser-induced generation of protons.
7. Conclusions
Figure 12. Left: Maximum proton energy versus Lo. Centre: Laser-to-proton energy conversion efficiency versus Lo. In both cases, the scale length Lo
was varied either by changing the prepulse intensity on the target (Iabl) up to 5.0 TW cm−2, for a fixed 1t time delay between the two beams (1t =
0.5 ns), or by changing1t, up to 3.6 ns, for a fixed Iabl=1.0 TW cm−2. Right:
interferometric image showing filamentation of the CPA laser in long-scale-length preplasma. The laser pulses are incident from the left and self-emission at the critical surface is observed.
On the target front side, the scale length of the preplasma, in principle, allows one to control the amount of laser absorption and also the shape of the fast electron distribution function. Interesting measurements show the enhancement of the maximum proton energy when the laser beams channel in the preplasma corona.
Acknowledgment
This work was partially supported by EPSRC (grant number EP/E048668/1).
References
[1] Kaluza Met al2004Phys. Rev. Lett.93045003
[2] Flacco A, Sylla F, Veltcheva M, Carrié M, Nuter R, Lefebvre E, Batani D and Malka V 2010 Dependence on pulse duration and foil thickness in high-contrast-laser proton accelerationPhys. Rev.E81036405
[3] Zeldovich Y B and Raizer Y P 1967 Physics of Shock Waves and High Temperature Hydrodynamic Phenomena(New York: Academic)
[4] Lindl J 1995Phys. Plasmas23933
[5] T4 Group LANL 1983SESAME Report on the Los Alamos Equation of State LibraryLALP-83–4 (Sesame tables 3712 and 3717 for Al)
[6] Bushman A V, Kanel G I, Ni A L and Fortov V E 1993Intense Dynamic Loading of Condensed Matter (London: Taylor and Francis)
[8] Ramis R and Meyer-ter-Vehn J 1992ReportMPQ174 (Max-Planck-Institut fur Quantenoptik)
[9] King J Aet al2009 Studies on the transport of high intensity laser-generated hot electrons in cone coupled wire targetsPhys. Plasmas16020701
[10] Popescu Het al2005 Subfemtosecond, coherent, relativistic, and ballistic electron bunches generated atωo
and 2ωoin high intensity laser–matter interactionPhys. Plasmas12063106
[11] Lindau F, Lundh O, Persson A, McKenna P, Osvay K, Batani D and Wahlstrom C-G 2005 Laser-accelerated protons with energy dependent beam directionPhys. Rev. Lett.95175002
[12] Lundh O, Lindau F, Persson A, Wahlström C-G, McKenna P and Batani D 2007 Influence of shock waves on laser-driven proton accelerationPhys. Rev.E76026404
[13] Sheng Z-M, Sentoku Y, Mima K, Zhang J, Yu W and Meyer-ter-Vehn J 2000 Angular distributions of fast electrons, ions, and bremsstrahlung x/γ-rays in intense laser interaction with solid targetsPhys. Rev. Lett.
855340
[14] Andreev A A, Sonobe R, Kawata S, Miyazaki S, Sakai K, Miyauchi K, Kikuchi T, Platonov K and Nemoto K 2006 Effect of a laser prepulse on fast ion generation in the interaction of ultra-short intense laser pulses with a limited-mass foil targetPlasma Phys. Control. Fusion481605–19
[15] Flacco A, Guemnie-Tafo A, Nuter R, Veltcheva M, Batani D, Lefebvre E and Malka V 2008 Characterization of a controlled plasma expansion in vacuum for laser driven ion accelerationJ. Appl. Phys.104103304
[16] Carroll D Cet al2009 Dynamic control and enhancement of laser-accelerated protons using multiple laser pulsesC. R. Phys.18188–96
![Figure 1. Correlation between proton cut-off energy and target thickness atI ≈ 1019 W cm−2 and with a prepulse duration ≈ 0.5 ns [1] and at I ≈ 5 ×10¹⁹ W cm−2 [2].](https://thumb-us.123doks.com/thumbv2/123dok_us/1690195.122380/3.595.148.402.95.351/figure-correlation-proton-energy-target-thickness-prepulse-duration.webp)
![Figure 2. High-pressure phase diagram of Al [the melting curve, the vaporization curve, and the shock adiabatic, together with6] (1 Mbar = 100 GPa) showingexperimental data.](https://thumb-us.123doks.com/thumbv2/123dok_us/1690195.122380/4.595.148.408.95.305/figure-pressure-diagram-melting-vaporization-shock-adiabatic-showingexperimental.webp)