R E S E A R C H A R T I C L E
Open Access
A simulation tool for better management
of retinal services
Eren Demir
1,2*, David Southern
2, Aimee Verner
3and Winfried Amoaku
4Abstract
Background:Advances in the management of retinal diseases have been fast-paced as new treatments become
available, resulting in increasing numbers of patients receiving treatment in hospital retinal services. These patients require frequent and long-term follow-up and repeated treatments, resulting in increased pressure on clinical workloads. Due to limited clinic capacity, many National Health Service (NHS) clinics are failing to maintain recommended follow-up intervals for patients receiving care. As such, clear and robust, long term retinal service models are required to assess and respond to the needs of local populations, both currently and in the future.
Methods:A discrete event simulation (DES) tool was developed to facilitate the improvement of retinal services by identifying efficiencies and cost savings within the pathway of care. For a mid-size hospital in England serving a population of over 500,000, we used 36 months of patient level data in conjunction with statistical forecasting and simulation to predict the impact of making changes within the service.
Results:A simulation of increased demand and a potential solution of the‘Treat and Extend’(T&E) regimen which is reported to result in better outcomes, in combination with virtual clinics which improve quality, effectiveness and productivity and thus increase capacity is presented. Without the virtual clinic, where T&E is implemented along with the current service, we notice a sharp increase in the number of follow-ups, number of Anti-VEGF injections, and utilisation of resources. In the case of combining T&E with virtual clinics, there is a negligible (almost 0%) impact on utilisation of resources.
Conclusions:Expansion of services to accommodate increasing number of patients seen and treated in retinal
services is feasible with service re-organisation. It is inevitable that some form of initial investment is required to implement service expansion through T&E and virtual clinics. However, modelling with DES indicates that such investment is outweighed by cost reductions in the long term as more patients receive optimal treatment and retain vision with better outcomes. The model also shows that the service will experience an average of 10% increase in surplus capacity.
Keywords:Virtual clinics, Treat and extend, Retinal services, Discrete event simulation, Patient flow modelling
Background
Hospital Eye Services in the United Kingdom (UK) National Health Service (NHS) have consistently had a low profile, despite providing a high volume of work. They account for nearly one in ten hospital outpatient appointments, as the second highest demand specialty with 5.95 million clinic at-tendances in 2009/10 in England and 7–8% of all surgical operations performed by the NHS. Furthermore, demand has risen by 25% over 7 years [1].
Amongst all ophthalmology clinic attendances, retinal vascular diseases are a leading cause of sight loss. The three specific causes of such visual loss are age related macular degeneration (AMD), diabetic retinopathy (DR), and retinal vascular occlusions (RVO). These conditions are of particular interest as their prevalence is rising in an increasingly ageing population, as AMD and RVO are as-sociated with increasing age, and diabetes mellitus, occurs more frequently. AMD as a serious macular disorder, which is forecasted to rise from 513,000 in 2010 to 679,000 in 2020, an increase of 32% in just 10 years [2]. These patients may require monthly outpatient visits and * Correspondence:[email protected]
1University of Hertfordshire, Hertfordshire Business School, Hertfordshire, UK 2Pathway Communications Ltd, Cambridge, UK
Full list of author information is available at the end of the article
treatments until disease stability is achieved, followed by implementation of various regimens including pro re nata (PRN) treatment, fixed interval dosing being the most popular until recently [3–6]. Emerging evidence suggests that outcomes are better with Treat and Extend (T&E) regimen [7–11]. However, these treatments and regimen are resource intensive, and require multi-disciplinary teams including photographers, optometrists, specialist
nurses, and pharmacists, in addition to the
ophthalmologist.
Given the frequency of treatment and monitoring visits (usually monthly), combined with increasing de-mand for services where the number of treatable pa-tients potentially suitable for treatment have risen markedly, many NHS ophthalmology clinics are cur-rently running at 100% capacity and some are failing to maintain the recommended follow-up and re-treatment intervals. Most of these clinics which are running at maximum capacity may not have scope for further ex-pansion. They cannot cope with the current patient numbers, let alone allow for future increases in patient numbers.
It is clear that robust and long term retinal service delivery modelling is required across NHS clinics in order to determine the current and future needs of local populations, so that there is no future com-promise in the standard of service provision,
includ-ing follow-up (FU) intervals and quality of
intravitreal treatment administration. Amoaku et al. (2012) [12] produced a comprehensive list of changes that can be made in order to meet existing demand and needs of patients with limited resources and capacity. In that publication, the authors shared a number of service re-design case studies, e.g., virtual clinics. Virtual clinics usually consist of non-mydriatic photos of the optic disc, visual fields, and visual acuity measurements carried out by a technician, stored, and later reviewed by an Ophthal-mologist [13]. A virtual clinic can be within a hospital set-ting or in a location within the community. If it is located in the community then patients are shifted from a hospital setting where treatment (or a follow-up routine appoint-ment) is provided out in the community, thus releasing the pressure on hospitals. A number of other authors have presented similar models (including virtual clinics) of dealing with capacity constraints [14–18].
Despite these efforts, the quantifiable impact of re-designing retinal services has never been studied. Whether planned service re-design will actually result in increased capacity, and if so how much cost improve-ment will result remains unknown. Furthermore, it is unknown as to how a change in one area of the service will impact on resources in another including activity (new and FU appointments), resource utilisation and costing and revenue.
The aims of this study are therefore: 1) to develop a discrete event simulation (DES) model, which captures the retinal service treatment pathways and service re-designs including virtual clinics; 2) Second, to deter-mine possible and realistic policies, which could be im-plemented with regard to an increased use of virtual clinics combined with a new treatment regimen (known as treat and extend), and how these would affect hospital based treatment; 3) to evaluate the impact of the imple-mentation of this service re-design on a number of oper-ational and cost performance indicators relevant to the delivery of retinal services. This should provide an indi-cation of the feasibility and scale of improvement, both operationally and patient outcomes, and allow health managers to make informed decisions with regard to the best ways to reconfigure the delivery of retinal services in the UK. This study was based on the retinal service of a mid-sized NHS hospital Trust in England.
Methods
A unique version of a discrete event simulation model was developed for Cambridge University Hospitals NHS Foundation Trust in three stages. Firstly, the Trust’s pa-tient level ophthalmology data was anonymised and ana-lysed in greater detail. Secondly, the structure of the Trust’s intravitreal injection service as delivered at the time (mainly a prn regime) was established using man-agement and clinician expertise. Finally, the combination of both sets of analysis and statistical forecasts were en-tered into the model. Using sophisticated statistical algo-rithms, we forecast activity by patient type (AMD, DR and RVO) broken down by new patients and follow-up (FU) visits. The simulation was then ran many times giv-ing accurate information on the next twelve months of activity, resource utilisation and revenue/costing to pro-vide baseline values. The baseline was then compared to any number of other alternative methods of delivering the intravitreal injection service. This enabled the Trust to explore the impact of service redesign options rapidly and with ease in order to identify the most effective solutions.
The problem/hypothesis
methodology to T&E in order to improve patient out-comes. However, this would mean an increase in the num-ber of injections to 8, 6 and 4–5 in years 1, 2 and 3, respectively. Analysis of the service data indicated that there was insufficient capacity to increase the number of injections at neutral cost without other service changes. The adoption of virtual clinics seemed to have the impact of reducing the number of FU appointments at the Trust.
Conceptualising retinal service patient pathway
The objective was to explore the clinic pathway in ret-inal services in order to establish what, in the experts’ opinion, were important areas for development. The pathway mapping consisted of structured interviews with retinal service nurses across a number of clinics be-tween March and August 2015. The interviewer dis-cussed each stage of the pathway with the interviewee taking account of the interviewee’s opinion and adjusting the pathway in‘real time’as comments were made.
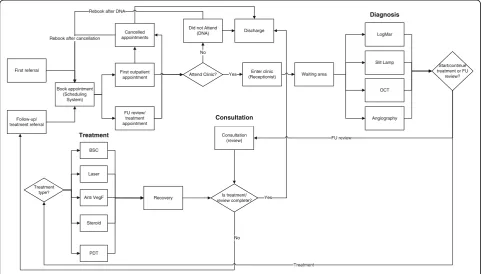
According to the interviews, the typical care system in place in the NHS and elsewhere, for the diagnosis, initial treatment and subsequent FU/treatments in patients with eye problems comprised of a complex set of ser-vices offered in and out of hospital. Fig. 1 shows the inner workings of the retinal service pathway diagram-matically. Patients were referred (first referral) to retinal services via their General Practitioner (GP) or commu-nity optometrist and, on a small number of occasions,
via accident and emergency (A&E) or outpatient ser-vices. FU evaluation and treatment would subsequently follow. Existing patients will either continue treatment (primarily with intravitreal injections) and/or continue with monitoring/assessment (follow-up review) as de-scribed in SUSTAIN study [4]. To facilitate real life set-ting, the Trust’s appointment booking system was incorporated into the model to ensure bookings were captured accordingly. Where a patient either cancelled or ‘did not attend’ (DNA) re-bookings were made ac-cording to the service rules.
Patient level data analysis and forecasting
Thirty-six months of individual patient level data was obtained from Cambridge University Hospitals NHS Trust (April 2013 – March 2016). Using the statistical software R (library package forecast), a series of models was developed to forecast activity by patient type (nAMD, DR and RVO) broken down into“new patients” and “FUs”. The forecasted activity was then adjusted for population growth rates and collated to estimate future activity for 2016–17 (12 months forecast). When the projected activity for 2015–16 was compared with the actual activity, forecast accuracy was in the region of 90–99%.
In addition to demand forecasting, many parameters were estimated and their distributions were identified by using the fitdistrpackage in R, such as the distribution
First referral
Book appointment (Scheduling
System)
First outpatient appointment
Cancelled appointments
Discharge
Follow-up/ treatment referral
FU review/ treatment appointment
Did not Attend (DNA)
Enter clinic (Receptionist) Rebook after DNA
Waiting area
LogMar
Slit Lamp
OCT
Angiography
Diagnosis
Laser
Anti VegF
Steroid
PDT Treatment
type?
Recovery
Consultation (review)
Is treatment/ review complete? Yes
No Attend Clinic? Yes
Start/continue treatment or FU review?
Treatment BSC
FU review No
Rebook after cancellation
Consultation
Treatment
[image:3.595.57.539.443.717.2]of the number of injections in years 1, 2 and 3 of treat-ment, waiting time for the first outpatient appointtreat-ment, distribution of the number of FU assessments in each of the 3 years. Individual patients were tracked over the 36 month period and the number of times the patient was injected and monitored was counted within each of the 3 years.
Model input parameters
Model inputs included staffing levels and salaries, staff availability, staff responsibilities, treatment pathways, ar-rivals (forecasted activity by new vs. follow-up atten-dances), percentage of patients falling into each category (nAMD, DR and RVO), costing of each service/drug/ staff, treatment option visit parameters, appointment booking system parameters, clinician rota system, room/ injection bed availability and weekly clinic sessions. The majority of input parameters were estimated through ex-haustive analysis of patient level data, and where no data was available literature and/or expert opinion was used. See Additional file 1: Table S5 for the list of input parameters.
Service re-design
Service delivery configurations involving increased use of community services (e.g. virtual clinics) could yield ef-ficiency gains both operationally and financially. Oper-ationally, it reduces unnecessary hospital attendances to ophthalmology clinics, and the need for consultations with ophthalmology doctors and nurses. Financially, treating patients in the community (i.e. within a virtual clinic setting) has a significant cost advantage over treat-ment in hospitals. The average cost of an outpatient follow-up assessment (or routine check-up) is around £89, whereas the same visit within a virtual clinic would cost in the region of £30–£45 [19]. This is why increased use of virtual clinics are welcomed by the Department of Health and Social Care in England, and in-line with their current policies. Virtual clinics are also welcomed by key decision makers within ophthalmology clinics, including service managers, consultants and senior nurses. It re-lieves the pressure for patient’s waiting for an outpatient appointment (first referral) and existing patients to re-ceive frequency of treatment as recommended by the National Institute for Health and Care Excellence (NICE) [20]. The vast majority of research with regard to ophthalmology clinic operations and performance evaluation, has focused on quality of life of patients and the effects of AMD, DR and RVO related symptoms and social factors on the physical and psychological well-being of patients.
The lack of research to evaluate operational and cost performance of possible service re-designs within retinal services warrants further investigation. The discrete event
simulation model we have developed here enables us to experiment any combination of service re-design configu-rations, i.e., the model is generic enough to run any set of scenarios.
Amongst many service configurations virtual clinic is known to be the most popular form of service re-design, which was also requested by ophthalmology (retinal ser-vice) managers, doctors and senior nurses. In addition to virtual clinics we also experiment the system under a new treatment regime. Therefore, in order to change from the existing service utilisation of the PRN to a T&E regime to improve patient outcomes, an increase in the number of injections to 8, 6 and 5 in years 1, 2 and 3, re-spectively would be required. Analysis of the service data showed clearly that at the time there was insufficient capacity to increase the number of injections. Projec-tions were made as to how many appointment slots were required in order to bridge the capacity shortfall. The impact such a service change on activity, resource util-isation, costing and revenue required determination.
Results
According to the patient level data the Trust had a total of 6520 attending patients, including 17.2%, 42.3% and 40.5% are nAMD, DR and other medical retina (MR) conditions (including 50% RVO patients, and the remaining 50% which were non-AMD/DR/RVO related), respectively.
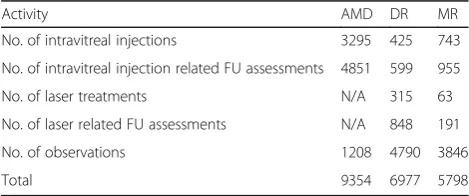
Over the 3 year period of April 2013– March 2016, a total of 22,129 appointments were attended, of which 42% were nAMD related (9354), 32% DR (6977) and 26% other MRE diseases including RVO (5798) (see Table1).
The 3295 injections for nAMD patients incurred 4851 FU assessments and a further 1208 assessments for pa-tients who had no form of treatment (observation only). Approximately 69% and 66% of activity for DR and MR respectively were observation/monitoring only, and did not require any intravitreal injections.
[image:4.595.304.539.617.715.2]Table2shows the average number of intravitreal injec-tions and FU assessments over the 3 year data period. Patient level data in this study showed that patients
Table 1Breakdown of activity by attended appointments during April 2013–March 2016
Activity AMD DR MR
No. of intravitreal injections 3295 425 743
No. of intravitreal injection related FU assessments 4851 599 955
No. of laser treatments N/A 315 63
No. of laser related FU assessments N/A 848 191
No. of observations 1208 4790 3846
Total 9354 6977 5798
received between 1 and 14 times in a year with signifi-cantly lower averages. However, the model inputs uti-lised distributions rather than these averages, for example, the distribution for FU assessments for obser-vations is log-normal with mean of 1.4 and standard de-viation (SD) of 0.37. According to the data, only 1% and 19% of treated and non-treated patients, respectively are discharged. Amongst those non-treated discharged pa-tients, the vast majority are discharged at the end of year 1 and the discharge probability reduced dramatically from year 2 onwards (see Table3for details). In the UK, discharge from the hospital is the point at which the pa-tient leaves the hospital and either returns home or is transferred to another facility.
The number of patients who had no form of treatment (ie observations only) over the data period was 5505 (Table3). Out of this cohort the number of patients who attended in the last 2 years and were ‘observation only’ (ie persons who had no form of treatment) in the last 6 months was 894. This group of patients were referred
to a nurse-led virtual clinic, where images are obtained from patients in absence of the clinician. The images were then reviewed subsequently by a clinician or other trained personnel who made disease management deci-sions. Extra capacity was achieved by referring 894 pa-tients to a virtual clinic [18] in order to enable T&E regimen to be implemented.
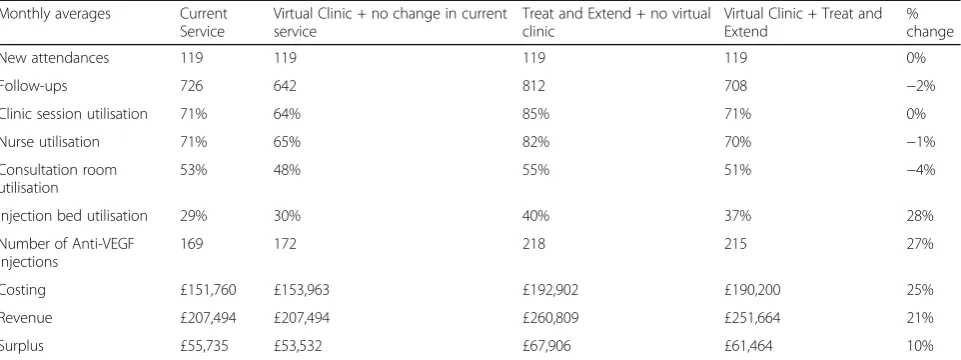
Table 4 displays the monthly average efficiencies that could be achieved through service re-design as fore-casted by the model. Column 1 figures display the‘as is’, or current state for the service if it were to continue un-changed for each resource. The second column shows the impact of introducing a virtual clinic (with no change in current service), where 894 patients were seen. As these patients are shifted from current setting to the virtual clinic, we notice a reduction in all key met-rics, e.g., number of follow-ups (from 726 to 642), and clinic session utilisation (71% to 64%). The model has in-cluded all costing and resourcing of running the virtual clinic. We also experimented where T&E is considered without the virtual clinic (third column). As expected, there is a sharp increase in the number of follow-ups, number of Anti-VEGF injections, and utilisation of re-sources. For instance, clinic and nurse utilisations has increased to a critical level of 85%, and without add-itional staff the system may not be able to cope with a slight increase in new attendances. This may not be a vi-able option, clearly showcasing the need to test the sys-tem with a combination of virtual clinics and T&E regime.
The fourth column shows the efficiencies generated comparing the current service against the combination of virtual clinics and T&E. A T&E regime in combin-ation with a virtual clinic did not result in an increase in staff utilisation, but provided a noticeable increase in capacity with a 10% surplus. This provided the oppor-tunity for investment in the service, with the increase in the quality of treatment and improvement in patient outcomes.
Discussion
[image:5.595.57.541.99.201.2]The ever increasing demand in medical retinal services following the introduction of new therapies has resulted Table 2The average number of intravitreal injections and FU assessments over the 3 year data period
AMD DR MR
Year of treatment Year of treatment Year of treatment
Year 1
Year 2
Year 3
Year 1
Year 2
Year 3
Year 1
Year 2
Year 3
Average no. of intravitreal injections 4 3 2.5 3.5 2.6 2.6 4 2.8 2.4
Average no. of FU assessments for injected patients 4.8 4 3.6 3.3 3.1 3.6 3.7 3.1 2.5
Average no. of FU assessments for non-treated patients (i.e. observations only)
[image:5.595.56.290.508.731.2]1.7 1.6 1.4 1.4 1.4 1.2 1.4 1.4 1.1
Table 3The number of discharged patients whether in treatment or under observation over 36 month’s data period broken down by patient type
In treatment Under observation Total
Number of discharged patients at the end of Year 1 of treatment
AMD 12 147 159
DR 1 330 331
MR 13 611 624
Number of discharged patients at the end of Year 2 of treatment
AMD 16 14 30
DR 5 32 37
MR 13 58 71
Number of discharged patients at the end of Year 3 of treatment
AMD 10 10 20
DR 1 24 25
MR 4 23 27
Total discharges 75 (1%) 1249 (19%) 1324 (20%)
Total non-discharges 950 (15%) 4256 (65%) 5206 (80%)
in serious capacity constraints, such that some NHS clinics are failing to maintain the recommended follow-up/treatment intervals. This may have an increased risk of permanent vision loss, with huge impact on inde-pendence and quality of life of patients. It is, therefore, clear that robust and long term retinal service models that do not compromise visual outcomes, such as T&E in combination with virtual clinics, are required across NHS clinics in order to meet the needs of local populations currently and in the future. Such long-term management strategy of retinal dis-ease in virtual clinics has been employed by a number Trusts in the UK and proven to be safe and effective if properly implemented [18].
The developed model is a new tool for forecasting and planning to support decision making in ophthalmology services. Using patient level data relating to the service, in conjunction with forecasting and simulation, enables a Trust to confidently predict the impact of making changes within the service. The flexibility of the model enables the impact of a wide range of scenarios to be tested (around several thousand scenarios can be tested). A potential solution (T&E in combination with virtual clinic) is presented here that is shown to improve qual-ity, effectiveness and productivity and thus increase cap-acity. Despite the increase in the number of injections (with T&E), the impact on resource utilisation is negli-gible (almost 0%) and in some cases below 0%.
Spreadsheet based models commonly use averages, for example the average number of patients expected each day followed by the average number of patients who will be diagnosed with nAMD followed by the average num-ber of injections in the first year. The problem with using averages in this way may lead to wildly incorrect predictions, commonly known as the ‘error of averages’ (Salvage, 2009) [21]. Arguably when considering services that have a turnover of many millions of pounds it is very important to be accurate.
Unlike spreadsheet models, the power of discrete event simulation in general is the ability to capture vari-ability. For example, some guidelines assume that anti-VEGF treatments are injected on average of 7 times in the first year, although patient level data analysis in this study showed that there were 1–14 intravitreal in-jections in a year with significantly lower averages. As such assuming that all patients received an average of 7 injections per year could be misleading.
The choice of using simulation methods as opposed to analytical methods was partly dictated by the complexity of the pathway and the ease of use for end-users. In this respect, the need to track individual patient journeys (or trajectories) through the care system, the ability to cap-ture the complex web of interactions of patients going through the diagnosis stage to various forms of treat-ment (including FUs) and the need to model notions of limited availability of resources (such as staff, beds, rooms and equipment) have motivated us to select discrete event simulation.
Instead of using averages our model uses each hospital Trusts’anonymised patient level data to track individual patients over a 36-month period. It counts the number of times a patient is treated and assessed in years 1, 2 and 3. It then uses statistical algorithms to establish the distribution, for example, treatment frequency for each year, for example log normal distribution with a mean and SD. The model is then run hundreds of times for thousands of patients where the distribution determines the number of times a patient is injected, as opposed to using an average of 7 injections per year for each patient. It is because the model pays close attention to these de-tails, that it is able to create validated reports that are up to 95% accurate.
[image:6.595.58.539.99.279.2]A constraint on modelling analysis is the recognition of essential resources that are required in order for an event to happen. For example, it is not possible for a Table 4The impact of current service against the combination of virtual clinics and treat and extend
Monthly averages Current Service
Virtual Clinic + no change in current service
Treat and Extend + no virtual clinic
Virtual Clinic + Treat and Extend
% change
New attendances 119 119 119 119 0%
Follow-ups 726 642 812 708 −2%
Clinic session utilisation 71% 64% 85% 71% 0%
Nurse utilisation 71% 65% 82% 70% −1%
Consultation room utilisation
53% 48% 55% 51% −4%
Injection bed utilisation 29% 30% 40% 37% 28%
Number of Anti-VEGF injections
169 172 218 215 27%
Costing £151,760 £153,963 £192,902 £190,200 25%
Revenue £207,494 £207,494 £260,809 £251,664 21%
clinic to start without a clinician. The model only starts a clinic when all the resources required are available. In-travitreal services are complex with many hundreds of variables/constraints. The ability to deal with these com-plex constraints simply does not exist in excel or any other modelling approaches. Using the model it is possible to show what happens if there is a variation in the availability of resources/constraints such as the increase or reduction in the number of clinic rooms available, or the effect of an absent clinician. Given the level of complexity and value of intravitreal services, it is extremely important to ensure that model outputs are robust and accurate.
The National Institute for Health and Care Excellence (NICE) has recognised the methodology used in the model as a valid way of simulating complex patient path-ways [22]. To the best of our knowledge, this model is currently the only simulation based planning tool for retinal service managers. Other such programmes or fur-ther development would be welcome.
Re-design of clinical services based on such pro-grammes, nevertheless, requires investment, although such investment is outweighed by the potential increases in surplus generated from efficient service re-design. More importantly, optimum service re-design also leads to bet-ter quality of care that meet patients’ needs, as well in-creased productivity by maximising the use of experienced clinicians. Furthermore, significant cost reductions are ex-pected in the long-term as more patients retain their vi-sion with better clinical outcomes due to the T&E or other similar regimen.
The authors are aware of the many difficulties that are faced in the planning, approval, and implementation of new retinal services. Changes can be introduced without proper consideration of the impact on the service, and as a result most business cases are inaccurate [12]. Fre-quently clinicians working within retinal services know how they would like to improve the service they deliver, but lack the expertise to frame those improvements in a manner that is acceptable to health service executives and managers who hold finance budget. The model was developed in conjunction with retinal specialists, specif-ically to address these issues. It is designed to allow ‘non-experts’ to test change on the pathway within the validated simulation. The simulation will present the im-pact of changes in a way that can be easily understood by both the healthcare executives and the pathway spe-cialists. The intention is that this tool will facilitate ser-vice planning and decision making and speed up the pace of change in the retinal pathway.
The tool allows decision makers to develop a bet-ter understanding of key performance metrics associ-ated with activity, cost implications and resource utilisation. The ease of use of the tool with relevant sets of exported results means that senior decision
makers can be more proactive and confident with evidence based approach in re-designing their care pathway in finding the most efficient and effective delivery of care to patients with problems in the eye.
Conclusions
In conclusion, the model allows the use of pathway plan-ning to improve clinic efficiency and patient outcomes without necessarily increasing costs in the long-term.
Additional file
Additional file 1:BMC HSR Data for simulation model. Table S5. Data used for the simulation model. Table providing details of parameters used in the simulation model including the source, distribution type and the value entered in the model. (DOCX 19 kb)
Abbreviations
A&E:Accident & Emergency; AMD: Age Related Macular Degeneration; anti-VEGF: anti-Vascular Endothelial Growth Factor; DNA: Did Not Attend; DR: Diabetic Retinopathy; FU: Follow-up; GP: General Practitioner; MR: Medical Retina; nAMD: neovascular Age Related Macular Degeneration; NHS: National Health Service; NICE: National Institute for Health and Care Excellence; PRN: Pro Re Nata; RVO: Retinal Vein Occlusion; SD-OCT: Spectral Domain Optical Coherence Tomography; T&E: Treat & Extend
Acknowledgements
We would thank Allergan and the following Retinal Service nurses for their invaluable input towards establishing the retinal service pathway: Pam Kaur, Derby Hospitals NHS Foundation Trust; Julie Mitchell, James Paget University Hospitals NHS Foundation Trust; Anita Wyborn, Maidstone & Tunbridge Wells NHS Trust; Valerie Mooring, York Hospital NHS Foundation; Tracey Allen, University Hospitals Birmingham NHS Foundation, and Androulla Antoniou, Moorfields Eye Hospital NHS Trust.
Availability of data and materials
The data entered in the model is included in the additional file“BMC Health Services Research paper additional file data for the model”, which has been submitted with the paper. The National Tariff Payment System, NICE and MIMs data used to estimate some of the parameters in the model are publicly available. The links to the website and the date when it was accessed are available on the list of references of the paper (Reference numbers [20,23,24]). The dataset provided by Cambridge University Hospitals NHS Foundation Trust, which was used to estimate some of the parameters for the model, is held in the computer of one of the authors. It cannot be made publicly available as this is one of the conditions of acquiring the dataset. In addition, the data is not readable and needs database programming to be extracted, hence it cannot be made accessible.
Authors’contributions
ED and DS conceptualise and developed the DES model. ED and WA wrote the paper with the contribution of DS and AV. All authors agreed on the final version of the paper. All authors read and approved the final manuscript.
Ethics approval and consent to participate
service managers, where participants had given full consent. As stated in Declarations section, UK ethical approval is not a compulsory requirement for studies which do not involve patients (see the following link for details http://www.hra.nhs.uk/documents/2013/09/does-my-project-require-rec-review.pdf).
Consent for publication Not applicable.
Competing interests
David Southern is an employee of Pathway Communications. No conflicting relationship exists for the other authors regarding this article.
Publisher’s Note
Springer Nature remains neutral with regard to jurisdictional claims in published maps and institutional affiliations.
Author details
1University of Hertfordshire, Hertfordshire Business School, Hertfordshire, UK. 2
Pathway Communications Ltd, Cambridge, UK.3Cambridge University Hospitals NHS Foundation Trust, Cambridge, UK.4Academic Ophthalmology,
DCN, Faculty of Medicine, The University of Nottingham, Nottingham, UK.
Received: 20 June 2017 Accepted: 24 September 2018
References
1. UK Vision Strategy 2013–18. 2013. https://www.visionuk.org.uk/refreshed-uk-vision-strategy-2013-18/. Accessed 14 Nov 2014.
2. Owen CG, Jarrar Z, Wormald R, Cook DG. The estimated prevalence and incidence of late stage age related macular degeneration in the UK. Br J Ophthalmol. 2012;96:752–6.
3. Lalwani GA, Rosenfeld PJ, Fung AE, et al. A variable-dosing regimen with intravitreal ranibizumab for neovascular age-related macular degeneration: year 2 of the PrONTO study. Am J Ophthalmol. 2009;148:43–58. 4. Holz FG, Amoaku W, Donate J, Guymer RH, Kellner U, Schlingemann RO,
Weichselberger A, Staurenghi G, SUSTAIN Study Group. Safety and efficacy of a flexible dosing regimen of ranibizumab in neovascular age-related macular degeneration: the SUSTAIN study. Ophthalmology. 2011;118:663–71. 5. Haller JA. Current anti-vascular endothelial growth factor dosing regimens:
benefits and burden. Ophthalmology. 2013;120:S3–7.
6. Gupta OP, Shienbaum G, Patel AH, Fecarotta C, Kaiser RS, Regillo CD. A treat and extend regimen using ranibizumab for neovascular age-related macular degeneration clinical and economic impact. Ophthalmology. 2010;117:2134–40. 7. Rush RB, Simunovic MP, Vandiver L, Aragon AV 2nd, Ysasaga JE.
Treat-and-extend bevacizumab for neovascular age related macular degeneration: the importance of baseline characteristics. Retina. 2014;34:846–52.
8. Hatz K, Prünte C. Changing from a pro re nata treatment regimen to a treat and extend regimen with ranibizumab in neovascular age-related macular degeneration. Br J Ophthalmol. 2016;100:1341–5.
9. Hatz K, Prünte C. Treat and extend versus pro re Nata regimens of ranibizumab in neovascular age-related macular degeneration: a comparative 12 month study. Acta Ophtholmol. 2017;95:e67–72. https://doi.org/10.1111/aos.13031.
10. Kvannli L, Krohn J. Switching from pro re nata to treat-and-extend regimen improves visual acuity in patients with neovascular age-related macular degeneration. Acta Ophthalmol. 2017.https://doi.org/10.1111/aos.13356. 11. Danyliv A, Glanville J, McCool R, Ferreira A, Skelly A, Jacob RP. The
clinical effectiveness of Ranibizumab treat and extend regimen in nAMD: systematic review and network meta-analysis. Adv Ther. 2017. https://doi.org/10.1007/s12325-017-0484-0.
12. Amoaku W, Blakeney S, Freeman M, Gale R, Johnston R, Kelly SP, McLaughlan B, Sahu D, Varma D. Action on AMD: Optimising patient management: act now to ensure current and continual delivery of best possible patient care. Eye. 2012;26:S1–S21.
13. Karsten K, Fasler K, Charnle A, et al. Implementation of medical retina virtual clinics in a tertiary eye care referral Centre. Br J Ophthalmol. 2018.https://doi.org/10.1136/bjophthalmol-2017-311494.
14. Trikha S, Macgregor C, Jeffery M, Kirwan J. The Portsmouth based glaucoma refinement scheme: a role for virtual clinics in the future? Eye. 2012;26:1288–94.
15. Kotecha A, Bonstein K, Cable R, Cammack J, Clipston J, Foster P. Qualitative investigation of patients’experience of a glaucoma virtual clinic in a specialist ophthalmic hospital in London, UK. BMJ Open. 2015;5(12):e009463. https://doi.org/10.1136/bmjopen-2015-009463.
16. Kotecha A, Baldwin A, Brookes J, Foster PJ. Experiences with developing and implementing a virtual clinic for glaucoma care in an NHS setting. Clin Ophthalmol. 2015;9:1915–23.
17. Wright HR, Diamond JP. Service innovation in glaucoma management: using a web-based electronic patient record to facilitate virtual specialist supervision of a shared care glaucoma programme. Br J Ophthalmol. 2015;99:313–7. 18. Tsaousis KT, Empeslidis T, Konidaris VE, Kapoor B, Deane J. The concept of
virtual clinics in monitoring patients with age-related macular degeneration. Acta Ophthalmol. 2016;94:353–5.
19. NHS Improvement (2017). NHS Reference Costs 2017. Retrieved June 13, 2017, fromhttps://improvement.nhs.uk/resources/reference-costs/. 20. NICE (2013). Ranibizumab and Pegaptanib for the treatment of
age-related macular degeneration. Retrieved June 20, 2017, from https://www.nice.org.uk/guidance/ta155/resources.
21. Salvage S. The flaw of averages: why we underestimate risk in the face of uncertainty. New Jersey: Wiley; 2009.
22. Davis S, Stevenson M, Tappenden P and Wailoo A. NICE DSU Technical support document 15: Cost effective modelling using patient level modelling. 2014.http://nicedsu.org.uk/wp-content/uploads/2016/03/TSD15_ Patientlevel_simulation.pdf. Accessed 1 Sept 2016.
23. Payment by Result (2017).2016/17 National Tariff Payment System. Retrieved June 20, 2017, fromhttps://www.gov.uk/government/ publications/nhs-national-tariff-payment-system-201617