R E S E A R C H A R T I C L E
Open Access
Early winners and losers in dialysis
center pay-for-performance
Milda R. Saunders
1*, Haena Lee
2and Marshall H. Chin
1Abstract
Background:We examined the association of dialysis facility characteristics with payment reductions and change in clinical performance measures during the first year of the United States Centers for Medicare & Medicaid Services (CMS) End Stage Renal Disease Quality Incentive Plan (ESRD QIP) to determine its potential impact on quality and disparities in dialysis care.
Methods:We linked the 2012 ESRD QIP Facility Performance File to the 2007–2011 American Community Survey
by zip code and dichotomized the QIP total performance scores—derived from percent of patients with urea reduction rate > 65, hemoglobin < 10 g/dL, and hemoglobin > 12 g/dL—as‘any’versus‘no’payment reduction. We characterized associations between payment reduction and dialysis facility characteristics and neighborhood demographics, and examined changes in facility outcomes between 2007 and 2010.
Results: In multivariable analysis, facilities with any payment reduction were more likely to have longer operation (OR 1.03 per year), a medium or large number of stations (OR 1.31 and OR 1.42, respectively), and a larger proportion of African Americans (OR 1.25, highest versus lowest quartile), allp< 0.05. Most improvement in clinical performance was due to reduced overtreatment of anemia, a decline in the percentage of patients with hemoglobin≥12 g/dL; for-profits and facilities in African American neighborhoods had the greatest reduction.
Conclusions: In the first year of CMS pay-for-performance, most clinical improvement was due to reduced
overtreatment of anemia. Facilities in African American neighborhoods were more likely to receive a payment reduction, despite their large decline in anemia overtreatment.
Keywords: End stage renal disease, Quality improvement, Pay-for-performance, Racial disparities
Background
In 2012, the United States Centers for Medicare and Medicaid Services (CMS) reported outcomes for its End-Stage Renal Disease Quality Incentive Program (ESRD QIP), a pay-for-performance (P4P) program for dialysis facilities. The ESRD QIP is instructive as a case-study of the ability of financial incentives to improve quality and impact disparities, and the challenges of cre-ating policy in changing clinical and policy contexts.
The ESRD QIP builds on prior efforts to improve the quality and value of ESRD care. In 2001, CMS began publicly reporting dialysis performance measures on Dialysis Facility Compare, a public report card of facility performance. In 2008, US Congress passed the Medicare
Improvements for Patients and Provider Act of 2008 (MIPPA) which established the ESRD QIP, a value-based purchasing or P4P program for Medicare that began in 2012 [1]. MIPPA also bundled payments to dialysis facil-ities starting in 2011 to reduce incentives to provide expensive erythropoietin stimulating agents (ESAs) due to high ESA costs and evidence of potential harms of ESAs at high doses [2–5].
The ESRD QIP reduces Medicare ESRD payments to dialysis facilities whose total performance scores do not meet or exceed national standards. Facilities with a total performance score less than 26 (out of a possible 30) have their Medicare payments for dialysis services re-duced on a sliding scale, ranging from 0.5% to a max-imum of 2%. Total performance scores and payments for 2012 are based on the dialysis facilities’ outcomes from 2010 for dialysis adequacy (percentage of patients * Correspondence:msaunder@medicine.bsd.uchicago.edu
1University of Chicago Medicine, 5841 S. Maryland, MC 2007, Chicago, IL
60637, USA
Full list of author information is available at the end of the article
with urea reduction ratio≥65) and inadequate anemia management (both undertreatment, the percentage of patients on ESAs with hemoglobin (Hgb) < 10 g/dL, and overtreatment, the percentage of patients with Hgb > 12 g/dL).
Supporters of value-based purchasing or P4P pro-grams contend that by measuring and reporting out-comes and linking them to reimbursement, dialysis facilities will have the data and motivation to improve their quality of care. Achieving targeted hemoglobin and dialysis adequacy is associated with decreased morbidity, mortality, and improved quality of life [6–10]. Similarly, randomized trials have shown that overtreatment of anemia (Hgb greater than 12 g/dL) in patients with chronic kidney disease is associated with increased mortality, partly due to increased erythropoietin [3]. In addition, because these outcomes are publicly re-ported online as part of Dialysis Facility Compare [11], consumers could make informed choices about dialysis facilities.
Critics counter that P4P might be ineffective in im-proving quality of care or, worse, have unintended nega-tive consequences. P4P could be ineffecnega-tive if the money at risk is not sufficient to encourage dialysis facilities to improve quality [12]. P4P could also exacerbate dispar-ities in dialysis quality [13]. Dialysis facildispar-ities in neigh-borhoods with a higher proportion of African American residents have performed less favorably on quality indi-cators for anemia management and dialysis adequacy [14, 15]. P4P could worsen disparities if dialysis facilities “cherry-pick” healthier patients, leaving patients with more medical or social disadvantage in low-performing centers. P4P could also worsen racial or socioeconomic disparities if poorly performing dialysis facilities are chosen less by well-informed, well-insured patients, re-ceive less reimbursement, and improve less than their already high performing counterparts.
Thus we examined if quality improved and disparities changed under QIP. First we explored what dialysis facil-ity and neighborhood characteristics are associated with total performance scores that led to payment reductions under QIP. Then we investigated changes in QIP’s three clinical performance measures between 2007 and 2010.
Methods
Data
The Centers for Medicare and Medicaid Services (CMS) 2012 ESRD QIP Facility Performance contains informa-tion on all CMS certified dialysis facilities about anemia management and dialysis adequacy for 2010, metrics used for P4P in fiscal year 2012.To obtain demographic information for the neighborhood where the facility is located, as well as for state and region, we linked the CMS ESRD QIP file to the 2007–2011 American
Community Survey (ACS) five-year summary file facility census tract by geocoding facility street address. We ex-cluded facilities that did not have complete QIP score information (n= 483, 8.7%). For the addresses for which a street address could not be geocoded (n= 70, 1.3%), we used the census tract based on the zipcode XY centroid [16]. This study was deemed exempt by the IRB.
Outcomes and co-Variates
Outcome variables
In the ESRD QIP, facilities were given a 1–10 rating for each of three criteria: the proportion of patients with Hgb less than 10 g/dL, the proportion of patients with Hgb greater than 12 g/dL (for the hemoglobin values, a lower proportion gives a better score), and the propor-tion of patients receiving adequate dialysis (urea reduc-tion rate [URR] > 65%). Per QIP, the scores were summed so each facility received a score between 1 and 30 which was translated to a five-category measure of payment reduction for fiscal year 2012: (1) 0%, score 26–30; (2) 0.5%, score 21–25; (3) 1%, score 16–20; (4) 1.5%, score 11–15; and (5) 2%, score 10 or less.
We based our outcome measures on the ESRD QIP. We reverse coded adequate dialysis to measure inad-equate dialysis, URR < 65, so that the change between 2007 and 2010 would move in a consistent direction. We collapsed 2% payment reduction into a category of 1.5% or more since there were few observations (n= 32). To determine which dialysis facility characteristics were associated with good and poor quality measures, we transformed categorical variables to two dichotomous outcome variables. Our first measure was ‘any payment reduction’versus‘no payment reduction,’where any pay-ment reduction represented the paypay-ment reduction per-centage of 0.5% or more (coded as 1) and no payment reduction indicated 0% payment reduction (coded as 0). Our second dichotomous outcome was ‘most payment reduction’ versus ‘other payment reduction,’ where most payment reduction was defined as payment re-duction percentage of 1.5% or greater (coded as 1) and other payment reduction was defined as 1% or smaller (coded as 0).
An additional outcome was change over time of the clinical outcome. To assess direct effects of QIP on quality improvement, we compared 2007 and 2010 performance for each dialysis facility on each of the three QIP outcomes.
Co-variates
for ESRD care. Dialysis facility characteristics included profit status (i.e., for-profit versus non-profit), chain type (i.e., non-chain (independent), Chain 1, Chain 2, versus all other chains), facility size (i.e., the total number of dialysis stations at the dialysis facility by tertile), and years of operation (i.e., years since CMS certification). Chain membership is an organizational structure where a single firm owns a number of dialysis facilities, defined by USRDS as 20 or more freestanding facilities. Measures of dialysis facility neighborhood context were based on census tract. Census tract is the most com-monly accepted proxy for neighborhood within social science and health services research [17]. Dialysis facility neighborhood-level characteristics included percentage of African American and percentage of population below Federal Poverty Level to represent neighborhood socio-economic context [14, 15]. These variables were right-skewed; therefore, we divided them into quartiles to create categorical variables. All categorical variables (number of stations by tertile, percent African American by quartile, and percent poverty by quartile) were ana-lyzed as indicator variables.
Statistical analysis
Data were summed using descriptive statistics. We used a generalized linear mixed effects model to examine as-sociations between each outcome and dialysis facility characteristics (facility type, length of operation, total number of stations) and facility neighborhood demo-graphics (percent African American and percent of population below Federal Poverty Level by quartile). Each covariate of interest was evaluated separately in bivariable analyses; then they were examined simultan-eously in multivariate analyses. We used logistic regres-sion for binary outcomes (any payment reduction and no payment reduction); we used linear regression for paired data for change in clinical outcomes over time. All models included a random effect for ESRD network to account for clustering. We considered an interaction term between neighborhood demographics (proportion African American and proportion below poverty) for any payment reduction and large payment reduction because prior work showed different outcomes in African American and non-African American poor neighbor-hoods [15, 18]. All analyses were conducted using Stata, version 12.0 (Stata Corp, College Station, TX).
Results
Baseline characteristics
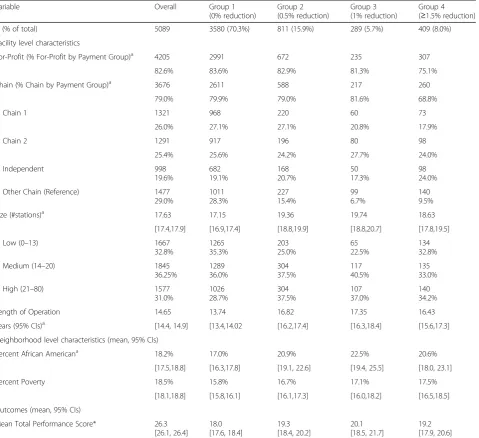
Of 5089 CMS certified dialysis facilities, the majority were for-profit (82.6%) and part of a chain (79.0%), Table 1. The average dialysis facility had 18 stations and had been operating for 15 years, although there was wide variation. On average, facilities were located in
neighborhoods that were 18.2% African American, though this distribution was right skewed; mean pro-portion African American was less than 1% in Quartile 1 and 54% in Quartile 4. The facilities had a mean QIP score of 26.3, and 70.4% of facilities had 0% payment reduction.
Bi-variable and multi-variable association between any payment reduction and facility and neighborhood covariates
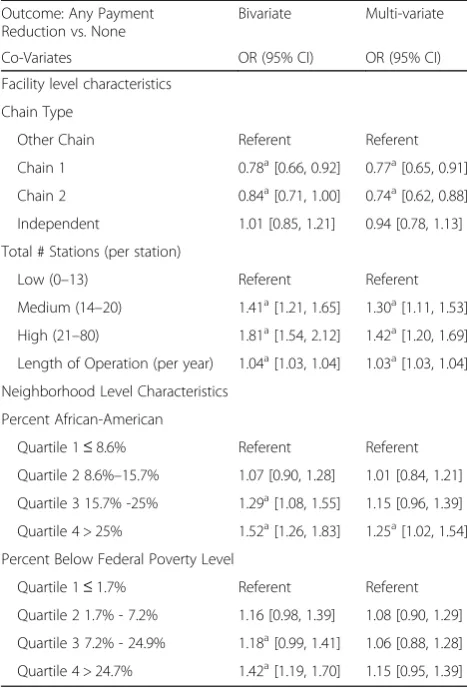
In bivariable analysis compared to other chains (Table 2), two large chains were less likely to have any payment re-duction (Chain 1, OR 0.78, 95% CI [0.66, 0.92]; Chain 2, OR 0.84, 95% CI [0.71, 1.0]). Conversely, dialysis facil-ities with any payment reduction were more likely to have had longer length of operation (OR 1.04 per year, 95% CI [1.03, 1.04]) and a medium or large number of stations (OR 1.41, 95% CI [1.21, 1.64] and OR 1.81, 95% CI [1.54, 2.12], compared to small). Similarly, facilities in neighborhoods with greatest proportion of poverty (OR 1.42, 95% CI [1.19, 1.70], highest quartile versus lowest quartile) and greatest proportion of African Americans (OR 1.52, 95% CI [1.26, 1.83], highest quartile versus lowest quartile) were also more likely to be in the pay-ment reduction group.
In multivariable analysis (Table 2), dialysis facilities with any payment reductions were more likely to have longer operation (OR 1.03 per year, 95% CI [1.03, 1.04]) and a medium or large number of stations (OR 1.31, 95% CI [1.11, 1.52] and OR 1.42, 95% CI [1.20, 1.69], compared to small). Similarly, facilities in neighborhoods with greater proportion of African Americans (highest versus lowest quartile, OR 1.25, 95% CI [1.02, 1.54]) were still more likely to be in the payment reduction group, even after controlling for percent poverty. The two large national chains, Chain 1 and Chain 2, were significantly less likely to have a payment reduction compared to other chains (OR 0.77, 95% CI [0.65–0.91] and OR 0.74, 95% CI [0.62, 0.88], respectively).
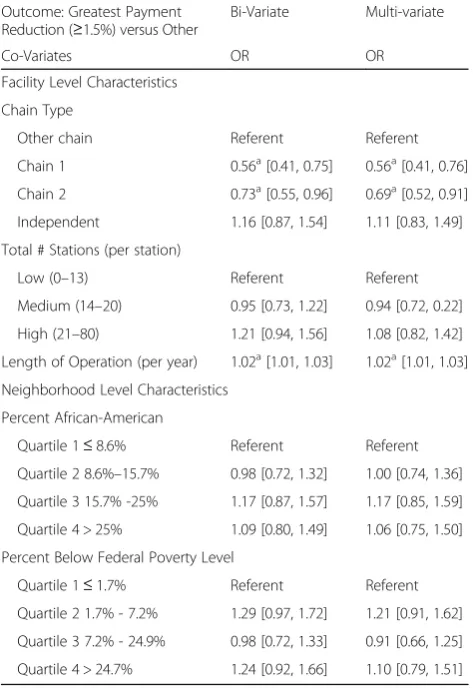
Bi-variable and multi-variable association between greatest payment reduction and facility and neighborhood
Appendix Table 5 shows factors associated with being in the greatest payment reduction group ≥1.5%, the worst category. In bivariable analysis, facilities with longer length of operation (OR 1.02 per year, 95% CI [1.01, 1.03]) were more likely to be in the worst (≥1.5%) pay-ment reduction group. Conversely, two national chains (Chain 1 OR 0.56, 95% CI [0.41, 0.75] and Chain 2, OR 0.73, 95% CI [0.55, 0.96]) had lower odds of being in the greatest payment reduction group.
1 and Chain 2 (OR 0.56, 95% CI [0.41, 0.76] and OR 0.69, 95% CI [0.52, 0.91], respectively) had lower odds of being in the greatest payment reduction group compared to other chains. There was no significant interaction be-tween neighborhood demographics (proportion African American and proportion below poverty) and between these variables and ESRD network (analysis not shown).
Change in clinical outcomes between 2007 and 2010 and facility and neighborhood covariates
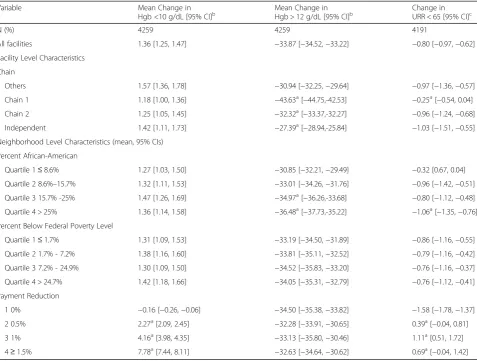
Table 3 shows mean change in clinical outcomes be-tween 2007 and 2010 by facility and neighborhood. Across most categories, there was a small increase in percent of patients with Hgb below 10 g/dL, which
[image:4.595.62.542.99.537.2]indicates anemia undertreatment. There was a signifi-cant difference between change in Hgb < 10 between the no payment reduction group which showed a small re-duction in proportion with Hgb < 10 and any payment reduction groups that show a successive increase in pro-portion with Hgb < 10. In addition, most facilities saw a small decrease in percent of patients with inadequate dialysis. The largest change in clinical outcomes from 2007 to 2010 is reduced anemia overtreatment shown by a decrease in proportion of patients with Hgb greater than 12 g/dL. Two large national chains had larger mean change compared to other chains or non-chains (inde-pendent) (−43.6 and −32.3 versus −30.9 and −27.4, re-spectively,p< 0.05).
Table 1Baseline characteristics of hemodialysis facilities overall and by pay-for-performance payment group
Variable Overall Group 1
(0% reduction)
Group 2 (0.5% reduction)
Group 3 (1% reduction)
Group 4 (≥1.5% reduction)
N (% of total) 5089 3580 (70.3%) 811 (15.9%) 289 (5.7%) 409 (8.0%)
Facility level characteristics
For-Profit (% For-Profit by Payment Group)a 4205 2991 672 235 307
82.6% 83.6% 82.9% 81.3% 75.1%
Chain (% Chain by Payment Group)a 3676 2611 588 217 260
79.0% 79.9% 79.0% 81.6% 68.8%
Chain 1 1321 968 220 60 73
26.0% 27.1% 27.1% 20.8% 17.9%
Chain 2 1291 917 196 80 98
25.4% 25.6% 24.2% 27.7% 24.0%
Independent 998
19.6%
682 19.1%
168 20.7%
50 17.3%
98 24.0%
Other Chain (Reference) 1477 29.0%
1011 28.3%
227 15.4%
99 6.7%
140 9.5%
Size (#stations)a 17.63 17.15 19.36 19.74 18.63
[17.4,17.9] [16.9,17.4] [18.8,19.9] [18.8,20.7] [17.8,19.5]
Low (0–13) 1667
32.8%
1265 35.3%
203 25.0%
65 22.5%
134 32.8%
Medium (14–20) 1845
36.25%
1289 36.0%
304 37.5%
117 40.5%
135 33.0%
High (21–80) 1577
31.0%
1026 28.7%
304 37.5%
107 37.0%
140 34.2%
Length of Operation 14.65 13.74 16.82 17.35 16.43
years (95% CIs)a [14.4, 14.9] [13.4,14.02 [16.2,17.4] [16.3,18.4] [15.6,17.3]
Neighborhood level characteristics (mean, 95% CIs)
Percent African Americana
18.2% 17.0% 20.9% 22.5% 20.6%
[17.5,18.8] [16.3,17.8] [19.1, 22.6] [19.4, 25.5] [18.0, 23.1]
Percent Poverty 18.5% 15.8% 16.7% 17.1% 17.5%
[18.1,18.8] [15.8,16.1] [16.1,17.3] [16.0,18.2] [16.5,18.5]
Outcomes (mean, 95% CIs)
Mean Total Performance Score* 26.3 [26.1, 26.4]
18.0 [17.6, 18.4]
19.3 [18.4, 20.2]
20.1 [18.5, 21.7]
19.2 [17.9, 20.6]
ap
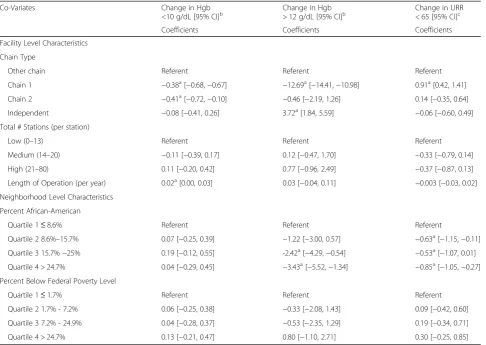
Table 4 shows multivariable results of facility and neighborhood characteristics associated with clinical outcomes over time. After adjusting for other factors, chain type (i.e., Chain 1) was associated with clinical im-provement across all categories. Similarly, neighbor-hoods with greatest proportion of African Americans had significant improvement in two categories, decrease in percent of patients with Hgb > 12 g/dL and decreased percentage of patients with urea reduction rate less than 65. An analysis (not shown) examining random effects within our two-level model demonstrated larger vari-ation our outcomes between facilities than between net-work. For example, for urea reduction rate less than 65 the network variance is 0.17 while the residual (facility) variance is 33.4. For Hgb > 12 g/dL, network variance is 0.03 and facility variance is 7.2; for Hgb < 10 g/dL net-work variance is 18.4 and facility variance is 408.1. The residual variance for facility was larger than for network across all three outcomes.
Discussion
The first year of P4P for dialysis facilities has been a qualified success in the US. Several positive results are suggested by our data. The majority of dialysis facilities met CMS quality benchmarks related to dialysis ad-equacy and hemoglobin management and did not re-ceive a payment reduction in 2012. However, total performance standards set for the 2012 payment year were modest at best. The measurement standards are based either on 2008 national benchmarks for each out-come or the actual 2007 results for each provider, whichever is lower. Thus, lower performing facilities were able to use their 2007 results for the baseline rather than being held to national performance standards.
Other clinical and regulatory forces were also at work. Announcements in 2008 about ESRD QIP and bundled payment, which reduced incentives to provide expensive erythropoietin stimulating agents (ESAs), occurred at the same time as evidence mounted of potential harms of ESAs at high doses [2, 3, 5]. High doses of ESAs to reach high hemoglobin levels were associated with greater risk for stroke, thromboembolic events, cardio-vascular events, all-cause mortality and potentially cancer [2, 3, 5]. In 2007, the US Federal Drug Adminis-tration (FDA) issued a black-box warning for ESAs which called for using the lowest possible dose. As a re-sult, many professional bodies changed their guidelines for ESA dosing for ESRD-related anemia [19–21]. Additionally, since 2001 CMS had been requiring dialy-sis facilities to monitor and report their outcomes. It is unclear whether the process of monitoring and report-ing, or anticipating the potential financial penalties for QIP or bundled payment, led to improvement. Regard-less of that uncertainty, a larger proportion of patients in dialysis facilities received guideline recommended care, which will likely lead to better clinical outcomes.
[image:5.595.56.290.110.456.2]For-profit facilities were less likely to have received any payment reduction and were less likely to be in the largest payment reduction group. Those successes were largely due to two large national chains that represent more than half of US dialysis facilities. These large chains may have been better able to develop and dissem-inate effective clinical monitoring systems and clinical protocols. Our work found that the largest improvement was reduction in anemia overtreatment, and this change was significantly larger for Chain 1, a large for-profit na-tional chain. Chain 1 also had small improvements in the two other categories (anemia undertreatment and dialysis adequacy). In prior work, for-profit facilities were associated with anemia overtreatment, higher than recommended hematocrit, and larger doses of erythropoietin-stimulating agents (ESAs), even after the FDA black box warning about ESAs’harms at high doses [22, 23]. Adherence to clinical guidelines for ESAs, Table 2Bi-Variate and multi-variate association between any
payment reduction and facility and neighborhood Co-Variates Outcome: Any Payment
Reduction vs. None
Bivariate Multi-variate
Co-Variates OR (95% CI) OR (95% CI)
Facility level characteristics
Chain Type
Other Chain Referent Referent
Chain 1 0.78a[0.66, 0.92] 0.77a[0.65, 0.91]
Chain 2 0.84a[0.71, 1.00] 0.74a[0.62, 0.88]
Independent 1.01 [0.85, 1.21] 0.94 [0.78, 1.13]
Total # Stations (per station)
Low (0–13) Referent Referent
Medium (14–20) 1.41a[1.21, 1.65] 1.30a[1.11, 1.53]
High (21–80) 1.81a[1.54, 2.12] 1.42a[1.20, 1.69]
Length of Operation (per year) 1.04a[1.03, 1.04] 1.03a[1.03, 1.04]
Neighborhood Level Characteristics
Percent African-American
Quartile 1≤8.6% Referent Referent
Quartile 2 8.6%–15.7% 1.07 [0.90, 1.28] 1.01 [0.84, 1.21]
Quartile 3 15.7% -25% 1.29a[1.08, 1.55] 1.15 [0.96, 1.39]
Quartile 4 > 25% 1.52a[1.26, 1.83] 1.25a[1.02, 1.54]
Percent Below Federal Poverty Level
Quartile 1≤1.7% Referent Referent
Quartile 2 1.7% - 7.2% 1.16 [0.98, 1.39] 1.08 [0.90, 1.29]
Quartile 3 7.2% - 24.9% 1.18a[0.99, 1.41] 1.06 [0.88, 1.28]
Quartile 4 > 24.7% 1.42a[1.19, 1.70] 1.15 [0.95, 1.39]
a
anticipation of bundled payments to facilities which now include ESAs, and QIP may have all contributed to this decline in anemia overtreatment [3, 5, 24, 25]. However, this result demonstrates how aligning payments—both bundled payments and ESRD QIP—with desired clinical outcomes can motivate capable organizations to change their practices.
When evaluating whether ESRD QIP increases dispar-ities in quality, the evidence is also mixed. Facildispar-ities in predominately African American communities showed the greatest reduction in percent of patients overtreated for anemia and a more modest increase in percent of pa-tients with adequate dialysis. Despite these improve-ments, in absolute terms, facilities in predominately African American neighborhoods still had lower total performance scores. ESRD QIP rewards absolute per-formance rather than relative improvement. Thus, the likelihood of a facility receiving any payment reduction increased as proportion of African Americans in the neighborhood increased, even after controlling for
neighborhood poverty. Our work is consistent with the growing body of literature that recognizes neighborhood context (i.e., poverty or racial composition) as a con-tributor to disparities in quality of care for patients with ESRD [14, 18, 26]. The challenge of ESRD QIP, similar to other P4P programs, is how to incentivize quality improvement without widening quality or pay-ment disparities [27, 28].
[image:6.595.60.538.98.459.2]Efforts are underway to determine if and how to ac-count for social factors that may lead to poor health care outcomes (e.g. low education, racial minority status, resi-dence in disadvantaged neighborhood) in P4P programs without accepting lower quality for individuals in those groups [28]. Two distinct methods—risk adjustment and payment adjustment—attempt to measure and improve quality, while taking social factors into account to avoid unfairly penalizing particular providers or institutions. Risk adjustment determines what clinical and social fac-tors should be accounted for when reporting outcomes; that is the quality benchmarks may be differ but payment Table 3Mean change in clinical performance 2007–2010 by facility and neighborhood, and performance-level characteristics
Variable Mean Change in
Hgb <10 g/dL [95% CI]b Mean Change inHgb > 12 g/dL [95% CI]b Change inURR < 65 [95% CI]c
N (%) 4259 4259 4191
All facilities 1.36 [1.25, 1.47] −33.87 [−34.52,−33.22] −0.80 [−0.97,−0.62]
Facility Level Characteristics
Chain
Others 1.57 [1.36, 1.78] −30.94 [−32.25,−29.64] −0.97 [−1.36,−0.57]
Chain 1 1.18 [1.00, 1.36] −43.63a[−44.75,-42.53] −0.25a[−0.54, 0.04]
Chain 2 1.25 [1.05, 1.45] −32.32a[−33.37,-32.27] −0.96 [−1.24,−0.68]
Independent 1.42 [1.11, 1.73] −27.39a[−28.94,-25.84] −1.03 [−1.51,−0.55]
Neighborhood Level Characteristics (mean, 95% CIs)
Percent African-American
Quartile 1≤8.6% 1.27 [1.03, 1.50] −30.85 [−32.21,−29.49] −0.32 [0.67, 0.04]
Quartile 2 8.6%–15.7% 1.32 [1.11, 1.53] −33.01 [−34.26,−31.76] −0.96 [−1.42,−0.51]
Quartile 3 15.7% -25% 1.47 [1.26, 1.69] −34.97a[−36.26,-33.68] −0.80 [−1.12,−0.48]
Quartile 4 > 25% 1.36 [1.14, 1.58] −36.48a[−37.73,-35.22] −1.06a[−1.35,−0.76]
Percent Below Federal Poverty Level
Quartile 1≤1.7% 1.31 [1.09, 1.53] −33.19 [−34.50,−31.89] −0.86 [−1.16,−0.55]
Quartile 2 1.7% - 7.2% 1.38 [1.16, 1.60] −33.81 [−35.11,−32.52] −0.79 [−1.16,−0.42]
Quartile 3 7.2% - 24.9% 1.30 [1.09, 1.50] −34.52 [−35.83,−33.20] −0.76 [−1.16,−0.37]
Quartile 4 > 24.7% 1.42 [1.18, 1.66] −34.05 [−35.31,−32.79] −0.76 [−1.12,−0.41]
Payment Reduction
1 0% −0.16 [−0.26,−0.06] −34.50 [−35.38,−33.82] −1.58 [−1.78,−1.37]
2 0.5% 2.27a[2.09, 2.45] −32.28 [−33.91,−30.65] 0.39a[−0.04, 0.81]
3 1% 4.16a[3.98, 4.35] −33.13 [−35.80,−30.46] 1.11a[0.51, 1.72]
4≥1.5% 7.78a[7.44, 8.11] −32.63 [−34.64,−30.62] 0.69a[−0.04, 1.42]
a
Significant Difference,p< 0.05 based on ANOVA.b
for reaching one’s designated benchmark is the same. Payment adjustment sets the same quality benchmark for every institution, but adjusts payment based on account-ing for clinical or social factors. The payments can be based risk adjusted, increased after accounting for social factors, or can directly fund programs to improve the quality of care for disadvantaged patients.
Our analyses have limitations. First, our study was ob-servational. While our work shows that facility and neighborhood variation exists in quality of care, the eti-ology of this variation is still unclear. Further work is needed to examine how staff attitudes and practices, pa-tient characteristics, and facility-level processes vary by high- and low-performers as well as by facility type, neighborhood, and region. In addition, our measures of dialysis facility neighborhood context were limited to census tracts. Dialysis facilities may be affected by pa-tients and employees from a larger catchment area, and our outcomes may be more dependent on larger com-munity infrastructure and resources [29]. In addition,
patients in dialysis facilities may have greater disad-vantage than the surrounding area as measured by percent African American and poverty [14]. Finally, we accounted for the effect of ESRD network overall, but we did not examine payment reductions by spe-cific ESRD networks, states, or counties. While vari-ation within these smaller areas may exist, we found that a greater proportion of variation in facility out-comes was explained by facility-level characteristics rather than region.
Conclusions
[image:7.595.57.544.98.443.2]Pay-for-performance has arrived for dialysis facilities in the US. Centers are likely reassured that this policy-change is not draconian; the majority of centers received no payment reduction. CMS policy makers are likely pleased at the improvement in anemia management. Most of the improvement appeared to be due to reduced anemia overtreatment without a large increase in anemia undertreatment. However, reports of the early successes Table 4Multivariable regression for change in clinical performance 2007–2010 by facility and neighborhood co-variates
Co-Variates Change in Hgb
<10 g/dL [95% CI]b Change in Hgb> 12 g/dL [95% CI]b Change in URR< 65 [95% CI]c
Coefficients Coefficients Coefficients
Facility Level Characteristics
Chain Type
Other chain Referent Referent Referent
Chain 1 −0.38a[−0.68,−0.67] −12.69a[−14.41,−10.98] 0.91a[0.42, 1.41]
Chain 2 −0.41a[−0.72,−0.10] −0.46 [−2.19, 1.26] 0.14 [−0.35, 0.64]
Independent −0.08 [−0.41, 0.26] 3.72a[1.84, 5.59] −0.06 [−0.60, 0.49]
Total # Stations (per station)
Low (0–13) Referent Referent Referent
Medium (14–20) −0.11 [−0.39, 0.17] 0.12 [−0.47, 1.70] −0.33 [−0.79, 0.14]
High (21–80) 0.11 [−0.20, 0.42] 0.77 [−0.96, 2.49] −0.37 [−0.87, 0.13]
Length of Operation (per year) 0.02a[0.00, 0.03] 0.03 [−0.04, 0.11] −0.003 [−0.03, 0.02]
Neighborhood Level Characteristics
Percent African-American
Quartile 1≤8.6% Referent Referent Referent
Quartile 2 8.6%–15.7% 0.07 [−0.25, 0.39] −1.22 [−3.00, 0.57] −0.63a[−1.15,−0.11]
Quartile 3 15.7%−25% 0.19 [−0.12, 0.55] -2.42a[−4.29,−0.54] −0.53a[−1.07, 0.01]
Quartile 4 > 24.7% 0.04 [−0.29, 0.45] −3.43a[−5.52,−1.34] −0.85a[−1.05,−0.27]
Percent Below Federal Poverty Level
Quartile 1≤1.7% Referent Referent Referent
Quartile 2 1.7% - 7.2% 0.06 [−0.25, 0.38] −0.33 [−2.08, 1.43] 0.09 [−0.42, 0.60]
Quartile 3 7.2% - 24.9% 0.04 [−0.28, 0.37] −0.53 [−2.35, 1.29] 0.19 [−0.34, 0.71]
Quartile 4 > 24.7% 0.13 [−0.21, 0.47] 0.80 [−1.10, 2.71] 0.30 [−0.25, 0.85] a
of ESRD QIP must be tempered with caution. The large improvement in anemia management occurred with the concomitant incentives of P4P, anticipation of bundled payment for ESAs, and mounting clinical evidence of the potential harms of ESAs. In addition, facilities in largely African American communities still fared worse in this new era of P4P, despite significant quality im-provement on dialysis adequacy and anemia overtreat-ment. In subsequent years, disparities may widen in the ESRD QIP as CMS increases the number of clinical out-comes measured and raises the thresholds that need to be met [30]. Outcomes must continue to be monitored to ensure that the program effectively improves quality of care for all patients with ESRD regardless of type of facility or neighborhood.
Appendix
Abbreviations
ACS:American community survey; CMS: Centers for medicare and medicaid services; ESA: Erythropoietin stimulating agent; ESRD: End stage renal disease; Hgb: Hemoglobin; MIPPA: Medicare improvements for patients and provider act of 2008; P4P: Pay-for-performance; QIP: Quality incentive plan
Acknowledgements
Support: The authors acknowledge support from the National Institutes of Health—K23 DK103111 (Saunders), P30 DK092949 (Chin), K24 DK071933 (Chin).
Availability of data and materials
The datasets supporting the conclusions of this article are available in the United States Centers for Medicare and Medicaid Services Dialysis Facility Compare Data Archive https://data.medicare.gov/data/archives/dialysis-facility-compare and the United States Census Bureau American Community Survey 2007–2011 Summary File https://www2.census.gov/acs2011_1yr/summaryfile/?
Authors’contributions
MS participated in the conception and design of the study, acquisition of the data, interpretation of the data and drafting of the work; HL participated in the acquisition and analysis of the data; MC participated in the interpretation of the data and revising it critically for important intellectual content. All authors read and approved the final manuscript.
Ethics approval and consent to participate This study was deemed exempt by the IRB.
Competing interests
Financial and Other Disclosure: Drs. Saunders and Chin and Lee have no conflicts of interest to disclose.
Publisher’s Note
Springer Nature remains neutral with regard to jurisdictional claims in published maps and institutional affiliations.
Author details
1
University of Chicago Medicine, 5841 S. Maryland, MC 2007, Chicago, IL 60637, USA.2Institute for Social Research, University of Michigan, 426
Thompson St., #3428, Ann Arbor, MI, USA.
Received: 17 September 2016 Accepted: 23 November 2017
References
1. CMS. 2010; https://www.cms.gov/Newsroom/MediaReleaseDatabase/Fact-sheets/2010-Fact-sheetsitems/2010-07-262.html. Accessed July 2010. 2. Singh AK. Does TREAT give the boot to ESAs in the treatment of CKD anemia?
J Am Soc Nephrol. 21(1):2–6.
3. Singh AK, Szczech L, Tang KL, et al. Correction of anemia with Epoetin Alfa in chronic kidney disease. N Engl J Med. 2006;355(20):2085–98.
4. Pfeffer MA, Burdmann EA, Chen C-Y, et al. A trial of Darbepoetin Alfa in type 2 diabetes and chronic kidney disease. N Engl J Med. 2009;361(21):2019–32. 5. Servilla KS, Singh AK, Hunt WC, et al. Anemia management and association
of race with mortality and hospitalization in a large not-for-profit dialysis organization. Am J Kidney Dis. 2009;54(3):498–510.
6. Lacson E Jr, Wang W, Hakim RM, Teng M, Lazarus JM. Associates of mortality and hospitalization in hemodialysis: potentially actionable laboratory variables and vascular access. Am J Kidney Dis. 2009;53(1):79–90.
7. Lacson E Jr, Wang W, Lazarus JM, Hakim RM. Hemodialysis facility-based quality-of-care indicators and facility-specific patient outcomes. Am J Kidney Dis. 2009;54(3):490–7.
8. Lacson E Jr, Xu J, Lin SF, Dean SG, Lazarus JM, Hakim R. Association between achievement of hemodialysis quality-of-care indicators and quality-of-life scores. Am J Kidney Dis. 2009;54(6):1098–107.
9. Wyck DV, Robertson J, Nissenson A, Provenzano R, Kogod D. Relationship among length of facility ownership, clinical performance, and mortality. Clin J Am Soc Nephrol. 2009;
[image:8.595.56.293.355.700.2]10. McClellan WM, Soucie JM, Flanders WD. Mortality in end-stage renal disease is associated with facility-to-facility differences in adequacy of hemodialysis. J Am Soc Nephrol. 1998;9(10):1940–7.
Table 5Bi-Variate and multi-variate association between greatest payment reduction and facility and neighborhood Co-Variates
Outcome: Greatest Payment Reduction (≥1.5%) versus Other
Bi-Variate Multi-variate
Co-Variates OR OR
Facility Level Characteristics
Chain Type
Other chain Referent Referent
Chain 1 0.56a[0.41, 0.75] 0.56a[0.41, 0.76]
Chain 2 0.73a[0.55, 0.96] 0.69a[0.52, 0.91]
Independent 1.16 [0.87, 1.54] 1.11 [0.83, 1.49]
Total # Stations (per station)
Low (0–13) Referent Referent
Medium (14–20) 0.95 [0.73, 1.22] 0.94 [0.72, 0.22]
High (21–80) 1.21 [0.94, 1.56] 1.08 [0.82, 1.42]
Length of Operation (per year) 1.02a
[1.01, 1.03] 1.02a[1.01, 1.03]
Neighborhood Level Characteristics
Percent African-American
Quartile 1≤8.6% Referent Referent
Quartile 2 8.6%–15.7% 0.98 [0.72, 1.32] 1.00 [0.74, 1.36]
Quartile 3 15.7% -25% 1.17 [0.87, 1.57] 1.17 [0.85, 1.59]
Quartile 4 > 25% 1.09 [0.80, 1.49] 1.06 [0.75, 1.50]
Percent Below Federal Poverty Level
Quartile 1≤1.7% Referent Referent
Quartile 2 1.7% - 7.2% 1.29 [0.97, 1.72] 1.21 [0.91, 1.62]
Quartile 3 7.2% - 24.9% 0.98 [0.72, 1.33] 0.91 [0.66, 1.25]
Quartile 4 > 24.7% 1.24 [0.92, 1.66] 1.10 [0.79, 1.51]
a
11. Dialysis Facility Compare Glossary. 2010; https://www.medicare.gov/ dialysisfacilitycompare/#resources/glossary. Accessed 2 Mar 2010. 12. Mullin E. ESRD QIP: Early Results Out, but Effect on Care Still Unclear. Nephrology
Times. Vol 5: Lippincott, Williams& Wilkins, Inc.; 2012:1, 21,22.
13. Weinick RM, Hasnain-Wynia R. Quality improvement efforts under health reform: how to ensure that they help reduce disparities—not increase them. Health Aff (Millwood). 2011;30(10):1837–43.
14. Rodriguez RA, Sen S, Mehta K, Moody-Ayers S, Bacchetti P, O'Hare AM. Geography matters: relationships among urban residential segregation, dialysis facilities, and patient outcomes. Ann Intern Med. 2007;146(7):493. 15. Saunders MR, Chin MH. Variation in dialysis quality measures by facility,
Neighborhood Region. Med Care. 2013;51(5):413–7.
16. MABLE/Geocorr[90|2k|12|14], Version <x.y>: Geographic Correspondence Engine. [Web Application]. http://mcdc.missouri.edu/websas/geocorr12.html. Accessed October 12, 2015, 2015.
17. Sperling J. The tyranny of census geography: small-area data and neighborhood statistics. City. 2012:219–23.
18. Saunders M, Cagney K, Ross L, Alexander G. Neighborhood poverty, racial composition and renal transplant waitlist. Am J Transplant. 2010;10(8):1912–7. 19. Levin A, Rocco M. KDCQI clinical practice guideline and clinical practice
recommendations for anemia in chronic kidney disease: 2007 update of hemoglobin target. Am J Kidney Dis. 2007;50(3):471-530.
20. II. National Kidney Foundation. Clinical practice guidelines and clinical practice recommendations for anemia in chronic kidney disease in adults. Am J Kidney Dis 2006;47(5 Suppl 3):S16-85.
21. Locatelli F, Covic A, Eckardt K-U, Wiecek A, Vanholder R, on behalf of the ERAEEAB. Anaemia management in patients with chronic kidney disease: a position statement by the Anaemia working Group of European Renal Best Practice (ERBP). Nephrol Dial Transplant. 2009;24(2):348–54.
22. Thamer M, Zhang Y, Kaufman J, Cotter D, Dong F, Hernan MA. Dialysis facility ownership and epoetin dosing in patients receiving hemodialysis. JAMA. 2007; 297(15):1667–74.
23. Ishida JH, McCulloch CE, Dudley R, Grimes BA, Johansen KL. Dialysis facility profit status and compliance with a black box warning. JAMA Intern Med. 173(12):1152–3.
24. Weiner DE. The 2011 ESRD prospective payment system: welcome to the bundle. Am J Kidney Dis. 2011;57(4):539–41.
25. Desai AA, Garber AM, Chertow GM. Rise of pay for performance: implications for care of people with chronic kidney disease. Clin J Am Soc Nephrol. 2007; 2(5):1087–95.
26. Patzer RE, Amaral S, Wasse H, Volkova N, Kleinbaum D, McClellan WM. Neighborhood poverty and racial disparities in kidney transplant waitlisting. J Am Soc Nephrol. 2009;20(6):1333–40.
27. Chin MH. Creating the business case for achieving health equity. J Gen Intern Med. 2016:1–5.
28. National Academies of Sciences, Engineering, and Medicine. Accounting for social risk factors in Medicare payment: identifying social risk factors. Washington, DC: The National Academies Press; 2016.
29. Blustein J, Borden WB, Valentine M. Hospital performance, the local economy, and the local workforce: findings from a US National Longitudinal Study. PLoS Med. 2010;7(6):807.
30. CMS. ESRD QIP Summary: PY 2012–2016. http://www.cms.gov/Medicare/ Quality-Initiatives-Patient-Assessment-Instruments/ESRDQIP/Downloads/ ESRD-QIP-Sumary-PY2012-16.pdf. Accessed April 10, 2015.
• We accept pre-submission inquiries
• Our selector tool helps you to find the most relevant journal • We provide round the clock customer support
• Convenient online submission • Thorough peer review
• Inclusion in PubMed and all major indexing services • Maximum visibility for your research
Submit your manuscript at www.biomedcentral.com/submit