S H O R T R E P O R T
Open Access
Selection of suitable reference genes for
quantitative real-time polymerase chain reaction
in human meningiomas and arachnoidea
Christina Pfister
*, Marcos S Tatabiga
†and Florian Roser
†Abstract
Findings:At first 32 housekeeping genes were analyzed in six randomly chosen meningiomas, brain and dura mater using geNorm, NormFinder, Bestkeeper-1 software and the comparativeΔCt method. Reference genes were ranked according to an integration tool for analyzing reference genes expression based on those four algorithms. Eight highest ranked reference genes (CASC3, EIF2B1, IPO8, MRPL19, PGK1, POP4, PPIA, and RPL37A) plus GAPDH and ACTB were then analyzed in 35 meningiomas, arachnoidea, dura mater and normal brain. NormFinder and Bestkeeper-1 identified RPL37A as the most stable expressed gene in meningiomas and their normal control tissue. NormFinder also determined the best combination of genes: RPL37A and EIF2B1. Commonly used reference genes GAPDH and ACTB were considered least stable genes. The critical influence of reference genes on qPCR data analysis is shown for VEGFA transcription patterns.
Background:In meningiomas quantitative real-time reverse transcription-polymerase chain reaction (qPCR) is most frequently used for accurate determination of gene expression using various reference genes. Although
meningiomas are a heterogeneous group of tissue, no data have been reported to validate reference genes for meningiomas and their control tissues.
Conclusions:RPL37A is the optimal single reference gene for normalization of gene expression in meningiomas and their control tissues, although the use of the combination of RPL37A and EIF2B1 would provide more stable results.
Background
Meningiomas are the most frequent intracranial tumours. They originate from the arachnoidal cap cells of the meningeal coverings of the spinal cord and brain, consti-tuting for approximatively 13 to 26% of all intracranial pathologies [1,2]. The conventional strategy for meningio-mas is surgery [3,4]. However, some meningiomeningio-mas recur as resection might be sub totally due to their delicate location at skull-based structures. The definition of malignant potential is beset by the frequent discordance between his-tology and biology [5,6]. Meningiomas are categorized in three WHO grades, in which there are several subtypes differentiated by their histological features.
Real-time quantitative reverse transcription polymerase chain reaction (RT-qPCR) is a sensitive and reliable method for quantifying gene expression. Most frequently the relative quantification method is used, which requires the use of an internal control gene for normalization. Reference genes are mostly genes, which are involved in basic metabolism and maintenance of the cell. An ideal reference gene should be expressed at a constant level in all examined tissues and cells, and should not be influ-enced by experimental conditions. However several studies have shown, that genes used as reference gene display sig-nificantly different gene expression levels [7-9].
Established housekeeping genes in meningioma RT-qPCR experiments are genes such as
glyceraldehyde-3-phosphate dehydrogenase (GAPDH) andb-Actin (ACTB)
[10-18] as well as ribosomal RNA (18S rRNA) and TATA binding box protein (TBP) [19-21]. As the application of these various housekeeping genes shows, there are no * Correspondence: [email protected]
†Contributed equally
Department of Neurosurgery, University of Tuebingen, Hoppe-Seyler-Str.3, 72076 Tuebingen, Germany
reports that candidate reference genes in meningiomas were validated. Due to the heterogeneity of meningioma tissue and the necessity to compare meningiomas and their control tissue reliably, the selection of an appropriate reference gene with stable gene expression throughout the various tissues is essential for further use of RT-qPCR in meningioma research.
In this study, we investigate the gene expression levels of 32 commonly used housekeeping genes in meningio-mas and their control tissues arachnoidea, dura and nor-mal brain. The RT-qPCR results were analyzed with four different algorithms, to select eight suitable refer-ence genes. Those genes plus GAPDH and ACTB were compared in an increased number of meningiomas and control tissues. These RT-qPCR results were further analyzed with two different algorithms: NormFinder and Bestkeeper-1.
Methods
Tumour Specimens and Cell Culture
Meningioma surgical specimens as well as arachnoidea and dura mater were obtained from the Neurosurgical Department in accordance to regulations of the Ethic Committee of the University of Tuebingen. Primary cul-tures were obtained from tumour tissue samples within 30 minutes of surgical removal. Samples were first washed in phosphate-buffered saline (PBS), reduced and mashed through a filter and placed in Dulbecco’s modified Eagle’s medium (DMEM) with fetal bovine serum (FBS), 2 mmol/ L L-glutamine and 0,1% 10 mg/ml Gentamicin (Invitro-gen, Grand Island, NY). Cells were plated in 25-mm2 tis-sue culture flasks and incubated at 37°C in a humidified
atmosphere of 5% CO2. Medium was changed every 3 to 4
days and cultures were split using 600μl Accutase (PAA, Pasching; Austria). Viable cells were stored in liquid nitro-gen in 90% medium/10% dimethyl sulfoxide.
RNA isolation and reverse transcription
Meningioma total ribonucleic acid (RNA) was isolated directly from primary cell cultures before splitting and RNA of Arachnoidea and dura was isolated from fresh tis-sue using PARIS®kit (Ambion, Inc., Austin, TX), accord-ing to the manufacturer’s protocol. RNA was treated with
DNA-free™(Ambion, Inc., Austin, TX) to remove
resi-dual genomic DNA. The concentration of the isolated RNA and the 260/280 absorbance ratio was measured in triplicates with Eppendorf Biophotometer (Eppendorf, Hamburg, Germany). The integrity of RNA samples was confirmed by electrophoresis on a 2% Sybr Green agarose gel (Invitrogen Inc., Carlsbad, CA). The criterion to include RNA samples was 260/280 ~ 2 (1.9 to 2.2) and 28S/18S ratio≥1.7. The probes were stored at - 80°C until
use. For normal brain FirstChoice®Human Brain
Refer-ence RNA (Ambion, Inc., Austin, TX) was used, which
pools RNA from different donors and several brain regions. RNA samples were DNase treated using DNAfree
kit (Ambion Inc., Austin, TX). Total RNA (1μg) was
reverse-transcribed to cDNA using des High Capacity RNA-to-cDNA Kits (Applied Biosystems, Foster City, CA) in a total volume of 20μl, according to the manufacturer’s protocol.
Primer selection
For investigation to identify the most stable reference gene that could be used for normalization in RT-qPCR
studies in meningiomas TaqMan® Express Plate Human
Endogenous Control Plates (Applied Biosystems, Foster City, CA) were used, which contained 32 different genes plated in triplicates (Table 1). This collection of genes has been selected from literature searches and/or whole genome microarray tests carried out on numerous human tissues. They have been shown to be expressed constitutively and at moderate abundance across most test samples. All primers further evaluated spanned an exon junction to minimize inaccuracies due to genomic DNA contamination in RNA samples except the primer for S18. Additional information on assay optimisation and validation such as primer sequence for each
Taq-Man® Assay are available from Applied Biosystems.
Priming conditions, primer concentration and annealing
temperature was identical in all used TaqMan® Gene
Expression Assays. TaqMan®-based detection was
cho-sen, because this detection method detects only specific
amplification products, whereas SYBR®-Green based
detection detects all amplified double-stranded DNA, including nonspecific double-stranded DNA sequences, which may generate false positive signals. Melt curves were not assessed because they are only suitable for SYBR®-Green based detection.
For further evaluation single TaqMan®Gene
Expres-sion Assays for ACTB, CASC3, EIF2B1, GAPDH, IPO8, MRPL19, PGK1, POP4, PPIA, RPL37A (Applied Biosys-tems, Foster City, CA) were used, which were identical
with the assays used in TaqMan®Express Plate Human
Endogenous Control Plates.
Real-time PCR
TaqMan®real-time PCR was run in triplicates in 48-well
reaction plates with a StepOne™(Applied Biosystems,
Foster City, CA). Real-time PCR reaction was performed with 1μl cDNA (5 ng/μl) in 20μl reaction mix
contain-ing 10 μl TaqMan® Gene Expression Master Mix
controls and“no template controls”(without cDNA in PCR) were included. Data were collected and
quantita-tively analyzed using StepOne™Software v2.1. Relative
quantitation analysis of gene expression data for VEGFA analysis was conducted according to the 2-ΔΔCtmethod [22].
For PCR efficiency a 5-fold dilution series was created from a random pool of cDNA from our sample group ran-ging from 50 ng to 0.08 ng. PCR were performed as described above in triplicate. The PCR efficiency and
correlation coefficients (R2) of each TaqMan® Gene
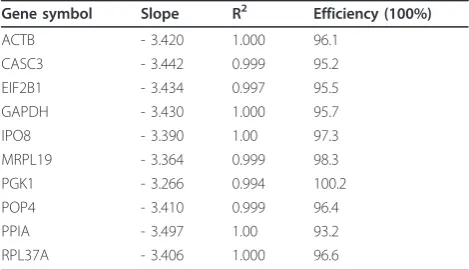
Expression Assay were generated using the slops of the standard curves. The efficiencies were calculated by the formula: efficiency (%) = (10(-1/slope)-1) * 100. All assays displayed efficiencies between 93.2% and 100.2% (Table 2).
Statistical analysis
[image:3.595.58.544.98.544.2]To compare the stability of candidate reference genes, four validation software programs were used according to their original publication: geNorm http://medgen. ugent.be/~jvdesomp/genorm[23], NormFinder http:// www.mdl.dk/publicationsnormfinder.htm[24],
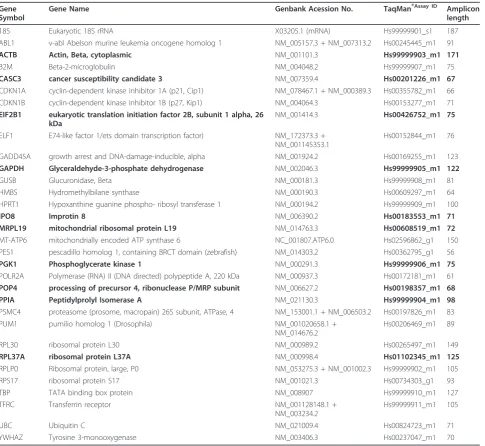
Table 1 Candidate reference genes evaluated in this study
Gene Symbol
Gene Name Genbank Acession No. TaqMan®Assay ID Amplicon
length
18S Eukaryotic 18S rRNA X03205.1 (mRNA) Hs99999901_s1 187
ABL1 v-abl Abelson murine leukemia oncogene homolog 1 NM_005157.3 + NM_007313.2 Hs00245445_m1 91
ACTB Actin, Beta, cytoplasmic NM_001101.3 Hs99999903_m1 171
B2M Beta-2-microglobulin NM_004048.2 Hs99999907_m1 75
CASC3 cancer susceptibility candidate 3 NM_007359.4 Hs00201226_m1 67
CDKN1A cyclin-dependent kinase inhibitor 1A (p21, Cip1) NM_078467.1 + NM_000389.3 Hs00355782_m1 66
CDKN1B cyclin-dependent kinase inhibitor 1B (p27, Kip1) NM_004064.3 Hs00153277_m1 71
EIF2B1 eukaryotic translation initiation factor 2B, subunit 1 alpha, 26
kDa
NM_001414.3 Hs00426752_m1 75
ELF1 E74-like factor 1/ets domain transcription factor) NM_172373.3 + NM_001145353.1
Hs00152844_m1 76
GADD45A growth arrest and DNA-damage-inducible, alpha NM_001924.2 Hs00169255_m1 123
GAPDH Glyceraldehyde-3-phosphate dehydrogenase NM_002046.3 Hs99999905_m1 122
GUSB Glucuronidase, Beta NM_000181.3 Hs99999908_m1 81
HMBS Hydromethylbilane synthase NM_000190.3 Hs00609297_m1 64
HPRT1 Hypoxanthine guanine phospho- ribosyl transferase 1 NM_000194.2 Hs99999909_m1 100
IPO8 Improtin 8 NM_006390.2 Hs00183553_m1 71
MRPL19 mitochondrial ribosomal protein L19 NM_014763.3 Hs00608519_m1 72
MT-ATP6 mitochondrially encoded ATP synthase 6 NC_001807.ATP6.0 Hs02596862_g1 150
PES1 pescadillo homolog 1, containing BRCT domain (zebrafish) NM_014303.2 Hs00362795_g1 56
PGK1 Phosphoglycerate kinase 1 NM_000291.3 Hs99999906_m1 75
POLR2A Polymerase (RNA) II (DNA directed) polypeptide A, 220 kDa NM_000937.3 Hs00172181_m1 61
POP4 processing of precursor 4, ribonuclease P/MRP subunit NM_006627.2 Hs00198357_m1 68
PPIA Peptidylprolyl Isomerase A NM_021130.3 Hs99999904_m1 98
PSMC4 proteasome (prosome, macropain) 26S subunit, ATPase, 4 NM_153001.1 + NM_006503.2 Hs00197826_m1 83
PUM1 pumilio homolog 1 (Drosophila) NM_001020658.1 +
NM_014676.2
Hs00206469_m1 89
RPL30 ribosomal protein L30 NM_000989.2 Hs00265497_m1 149
RPL37A ribosomal protein L37A NM_000998.4 Hs01102345_m1 125
RPLP0 Ribosomal protein, large, P0 NM_053275.3 + NM_001002.3 Hs99999902_m1 105
RPS17 ribosomal protein S17 NM_001021.3 Hs00734303_g1 93
TBP TATA binding box protein NM_008907 Hs99999910_m1 127
TFRC Transferrin receptor NM_001128148.1 +
NM_003234.2
Hs99999911_m1 105
UBC Ubiquitin C NM_021009.4 Hs00824723_m1 71
YWHAZ Tyrosine 3-monooxygenase NM_003406.3 Hs00237047_m1 70
BestKeeper-1 http://www.gene-quantification.de/best-keeper.html[25] and the comparative delta Ct method
[26]. For geNorm and NormFinder the raw Ctvalues
were transformed to quantities by using the delta Ct
method [27]. The highest relative quantities for each gene were set to 1. Bestkeeper-1 and the comparative
delta Ct method use raw Ct values. To evaluate the
results from the four algorithms an integration tool for analyzing reference genes expression was used http:// www.leonxie.com/referencegene.php. First according to the reference genes ranking by every algorithm from the most stable gene to the least stable gene, a series of con-tinuous integers starting from 1 as weight to each refer-ence gene is assigned. The geomean of each gene weights across the four algorithms is calculated and then these reference genes are re-ranked. The gene with the less geomean is viewed as more stable reference gene. Input data is value data from Real-Time qRT-PCR. Statistical analysis was performed with GraphPad Prism V5.03 (GraphPad Software, La Jolla, USA).
Nor-mality was assessed according to D’Agostino-Pearson
tests with alpha = 0.05. For evaluation of statistical equivalence a confidence-interval version of the Two One-Sided Tests (TOST) procedure of Schuirmann was used [28]. The groups are considered equivalent at a 5% significance level if their difference has a 90% confidence interval that lies entirely inside the upper and lower
equivalence limits. Therefore we considered ± δ= ± 1.5
to be reasonable limits of equivalence.
Results
Expression levels of 32 reference genes in meningioma and normal tissue
To select suitable reference genes TaqMan®human
endo-genous control plates (Applied Biosystems, Foster City, CA, USA) were used containing 32 known housekeeping genes (Table 1). Four different meningiomas, the malig-nant meningioma cell line IOMM-Lee, normal brain, cere-bral meninges and dura mater were analyzed regarding the gene expression levels of those housekeeping genes. The
mean Ctvalues displayed a wide range of expression levels between 10.41 and 33.78 as shown in Figure 1. The most
abundant transcript was S18 with median Ctvalue of
11.50 in meningiomas and a mean Ctvalue of 13.59 in
normal tissue. In meningioma the lowest expressed genes
were YHWAZ with median Ctvalue of 30.27 and TBP
with 30.08. In normal tissue HMBS had the lowest expres-sion with a median Ctvalue of 32.70. Tumour tissue and normal tissue group of five candidate reference genes (CASC3, CDKN1B, POLR2A, PUM1 and UBC) were sta-tistically equivalent to within ± 1.5.
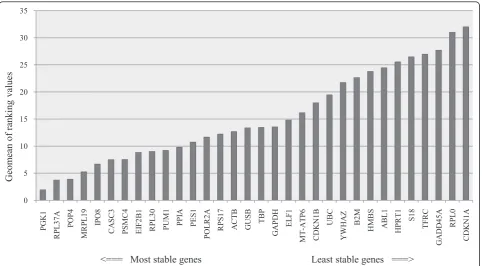
Expression stability of 32 candidate reference genes in meningioma and brain
All 32 housekeeping genes were analyzed using four dif-ferent algorithms, geNorm NormFinder, Bestkeeper-2 and the comparative delta Ct method. An integration tool calculated the geomean of each gene across the four algorithms and ranked the reference genes accord-ing to their comprehensive gene stability (Figure 2). The three most stable reference genes were PGK1 > RPL37A > POP4. The least stable reference genes were CDKN1A > RPL0 > GADD45A. Three of four used algorithms ranked PGK1 highest, only Bestkeeper-1 ranked CASC3 highest and PGK1 only in fourteenth place. For further analysis eight of the highest ranked expression genes were chosen: PGK1, RPL37A, POP4, MRPL19, IPO8 and CASC3. Additionally the most used reference genes in meningioma qPCR experiments ACTB and GAPDH were also chosen although being only ranked in fifteenth respectively eighteens place and being considered incon-sistent with a standard deviation (SD) higher than 1 by Bestkeeper-1. Three reference genes (CDKN1B, UBC and POLR2A) with equivalent tumour and normal tissue group were ranked low from position 19 to 22 respec-tively 13. CASC3 was the only one included for further investigation with statistically equal groups.
Expression stability of eight reference genes plus GAPDH and ACTB in meningiomas, arachnoidea, dura and normal brain
[image:4.595.56.291.100.235.2]To validate the expression stability of CASC3, EIF2B1, IPO8, MRPL19, PGK1, POP4, PPIA, RPL37A plus GAPDH and ACTB, thirty-four randomly chosen pri-mary cultured meningiomas, the meningioma cell line IOMM-Lee, two arachnoidea, six dura mater, one cer-ebral meninges and two pooled normal brain samples were screened for these reference genes. For analysis two different algorithms were chosen: NormFinder and Bestkeeper-1. NormFinder has a model-based approach whereas Bestkeeper-1 employs a pair-wise correlation analysis. NormFinder also estimates the variation between subgroups such as normal and can-cer tissue.
Table 2 Efficiency data for evaluated genes
Gene symbol Slope R2 Efficiency (100%)
ACTB - 3.420 1.000 96.1
CASC3 - 3.442 0.999 95.2
EIF2B1 - 3.434 0.997 95.5
GAPDH - 3.430 1.000 95.7
IPO8 - 3.390 1.00 97.3
MRPL19 - 3.364 0.999 98.3
PGK1 - 3.266 0.994 100.2
POP4 - 3.410 0.999 96.4
PPIA - 3.497 1.00 93.2
Both algorithms identified RPL37A as the most stable gene in meningiomas and normal control tissue with an average expression stability value (M) value of 0.54 (Best-keeper-1) respectively 0.12 (NormFinder). NormFinder not only determines the most stable gene, but also the best combination of two genes, which are RPL73A and EIF2B1 with a stability value of 0.088. The remaining ranking differed significantly for Bestkeeper-1 and Norm-Finder (Table 3). Bestkeeper-1 considered ACTB incon-sistent with SD = 1.00 in meningiomas and their control tissue, whereas PGK1 was inconsistent in meningiomas (SD = 1.04). Both algorithms determined EIF2B1 and RPL37A as the two most stable genes in normal tissue (Table 5). In contrast there were significant differences between the ranking of Bestkeeper-1 and NormFinder in meningiomas (Table 4). Bestkeeper-1 ranked CASC3 and RPL37A highest. NormFinder identified MRPL19 and POP4 as the two most suitable genes, ranking CASC3 and RPL37A in eighth respectively ninth position.
TOST procedure showed statistical equivalence
between normal tissue and meningiomas (± δ= ± 1.5)
for three reference genes: CASC3 (+0.87), IPO8 (+0.57)
and POP4 (+1.36). Those three genes were not normally distributed in meningiomas (CASC3 (P-value = 0.002), IPO8 (P-value < 0.0001) and POP4 (P-value = 0.0005). After inclusion of the normal tissue group IPO8 and POP4 remained not normally distributed.
Contribution of reference genes on expression levels of target genes
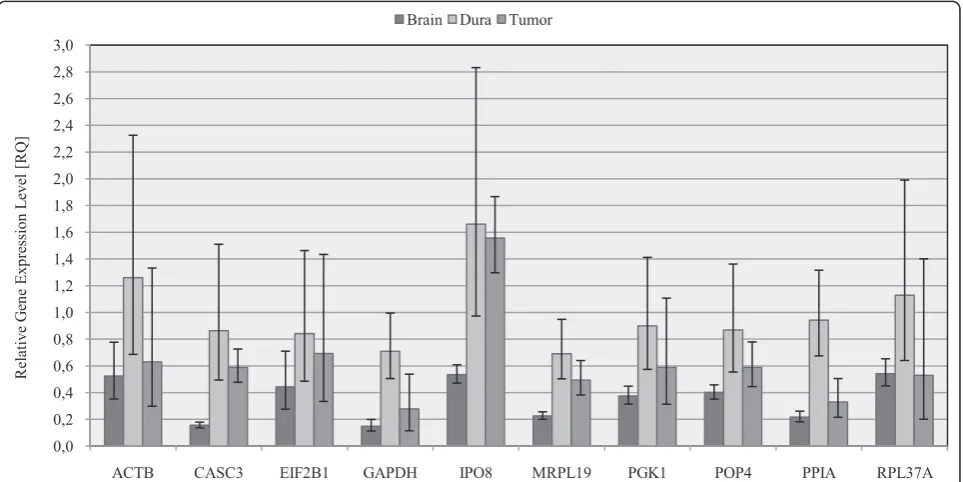
The selection of a reference gene for normalisation of qPCR can have a distinct influence on the expression profile of target genes [29]. To show the influence of dif-ferent reference genes on the determination of gene expression levels, VEGFA expression levels in meningio-mas and their control tissues were sequentially normal-ized with the analyzed ten reference genes. The Ctvalues for VEGFA were between 29 and 31. The expression level of VEGFA was normalized to each single reference gene as shown in Figure 3. The relative gene expression level (RQ) of VEGFA was calculated relative to the
ara-chnoidea group (RQArachnoidea= 1). Subsequent bars
[image:5.595.57.541.88.416.2]represented the different expression levels of VEGFA in normal brain, dura and meningiomas normalized by
Figure 1Expression levels of 32 candidate reference genes. Expression levels of 32 reference genes in four meningiomas, the malignant meningioma cell line IOMM-Lee, normal brain, cerebral meninges and dura mater. Real-Time PCR cycle threshold numbers are shown (Ctvalue).
different reference genes. Most reference genes main-tained the ratio between brain, dura and meningioma except IPO8 and CASC3. Normalization with IPO8 or CASC3 showed significantly increased ratio for brain to dura and brain to tumour.
Discussion
The requirement for distinct and reproducible results from quantitative gene expression analysis is accurate
data normalization [23,24,29,30]. The application of an inappropriate reference gene can lead to false experi-mental conclusions [31-33]. Therefore one or more reference need to be chosen dependent on used tissue and experimental conditions.
To our knowledge, this is the first systematic analysis of average expression stability of reference genes in meningiomas for data normalisation in qPCR experi-ments. To evaluate the average expression stability four analysis software programs (geNorm, NormFinder,
0 5 10 15 20 25 30 35 P GK1 RP L 37A POP4 MRP L 19 IP O 8 CA SC3 PSM C 4 EI F2 B1 RP L 30 PUM 1 PPI A PES1 POL R 2A R PS1 7 AC T B GU SB TB P GAP D H EL F1 MT -A T P6 CD K N 1B UB C YW HA Z B2M HM B S AB L 1 HPR T 1 S1 8 TF R C G A D D
45A RPL
0 CD K N 1A Geo m ean of rank in g valu es
[image:6.595.58.541.88.354.2]<=== Most stable genes Least stable genes ===>
[image:6.595.300.538.580.730.2]Figure 2Comprehensive gene stability of 32 candidate reference genes in meningiomas and control tissue. Geomean of ranking values (y-axis) of 32 reference genes with their ranking from least to most stable gene expression (x-axis). Lower geomean values indicate more stable gene expression.
Table 3 Ranking of ten candidate reference genes in meningiomas and their control tissue based on average expression stability value as calculated by Bestkeeper-1 and NormFinder
Rank Bestkeeper-1 NormFinder
Gene name Stability value Gene name Stability value
1 RPL37A 0.54 RPL37A 0.118
2 CASC3 0.54 EIF2B1 0.122
3 MRPL19 0.65 POP4 0.155
4 IPO8 0.66 MRPL19 0.163
5 POP4 0.70 PGK1 0.169
6 PPIA 0.73 PPIA 0.200
7 EIF2B1 0.74 GAPDH 0.286
8 PGK1 0.76 ACTB 0.287
9 GAPDH 0.83 CASC3 0.289
10 ACTB 1.00 IPO8 0.380
Table 4 Ranking of ten candidate reference genes in meningiomas based on average expression stability value as calculated by Bestkeeper-1 and NormFinder
Rank Bestkeeper-1 NormFinder
Gene name Stability value Gene name Stability value
1 CASC3 0.43 MRPL19 0.197
2 RPL37A 0.45 POP4 0.269
3 MRPL19 0.59 IPO8 0.277
4 IPO8 0.62 PPIA 0.312
5 PPIA 0.63 PGK1 0.332
6 POP4 0.63 EIF2B1 0.355
7 PGK1 0.67 GAPDH 0.386
8 EIF2B1 0.70 CASC3 0.388
9 GAPDH 0.75 RPL37A 0.447
[image:6.595.56.292.580.730.2]Bestkeeper-1 and the comparative delta Ct method) based on different algorithms were used. So far various reference genes (GAPDH, ACTB, S18, TBP) were used in qPCR experiments in meningiomas [11-21,34], although GAPDH was mainly used for normalizations. This study demonstrates that none of these reference genes were ranked under the ten most stable genes of 32 analyzed reference genes. However GAPDH and ACTB as the most used reference genes in meningioma qPCR experiments were further analyzed. After reducing the number of reference genes and increasing the num-ber of samples both reference genes were considered
one of the least stable genes. Bestkeeper-1 considered ACTB unsuitable as reference gene in meningiomas and their control tissues.
Because there is so few data available for gene expres-sion of reference genes in meningiomas a large number of reference genes were screened. Using four randomly chosen meningiomas, the malignant meningioma cell line IOMM-Lee, pooled normal brain, cerebral meninges and dura mater was sufficient to determine expression levels of all reference genes as shown in Table 1. Because the four algorithms use different approaches for their rankings of the 32 reference genes, the ranking dif-fered significantly making a selection of genes for further investigation difficult. Using the integration tool which weighs the ranking of each algorithm made the selection easier and more comprehensible. The six most stable reference genes according to the integration tool (PGK1, RPL37A, POP4, MRPL19, IPO8 and CASC3) were chosen for further analysis. Additionally PPIA and EIF2B1 were selected. PPIA was the highest ranked gene, which displayed high expression levels. EIF2B1 was the most stable gene with low expression levels. Because RPL30 is potentially co-regulated with RPL37A, it was not chosen, so the outcome of the result would not be affected.
[image:7.595.56.291.133.281.2]For a more detailed analysis the remaining ten refer-ence genes were analyzed using an increased number of samples (ntotal= 46 with nnormal= 11 and nmeningioma= 35) but a decreased number of software (NormFinder and Bestkeeper-1). NormFinder was chosen because of
Table 5 Ranking of ten candidate reference genes in normal control tissue based on average expression stability value as calculated by Bestkeeper-1 and NormFinder
Rank Bestkeeper-1 NormFinder
Gene name Stability value Gene name Stability value
1 EIF2B1 0.45 EIF2B1 0.306
2 RPL37A 0.56 RPL37A 0.318
3 PPIA 0.65 MRPL19 0.329
4 MRPL19 0.69 PPIA 0.404
5 ACTB 0.75 GAPDH 0.415
6 POP4 0.77 POP4 0.419
7 IPO8 0.82 CASC3 0.462
8 GAPDH 0.82 ACTB 0.542
9 CASC3 0.85 PGK1 0.590
10 PGK1 1.04 IPO8 0.621
0,0 0,2 0,4 0,6 0,8 1,0 1,2 1,4 1,6 1,8 2,0 2,2 2,4 2,6 2,8 3,0
ACTB CASC3 EIF2B1 GAPDH IPO8 MRPL19 PGK1 POP4 PPIA RPL37A
Re
la
tiv
e G
ene
E
xpr
es
si
on L
ev
el
[RQ
]
Brain Dura Tumor
[image:7.595.58.540.463.704.2]the model-based approach and the additional estimation of variation between normal and cancer tissue. In con-trast Bestkeeper-1 employs a pair-wise correlation
analy-sis and uses raw Ct values whereas NormFinder uses
transformed quantities. Also Bestkeeper-1 directly includes qPCR efficiency.
Both algorithms considered RPL37A as the most suita-ble reference gene for normalization in qPCR in meningio-mas and their control tissue. The following ranking differed significantly especially for CASC3, IPO8 and EIF2B1. Bestkeeper-1 considered CASC3 as the most stable genes in meningiomas, but ranked CASC3 only in ninth place for normal control tissue. This led to a second place in the combined ranking due to the higher number of tumour samples. In contrast NormFinder ranked EIF2B1 highest for normal control tissue and only in sixth place in meningiomas. Because NormFinder weighs the two subgroups, normal tissue versus meningiomas, the ranking of the control tissue has more influence on the combined ranking. This is also demonstrated with IPO8 and conversely with RPL37A. NormFinder ranks RPL37A in meningiomas only in ninth place and in normal control tissue in second place. But after including the variation between those subgroups NormFinder displays RPL37A as the most stable gene for both subgroups.
Considering the results of the normalization of VEGFA against every single reference genes with signifi-cantly altered results for CASC3 and IPO8, NormFinder displays a more accurate ranking for meningiomas and their control tissue.
Some researchers recommend the use of multiple refer-ence genes for calculating a normalization factor [23]. NormFinder also determines the best combination of two genes, when subgroups are included. For meningiomas and their normal control tissue the combination is RPL37A and EIF2B1.
Conclusions
In conclusion, the results from the current study demon-strate that RPL37A is the most appropriate single refer-ence gene for the normalization process of gene profiling studies in meningiomas and their normal control tissue arachnoidea, dura mater and normal brain. If a combina-tion of reference genes is applicable RPL37A and EIF2B1 are most suitable. Additionally results from the current study indicate that widely used GAPDH and ACTB are both inappropriate reference genes for meningiomas.
Acknowledgements
We are grateful to Anita Lal (UCSF, USA) for kindly providing the IOMM-Lee cell line.
Authors’contributions
CP carried out cell cultivation and the Real-Time PCR studies, performed the statistical analysis and drafted the manuscript. MS supervised the study and
reviewed the final version of the manuscript. FR conceived of the study, and participated in its design and coordination and helped to draft the manuscript. All authors read and approved the final manuscript.
Competing interests
The authors declare that they have no competing interests.
Received: 8 February 2011 Accepted: 2 August 2011 Published: 2 August 2011
References
1. Kleihues P, Burger PC, Scheithauer B:The new WHO classification of brain tumors.Brain Pathol1993,3:255-268.
2. Riemenschneider MJ, Perry A, Reifenberger G:Histological classification and molecular genetics of meningiomas.Lancet Neurol2006,
5(12):1045-1054.
3. McMullen KP, Stieber VW:Meningioma: current treatment options and future directions.CurrTreatOptionsOncol2004,5(6):499-509.
4. Whittle IR, Smith C, Navoo P, Collie D:Meningiomas.Lancet2004,
363(9420):1535-1543.
5. Mahmood A, Caccamo DV, Tomecek FJ, Malik GM:Atypical and malignant meningiomas: a clinicopathological review.Neurosurgery1993,
33(6):955-963.
6. Schittenhelm J, Mittelbronn M, Roser F, Tatagiba M, Mawrin C, Bornemann A:Patterns of SPARC expression and basement membrane intactness at the tumour-brain border of invasive meningiomas.
Neuropathol Appl Neurobiol2006,32(5):525-531.
7. Czechowski T, Stitt M, Altmann T, Udvardi MK, Scheible WR:Genome-wide identification and testing of superior reference genes for transcript normalization in Arabidopsis.Plant Physiol2005,139(1):5-17. 8. Schmittgen TD, Zakrajsek BA:Effect of experimental treatment on
housekeeping gene expression: validation by real-time, quantitative RT-PCR.J Biochem Biophys Methods2000,46(1-2):69-81.
9. Suzuki T, Higgins PJ, Crawford DR:Control selection for RNA quantitation.
Biotechniques2000,29(2):332-337.
10. Buccoliero AM, Castiglione F, Degl’Innocenti DR, Arganini L, Taddei A, Ammannati F, Mennonna P, Taddei GL:Cyclooxygenase-2 (COX-2) overexpression in meningiomas: real time PCR and
immunohistochemistry.Appl Immunohistochem Mol Morphol2007,
15(2):187-192.
11. Buccoliero AM, Castiglione F, Degl’Innocenti DR, Gheri CF, Garbini F, Taddei A, Ammannati F, Mennonna P, Taddei GL:NF2 gene expression in sporadic meningiomas: relation to grades or histotypes real time-pCR study.Neuropathology2007,27(1):36-42.
12. Huang H, Held-Feindt J, Buhl R, Mehdorn HM, Mentlein R:Expression of VEGF and its receptors in different brain tumors.Neurol Res2005,
27(4):371-377.
13. Miracco C, Cosci E, Oliveri G, Luzi P, Pacenti L, Monciatti I, Mannucci S, De Nisi MC, Toscano M, Malagnino V,et al:Protein and mRNA expression of autophagy gene Beclin 1 in human brain tumours.Int J Oncol2007,
30(2):429-436.
14. Paek SH, Kim DG, Park CK, Phi JH, Kim YY, Im SY, Kim JE, Park SH, Jung HW:
The role of matrix metalloproteinases and tissue inhibitors of matrix metalloproteinase in microcystic meningiomas.Oncol Rep2006,
16(1):49-56.
15. Puri S, Joshi BH, Sarkar C, Mahapatra AK, Hussain E, Sinha S:Expression and structure of interleukin 4 receptors in primary meningeal tumors.Cancer
2005,103(10):2132-2142.
16. Rollison DE, Utaipat U, Ryschkewitsch C, Hou J, Goldthwaite P, Daniel R, Helzlsouer KJ, Burger PC, Shah KV, Major EO:Investigation of human brain tumors for the presence of polyomavirus genome sequences by two independent laboratories.Int J Cancer2005,113(5):769-774.
17. Uesaka T, Shono T, Suzuki SO, Nakamizo A, Niiro H, Mizoguchi M, Iwaki T, Sasaki T:Expression of VEGF and its receptor genes in intracranial schwannomas.J Neurooncol2007,83(3):259-266.
18. Yang Y, Shao N, Luo G, Li L, Nilsson-Ehle P, Xu N:Relationship between PTEN gene expression and differentiation of human glioma.Scand J Clin Lab Invest2006,66(6):469-475.
20. Denizot Y, De Armas R, Durand K, Robert S, Moreau JJ, Caire F, Weinbreck N, Labrousse F:Analysis of several PLA2 mRNA in human meningiomas.Mediators Inflamm2009,2009:689430.
21. Laurendeau I, Ferrer M, Garrido D, D’Haene N, Ciavarelli P, Basso A, Vidaud M, Bieche I, Salmon I, Szijan I:Gene expression profiling of ErbB receptors and ligands in human meningiomas.Cancer Invest2009,
27(6):691-698.
22. Erickson HS, Albert PS, Gillespie JW, Wallis BS, Rodriguez-Canales J, Linehan WM, Gonzalez S, Velasco A, Chuaqui RF, Emmert-Buck MR:
Assessment of normalization strategies for quantitative RT-PCR using microdissected tissue samples.Lab Invest2007,87(9):951-962. 23. Vandesompele J, De Preter K, Pattyn F, Poppe B, Van Roy N, De Paepe A,
Speleman F:Accurate normalization of real-time quantitative RT-PCR data by geometric averaging of multiple internal control genes.Genome Biol2002,3(7):RESEARCH0034.
24. Andersen CL, Jensen JL, Orntoft TF:Normalization of real-time quantitative reverse transcription-PCR data: a model-based variance estimation approach to identify genes suited for normalization, applied to bladder and colon cancer data sets.Cancer Res2004,64(15):5245-5250. 25. Pfaffl MW, Tichopad A, Prgomet C, Neuvians TP:Determination of stable
housekeeping genes, differentially regulated target genes and sample integrity: BestKeeper–Excel-based tool using pair-wise correlations.
Biotechnol Lett2004,26(6):509-515.
26. Nicholas Silver SB, Jiang Jie, Thein Swee Lay:Selection of housekeeping genes for gene expression studies in human reticulocytes using real-time PCR.BMC Molecular Biology2006,7:33.
27. Livak KJ, Schmittgen TD:Analysis of relative gene expression data using real-time quantitative PCR and the 2(-Delta Delta C(T)) Method.Methods
2001,25(4):402-408.
28. Schuirmann DJ:A comparison of the two one-sided tests procedure and the power approach for assessing the equivalence of average bioavailability.J Pharmacokinet Biopharm1987,15(6):657-680.
29. Nolan T, Hands RE, Bustin SA:Quantification of mRNA using real-time RT-PCR.Nat Protoc2006,1(3):1559-1582.
30. Gutierrez L, Mauriat M, Pelloux J, Bellini C, Van Wuytswinkel O:Towards a systematic validation of references in real-time rt-PCR.Plant Cell2008,
20(7):1734-1735.
31. Bustin SA, Nolan T:Pitfalls of quantitative real-time reverse-transcription polymerase chain reaction.J Biomol Tech2004,15(3):155-166. 32. Dheda K, Huggett JF, Chang JS, Kim LU, Bustin SA, Johnson MA, Rook GA,
Zumla A:The implications of using an inappropriate reference gene for real-time reverse transcription PCR data normalization.Anal Biochem
2005,344(1):141-143.
33. Huggett J, Dheda K, Bustin S, Zumla A:Real-time RT-PCR normalisation; strategies and considerations.Genes Immun2005,6(4):279-284. 34. Laurendeau I, Ferrer M, Garrido D, D’Haene N, Ciavarelli P, Basso A,
Vidaud M, Bieche I, Salmon I, Szijan I:Gene expression profiling of the hedgehog signaling pathway in human meningiomas.Mol Med2010,
16(7-8):262-270.
doi:10.1186/1756-0500-4-275
Cite this article as:Pfisteret al.:Selection of suitable reference genes for quantitative real-time polymerase chain reaction in human
meningiomas and arachnoidea.BMC Research Notes20114:275.
Submit your next manuscript to BioMed Central and take full advantage of:
• Convenient online submission
• Thorough peer review
• No space constraints or color figure charges
• Immediate publication on acceptance
• Inclusion in PubMed, CAS, Scopus and Google Scholar
• Research which is freely available for redistribution