R E S E A R C H A R T I C L E
Open Access
Differences in the quality of oral
anticoagulation therapy with vitamin K
antagonists in German GP practices
–
results of the cluster-randomized PICANT
trial (Primary Care Management for
Optimized Antithrombotic Treatment)
Cornelia Mertens
1, Andrea Siebenhofer
1,2*, Andrea Berghold
3, Gudrun Pregartner
3, Lisa-Rebekka Ulrich
1,
Karola Mergenthal
1, Birgit Kemperdick
1, Sylvia Schulz-Rothe
1, Sandra Rauck
1, Sebastian Harder
4,
Ferdinand Michael Gerlach
1and Juliana Johanna Petersen
1Abstract
Background:In Germany, patients receiving oral anticoagulation (OAC) are often treated by general practitioners (GPs), and large proportions of patients receive vitamin K antagonists (VKAs). The quality of OAC in German GP practices, differences between various practices, and improvement potential through implementation of case management, have not yet been investigated satisfactorily.
Based on results of a cluster-randomized controlled trial, we aimed to assess whether OAC quality can be improved, any variations between practices exist and determine practice- and patient-level factors.
Methods:The PICANT trial (2012–2015) was performed in 52 GP practices in Hesse, Germany. Adult patients with long-term indication for OAC received best practice case management in the intervention group. International normalized ratio (INR) values were recorded from anticoagulation passes. The Rosendaal method was used to calculate Time in Therapeutic Range (TTR) at patient level, and mean pooling to obtain center-specific TTR (cTTR) at practice level. The quality of OAC was assessed by TTR and cTTR. Linear model analyses were used to investigate associations between practice−/ patient-level factors and TTR.
Results:Inclusion of 736 patients (49.6% intervention and 50.4% control patients); 690 (93.8%) received
phenprocoumon. Within 24 months, the TTR was 75.1% (SD 17.6) in the intervention versus 74.3% (SD 17.8) in the control group (p= 0.670). The cTTR averaged 75.1% (SD 6.5, range: 60.4 to 86.7%) in the intervention versus 74.3% (SD 7.2, range: 52.7 to 85.7%) in the control group (p= 0.668). At practice level, the TTR was significantly lower in practices with a male physician and certification in quality management. At patient level, the TTR was significantly higher in patients with moderate to high compliance, in men, and in patients that performed self-management. The TTR was significantly lower in patients with certain comorbidities, and who were hospitalized.
(Continued on next page)
© The Author(s). 2019Open AccessThis article is distributed under the terms of the Creative Commons Attribution 4.0 International License (http://creativecommons.org/licenses/by/4.0/), which permits unrestricted use, distribution, and reproduction in any medium, provided you give appropriate credit to the original author(s) and the source, provide a link to the Creative Commons license, and indicate if changes were made. The Creative Commons Public Domain Dedication waiver (http://creativecommons.org/publicdomain/zero/1.0/) applies to the data made available in this article, unless otherwise stated. * Correspondence:[email protected]
1
Institute of General Practice, Goethe University Frankfurt am Main, Theodor-Stern-Kai 7, 60590 Frankfurt/Main, Germany
2Institute of General Practice and Evidence-based Health Services Research,
(Continued from previous page)
Conclusions:The intervention did not effectively improve OAC quality compared to routine care. Quality of INR control was generally good, but considerable variation existed between GP practices. The variability indicates optimization potential in some practices. The demonstrated association between patient-level factors and TTR highlights the importance of considering patient characteristics that may impede achieving high quality therapeutic outcomes. Trial registration:ISRCTN registry,ISRCTN41847489, registered 27 February 2012.
Keywords:Oral anticoagulation, Vitamin K antagonists, General practice, Time in therapeutic range (TTR), Center-specific time in therapeutic range (cTTR)
Background
Oral anticoagulation (OAC) is indicated for a variety of conditions. Long-term antithrombotic treatment with OAC reduces the risk of thromboembolic events in pa-tients with atrial fibrillation (AF). AF is a common con-dition, with an estimated 10 million patients suffering from it in Europe in 2014 [1]. Demographic change is expected to lead to an increase in the number of affected persons to 14 to 17 million by 2030 [1]. OAC is also used in patients with mechanical heart valves, throm-bosis and pulmonary embolisms [2].
Since becoming available in 2011, prescriptions of dir-ect oral anticoagulants (DOACs) have increased sharply: In 2012, 38 million defined daily doses (DDDs) of DOACs were prescribed in Germany (vs. 389 mio. DDDs of VKAs), while in 2016, 333 mio. DDDs of DOACs were already prescribed (vs. 320 mio. DDDs of VKAs) [3]. DOACs have several advantages, such as more predictable dosing and fewer drug interactions [4]. They are an effective treatment choice for long-term anticoagulation therapy and are now unanimously rec-ommended in cardiology guidelines as a first-line ther-apy in non-valvular AF. However, some concerns remain [5]. For instance, DOACs have no readily available moni-toring marker [6]. Furthermore, DOACs are contraindi-cated for patients with mechanical heart valves [7] and severe renal dysfunction (defined as creatinine clearance < 15 mL/min) [8].
Vitamin K antagonists have been used and tested in antithrombotic therapy for more than 60 years [9] and lead to much lower treatment costs than DOACs [3]. Previous trials have shown that antithrombotic therapy with VKAs is highly effective in reducing the risk of thromboembolic complications [2, 10]. Nevertheless, a serious risk of adverse thromboembolic and bleeding events is associated with VKAs. This is particularly true when the internationally normalized ratio (INR) values are outside the target range [11]. To achieve beneficial effects while simultaneously minimizing the risk of ad-verse events, attending physicians should monitor and adjust the dose of patients taking VKAs. Thus, monitor-ing and the timely adjustment of the treatment regimen is particularly important for these patients. The quality
of oral anticoagulation can be determined by the Time in Therapeutic Range (TTR), which is the proportion of time that measured INR values were within the target range. Previous studies have demonstrated that the effi-cacy of treatment with VKAs is directly related to the TTR, and that an optimal TTR (> 75%) is associated with a lower risk of adverse events [12, 13]. Patient-level factors such as cognitive impairment, poor adherence or individual drug and diet interactions may affect the qual-ity of the therapy [14–16]. In addition, practice-level characteristics may influence the TTR. Center-specific TTR (cTTR) describes the average, annual TTR of pa-tients treated in a medical center, such as a general prac-tice or a specialized clinic. The cTTR can be used to evaluate the quality of oral anticoagulation monitoring in these centers. In recent studies, the cTTR has mainly been calculated for anticoagulation clinics, as these pro-vide care for a large proportion of patients requiring oral anticoagulation in several countries, such as the UK, Italy and Spain. Besides anticoagulation clinics, OAC management is often undertaken by GPs. In Germany, GPs often work independently of each other in small units of mostly one or two physicians and often own the practice in which they work. In this setting, structures and procedures are not comparable to anticoagulation clinics and may be more personalized and limited in organizational and personnel resources. Thus, results of studies in anticoagulation clinics may not be generalizable and valid in these settings. To our know-ledge, differences in the quality of treatment with VKAs between individual GP practices in Germany and prac-tice- and patient-level factors associated with the TTR have not yet been studied satisfactorily.
in GP practices and reduce thromboembolic and major bleeding events [17]. The trial assessed the quality of VKA therapy at a patient level by determining the TTR. During the monitoring visits at the practices we got the impression that the quality of OAC treatment varies. Therefore, this sub-analysis focused on the quality of OAC on a practice level and investigated associations between TTR and certain practice and patient character-istics. The aims of this study were to:
– assess whether the PICANT intervention was
effective in improving the TTR and cTTR
– describe variations in cTTR between practices
– determine practice- and patient-level factors that are associated with the TTR
Methods
Study design and population
The PICANT study was an open cluster-randomized controlled trial conducted in 52 German GP practices [18]. The study was approved by the ethics committee (E 191/11) of Frankfurt University Hospital on June 26, 2012. The objective of the PICANT study was to exam-ine whether the application of major elements of case management can strengthen antithrombotic manage-ment in GP practices and thus lead to a reduction in thromboembolic and major bleeding events. First, we determined potentially eligible GP practices from a list provided by the Association of Statutory Health Insur-ance Physicians, with which GP practices must be regis-tered. Afterwards, 568 randomly selected practices received an invitation to participate and study informa-tion materials. Eligibility criteria were reviewed for prac-tices interested in participating in the study. Finally, when 52 GP practices were registered, practice recruit-ment was finished. To fulfil inclusion criteria, practices had to provide health services to persons with statutory health insurance (covering > 90% of the German popula-tion) and to have a software system that could identify potentially eligible patients. Patients were included in the study after practice recruitment but before cluster-randomization. For this purpose, each participating prac-tice and members of the study team created a screening list of potentially eligible patients using the practice soft-ware system [17]. Using the random number generator function in Microsoft Excel, randomly selected patients from this list were proposed to the GP and the study team, who then decided whether these patients were po-tential study participants on the basis of the inclusion criteria. When 30 eligible patients had been identified, they received a written invitation from the GP to partici-pate in the study. Once 15 patients had been included, patient recruitment at that practice was stopped. Inclu-sion criteria for patients were age > 18 years, a long-term
indication for oral anticoagulation based on the guide-lines valid at the time, and prescriptions for VKAs (cou-marins), antiplatelet therapies, or the DOACs Dabigatran or Rivaroxaban (which had already been ap-proved when the study began). Patients were excluded if they had a life expectancy of < 6 months, psychosis, se-vere sight disorders or auditory defects, alcohol or drug abuse, inadequate German language skills, or if they lived in institutions that did not allow study participa-tion [17].
Randomization and masking
Randomization took place, once patient recruitment and the baseline assessment had been completed. The web-based randomization tool“Randomizer for Clinical Trials” (www.randomizer.at) was used to randomly assign prac-tices to the intervention or control group in a ratio of 1:1. This was performed by a member of the Institute of Gen-eral Practice that had no further involvement in the study. Based on the number of inhabitants in the postal area where the practice was located, randomization was strati-fied using permuted blocks of size 8. For further details, see the published protocol [17].
Interventions
Prior to randomization, all practices received informa-tion materials, including the evidence-based“ Anticoagu-lation” guideline for general practitioners issued by the Guideline Group of the German state of Hesse, and a standardized information pamphlet for patients pro-duced by the German College of General Practitioners and Family Physicians [17]. In brief, the complex inter-vention included the additional provision of tools and training for healthcare assistants (HCA), information materials and quality circles for general practitioners, and 24-month case management and information mate-rials for patients.
protocol [17] and supplementary information of the main study [18].
Data collection
Data was collected from patients using questionnaires [20–24] and case report forms at three time points -baseline and at follow-ups after 12 and 24 months. An additional file shows an English version of the know-ledge test for GPs which was developed for the PICANT study (see Additional file 1). Further data was extracted from the “anticoagulation passes” (Marcumarpass). The anticoagulation pass includes patient data, diagnoses, medications, the INR-target range and each individual INR value (with date of measurement), as well as recom-mended anticoagulation doses. As the pass contains de-tails on individualized treatment plans and dose adjustment, it provides useful information to other treat-ing physicians. Patients’ INR values were obtained from these passes and missing values were added directly from patients’ medical records. Subsequently, all INR values were manually entered into a database and double checked by two different employees at the Institute. From the data collected at baseline, we selected several practice and patient characteristics to investigate pos-sible associations with the TTR. This initially included basic characteristics of GPs and patients, such as age and gender. Furthermore, practice characteristics, such as size and location and professional experience of the GP were included. Additional patient characteristics in-vestigated were amongst others BMI, compliance, several comorbidities and indication for OAC. To also consider the disease course of patients during the study period, we have included hospitalization and the primary end-point of the PICANT study (defined as combination of all thromboembolic events requiring hospitalization and major bleeding complications) [18] as covariates. The co-variates examined are listed in detail in Tables4and5.
Calculation of TTR and cTTR
Quality of the INR management was considered to be best expressed by the TTR. The TTR was estimated using linear interpolation between the different measure-ments in accordance with theRosendaal method[25].
We defined “standard” INR target ranges as recom-mended in current guidelines [18, 26], with a target range of 2.5 to 3.5 in patients with mitral or double heart valve replacement, and 2.0 to 3.0 in other patients. For an additional calculation, we also analysed the“ GP-based” target range, which took into consideration the target ranges documented by GPs in case report forms at baseline. For some patients, these GP-based target ranges differed from those generally recommended in current guidelines [26]. Unlike the calculation of the TTR in the main trial [18], INR values that were
intentionally outside the therapeutic range –e.g., due to bridging periods–were now excluded from the calcula-tions. As in previous studies (e.g. by Tosetto et al. [27]), the cTTR for each participating practice was calculated as the average TTR of patients at that practice.
Statistical analyses
TTR and cTTR values were descriptively summarized using mean and standard deviation (SD). Differences be-tween the intervention and control group were assessed by t test for cTTR and by means of a linear mixed model, due to the clustered nature of the data, for TTR. In the latter analysis, practice was considered as a ran-dom factor. Practice- and patient-level characteristics are presented either as absolute and relative frequencies or as mean and SD. Linear mixed model analyses were con-ducted to determine any association between patient and practice characteristics, and the TTR, both for standard and GP-based target ranges. Again, the practice was considered as a random effect in the analyses, and all models were additionally adjusted for the randomization group. Regression coefficients and 95% confidence inter-vals are presented. The conditional coefficient of deter-mination, R2, for generalized mixed models was calculated to assess model fit. Apvalue < 5% was considered signifi-cant. SPSS version 25 and R version 3.4.4 were used for the statistical analyses [28,29].
Results
Baseline characteristics
The PICANT study consisted of 736 patients (365 inter-vention and 371 control patients) from 52 GP practices. Patients were enrolled between July 2, 2012 and Dec 4, 2012. In the intervention group, the mean (standard devi-ation [SD]) number of participating patients per practice was 14.0 (1.6), while in the control group it was14.3 (1.5). Details on the screening process and characteristics of the sample have been described elsewhere [18,30].
TTR and cTTR
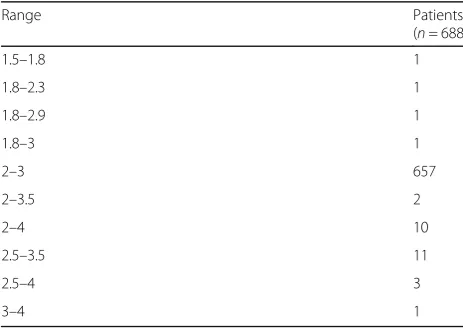
Data on INR measurements were available for 688 pa-tients, 344 from each randomization group. The stand-ard target ranges were 2.0–3.0 for 678 (98.5%) patients and 2.5–3.5 for the remaining 10 (1.5%). GP-based target ranges were more variable with 2.0–3.0 being the most common (657 (95.5%) patients), followed by 2.5–3.5 (11 (1.6%) patients) and 2.0–4.0 (10 (1.5%) patients). For the full list of ranges documented in the anticoagulation passes see Table 3. After 24 months, the TTR based on standard target ranges did not differ statistically signifi-cantly between the intervention group (mean TTR 75.1% (SD 17.6)) and the control group (mean TTR
74.3% (SD 17.8)); p= 0.670. The mean cTTR was 75.1% (SD 6.5, range 60.4–86.7%) in the intervention group vs. 74.3% (SD 7.2, range 52.7–85.7%) in the control group (p= 0.668). Figure 1 shows the variation in the cTTR in the participating practices during the 24-month study period; the cTTR ranged from 52.7 to 86.7%. The aver-age cTTR across both groups is shown as a horizontal line at 74.7%.
[image:5.595.59.536.96.507.2]The analyses using “GP-based” INR target ranges showed similar results: Within 24 months, the mean TTR was 75.3% (SD 17.2) in the intervention vs. 74.8% (SD 18.0) in the control group (p= 0.787). The mean cTTR was 75.3% (SD 6.4, range 60.4–86.7%) in the
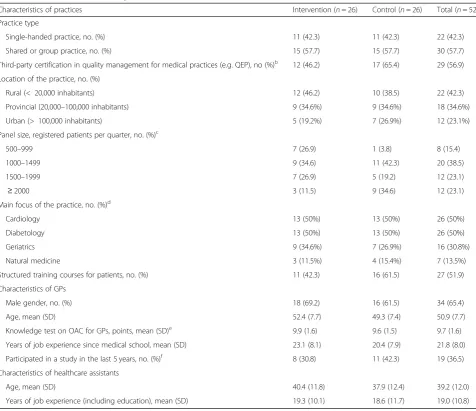
Table 1Baseline characteristics of practicesa
Characteristics of practices Intervention (n= 26) Control (n= 26) Total (n= 52)
Practice type
Single-handed practice, no. (%) 11 (42.3) 11 (42.3) 22 (42.3)
Shared or group practice, no. (%) 15 (57.7) 15 (57.7) 30 (57.7)
Third-party certification in quality management for medical practices (e.g. QEP), no (%)b 12 (46.2) 17 (65.4) 29 (56.9) Location of the practice, no. (%)
Rural (< 20,000 inhabitants) 12 (46.2) 10 (38.5) 22 (42.3)
Provincial (20,000–100,000 inhabitants) 9 (34.6%) 9 (34.6%) 18 (34.6%)
Urban (> 100,000 inhabitants) 5 (19.2%) 7 (26.9%) 12 (23.1%)
Panel size, registered patients per quarter, no. (%)c
500–999 7 (26.9) 1 (3.8) 8 (15.4)
1000–1499 9 (34.6) 11 (42.3) 20 (38.5)
1500–1999 7 (26.9) 5 (19.2) 12 (23.1)
≥2000 3 (11.5) 9 (34.6) 12 (23.1)
Main focus of the practice, no. (%)d
Cardiology 13 (50%) 13 (50%) 26 (50%)
Diabetology 13 (50%) 13 (50%) 26 (50%)
Geriatrics 9 (34.6%) 7 (26.9%) 16 (30.8%)
Natural medicine 3 (11.5%) 4 (15.4%) 7 (13.5%)
Structured training courses for patients, no. (%) 11 (42.3) 16 (61.5) 27 (51.9)
Characteristics of GPs
Male gender, no. (%) 18 (69.2) 16 (61.5) 34 (65.4)
Age, mean (SD) 52.4 (7.7) 49.3 (7.4) 50.9 (7.7)
Knowledge test on OAC for GPs, points, mean (SD)e 9.9 (1.6) 9.6 (1.5) 9.7 (1.6) Years of job experience since medical school, mean (SD) 23.1 (8.1) 20.4 (7.9) 21.8 (8.0)
Participated in a study in the last 5 years, no. (%)f 8 (30.8) 11 (42.3) 19 (36.5) Characteristics of healthcare assistants
Age, mean (SD) 40.4 (11.8) 37.9 (12.4) 39.2 (12.0)
Years of job experience (including education), mean (SD) 19.3 (10.1) 18.6 (11.7) 19.0 (10.8) a
This is a slightly different version of the original table from the main study [24] b
The quality management system QEP (Qualität und Entwicklung in Praxen® [Quality and Development in practices]) was developed by the National Association of Statutory Health Insurance Physicians and regional Associations of Statutory Health Insurance Physicians
c
In Germany, panel size is calculated as the number of patient registrations in a practice over a 3-month period d
Practices may have had more than one focus e
Self-developed knowledge questionnaire (sum score 0–12) with higher scores indicating greater knowledge about OAC f
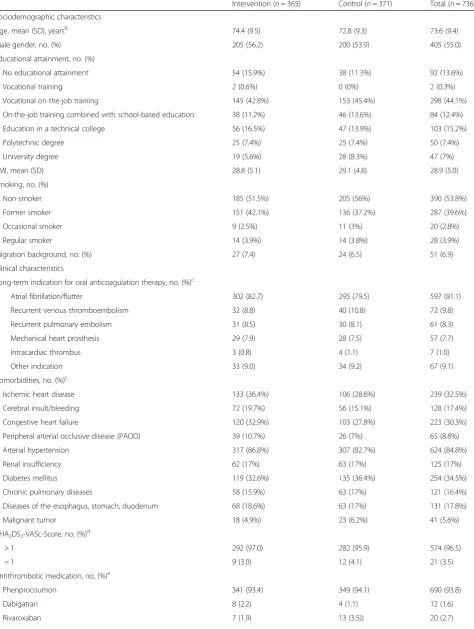
Table 2Baseline characteristics of patientsa
Intervention (n= 365) Control (n= 371) Total (n= 736)
Sociodemographic characteristics
Age, mean (SD), yearsb 74.4 (9.5) 72.8 (9.3) 73.6 (9.4)
Male gender, no. (%) 205 (56.2) 200 (53.9) 405 (55.0)
Educational attainment, no. (%)
No educational attainment 54 (15.9%) 38 (11.3%) 92 (13.6%)
Vocational training 2 (0.6%) 0 (0%) 2 (0.3%)
Vocational on-the-job training 145 (42.8%) 153 (45.4%) 298 (44.1%)
On-the-job training combined with school-based education 38 (11.2%) 46 (13.6%) 84 (12.4%)
Education in a technical college 56 (16.5%) 47 (13.9%) 103 (15.2%)
Polytechnic degree 25 (7.4%) 25 (7.4%) 50 (7.4%)
University degree 19 (5.6%) 28 (8.3%) 47 (7%)
BMI, mean (SD) 28.8 (5.1) 29.1 (4.8) 28.9 (5.0)
Smoking, no. (%)
Non-smoker 185 (51.5%) 205 (56%) 390 (53.8%)
Former smoker 151 (42.1%) 136 (37.2%) 287 (39.6%)
Occasional smoker 9 (2.5%) 11 (3%) 20 (2.8%)
Regular smoker 14 (3.9%) 14 (3.8%) 28 (3.9%)
Migration background, no. (%) 27 (7.4) 24 (6.5) 51 (6.9)
Clinical characteristics
Long-term indication for oral anticoagulation therapy, no. (%)c
Atrial fibrillation/flutter 302 (82.7) 295 (79.5) 597 (81.1)
Recurrent venous thromboembolism 32 (8.8) 40 (10.8) 72 (9.8)
Recurrent pulmonary embolism 31 (8.5) 30 (8.1) 61 (8.3)
Mechanical heart prosthesis 29 (7.9) 28 (7.5) 57 (7.7)
Intracardiac thrombus 3 (0.8) 4 (1.1) 7 (1.0)
Other indication 33 (9.0) 34 (9.2) 67 (9.1)
Comorbidities, no. (%)c
Ischemic heart disease 133 (36.4%) 106 (28.6%) 239 (32.5%)
Cerebral insult/bleeding 72 (19.7%) 56 (15.1%) 128 (17.4%)
Congestive heart failure 120 (32.9%) 103 (27.8%) 223 (30.3%)
Peripheral arterial occlusive disease (PAOD) 39 (10.7%) 26 (7%) 65 (8.8%)
Arterial hypertension 317 (86.8%) 307 (82.7%) 624 (84.8%)
Renal insufficiency 62 (17%) 63 (17%) 125 (17%)
Diabetes mellitus 119 (32.6%) 135 (36.4%) 254 (34.5%)
Chronic pulmonary diseases 58 (15.9%) 63 (17%) 121 (16.4%)
Diseases of the esophagus, stomach, duodenum 68 (18.6%) 63 (17%) 131 (17.8%)
Malignant tumor 18 (4.9%) 23 (6.2%) 41 (5.6%)
CHA2DS2-VASc-Score, no. (%)d
> 1 292 (97.0) 282 (95.9) 574 (96.5)
= 1 9 (3.0) 12 (4.1) 21 (3.5)
Antithrombotic medication, no. (%)e
Phenprocoumon 341 (93.4) 349 (94.1) 690 (93.8)
Dabigatran 8 (2.2) 4 (1.1) 12 (1.6)
intervention group vs. 74.8% (SD 7.6, range 52.7–87.4%) in the control group (p= 0.780).
Associations between practice / patient characteristics and the level of TTR
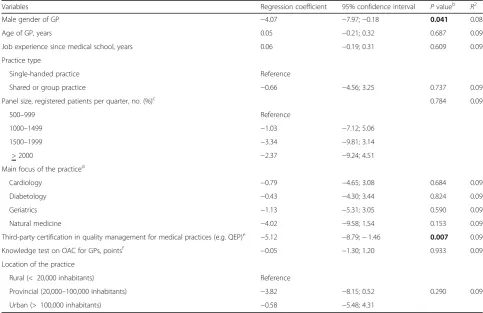
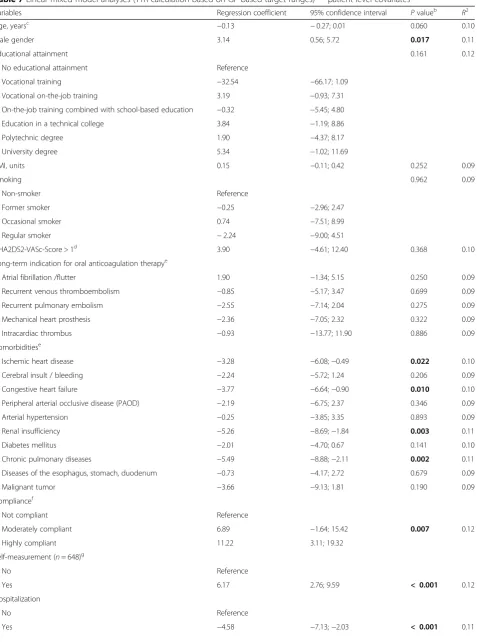
The results of the linear mixed model analyses based on standard INR target ranges showed that on a practice level, the TTR was significantly lower in practices with a male physician and with certification in quality manage-ment. Other factors, such as professional experience of the GP or setting (rural or urban location of the prac-tice) were not statistically significantly associated with the TTR (see Table4).
At a patient level, the models showed that the TTR was significantly higher in patients with moderate to high compliance, in men, and in patients that self-managed their INR values. Here, no distinction was made between self-measurement with and without additional dose adjustment by the patient. A significantly lower TTR was found in patients with a hospital stay during the study
period, and in patients with various comorbidities, such as ischemic heart disease, congestive heart failure, chronic kidney disease and chronic pulmonary dis-eases. A significantly lower TTR was also associated with the occurrence of a primary endpoint of the PICANT study (defined as a combination of all thromboembolic events requiring hospitalization and major bleeding complications documented by GPs in the case report form) during the study period. Factors such as age and educational attainment were not sig-nificantly associated with TTR (see Table 5).
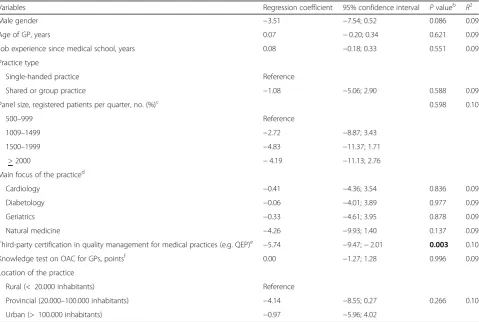
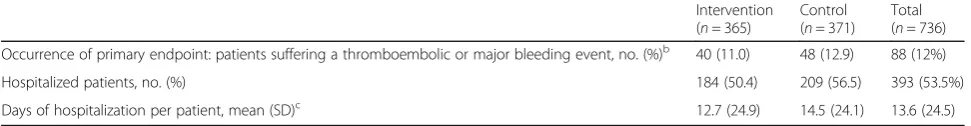
When GP-based INR target ranges were used in the analysis, the results were similar, with only one difference. The gender of the GP was no longer statistically signifi-cantly associated with TTR. Detailed results of the linear mixed model analyses using GP-based INR target ranges can be found in Tables 6 and 7. References to results of the main study, that were included in this analysis (Occur-rence of primary endpoint and hospitalization) can be seen in Table8and in the corresponding paper [18].
Discussion
The aim of this analysis was to assess whether the com-plex PICANT intervention was effective in improving the TTR and cTTR, to describe variations in cTTR be-tween practices, and to determine whether practice- and patient-level factors are associated with the TTR.
[image:7.595.55.540.99.225.2]According to the results of the main study the PICANT intervention could improve process parameters such as patients’ perceived quality of care and patient and HCA knowledge about OAC [18,31]. Nevertheless, we found that it did not effectively improve the quality of OAC therapy in terms of the TTR and cTTR. As OAC therapy was generally of good quality in both, the intervention and the control groups, further improve-ment was perhaps difficult to achieve. In PICANT, the Table 2Baseline characteristics of patientsa(Continued)
Intervention (n= 365) Control (n= 371) Total (n= 736)
Aspirin 4 (1.1) 6 (1.6) 10 (1.4)
Other 9 (2.5) 3 (0.8) 12 (1.6)
Last INR within therapeutic target range, no. (%)f 240 (69.2) 239 (68.7) 479 (68.9)
INR self-measurement, no. (%)g 39 (11.3) 46 (13.3) 85 (12.3)
Patient compliance, no. (%)h
Highly compliant 308 (84.4) 266 (72.1) 574 (78.2)
Moderately compliant 51 (14.0) 86 (23.3) 137 (18.7)
Not compliant 6 (1.6) 17 (4.6) 23 (3.1)
a
This is a slightly different version of the original table from the main study [24] b
Age was calculated from 15/mm/yyyy since the exact birth date was not documented to ensure data privacy c
Patients may have had more than one indication, and/or more than one comorbidity d
Refers to 595 patients with atrial fibrillation/flutter and available data e
Apixaban and Edoxaban had not been approved at the time of the baseline assessment f
Only considers patients receiving phenprocoumon; target INR range as defined by GP g
Distinction between self-measurement yes and no, dose adjustment not taken into account h
Compliance was assessed for each patient by his GP; data available for 369 patients in control group
Table 3GP-based INR target ranges
Range Patients
(n= 688)
1.5–1.8 1
1.8–2.3 1
1.8–2.9 1
1.8–3 1
2–3 657
2–3.5 2
2–4 10
2.5–3.5 11
2.5–4 3
[image:7.595.56.288.568.732.2]Fig. 1cTTR of the practices based on standard target ranges during the 24-month study period (Calculation of cTTR values excluded bridging periods)
Table 4Linear mixed model analyses (TTR calculated according to standard target ranges)a–practice-level covariates
Variables Regression coefficient 95% confidence interval Pvalueb
R2
Male gender of GP −4.07 −7.97;−0.18 0.041 0.08
Age of GP, years 0.05 −0.21; 0.32 0.687 0.09
Job experience since medical school, years 0.06 −0.19; 0.31 0.609 0.09
Practice type
Single-handed practice Reference
Shared or group practice −0.66 −4.56; 3.25 0.737 0.09
Panel size, registered patients per quarter, no. (%)c 0.784 0.09
500–999 Reference
1000–1499 −1.03 −7.12; 5.06
1500–1999 −3.34 −9.81; 3.14
> 2000 −2.37 −9.24; 4.51
Main focus of the practiced
Cardiology −0.79 −4.65; 3.08 0.684 0.09
Diabetology −0.43 −4.30; 3.44 0.824 0.09
Geriatrics −1.13 −5.31; 3.05 0.590 0.09
Natural medicine −4.02 −9.58; 1.54 0.153 0.09
Third-party certification in quality management for medical practices (e.g. QEP)e −5.12 −8.79;−1.46 0.007 0.09
Knowledge test on OAC for GPs, pointsf −0.05 −1.30; 1.20 0.933 0.09
Location of the practice
Rural (< 20,000 inhabitants) Reference
Provincial (20,000–100,000 inhabitants) −3.82 −8.15; 0.52 0.290 0.09
Urban (> 100,000 inhabitants) −0.58 −5.48; 4.31
a
These analyses are based onn= 688 patients and the models are adjusted for randomization group bpvalues marked in bold are statistically significant at a significance level of 0.05
cIn Germany, panel size is calculated as the number of patient registrations in a practice over a 3-month period dPractices may have had more than one focus
eThe quality management system QEP (Qualität und Entwicklung in Praxen® [Quality and Development in practices]) was developed by the National Association of Statutory Health Insurance Physicians and regional Associations of Statutory Health Insurance Physicians
[image:8.595.55.539.359.672.2]Table 5Linear mixed model analyses (TTR calculation based on standard target ranges)a–patient-level covariates
Variables Regression coefficient 95% confidence interval Pvalueb R2
Age, yearsc −0.12 −0.26; 0.02 0.083 0.09
Male gender 2.99 0.38; 5.60 0.025 0.10
Educational attainment 0.069 0.11
No educational attainment Reference
Vocational training −47.66 −81.63;−13.68
Vocational on-the-job training 2.63 −1.53; 6.80
On-the-job training combined with school-based education −0.94 −6.12; 4.24
Education in a technical college 3.19 −1.88; 8.27
Polytechnic degree 1.78 −4.56; 8.11
University degree 3.84 −2.58; 10.26
BMI, units 0.14 −0.13; 0.40 0.318 0.08
Smoking 0.953 0.08
Non-smoker Reference
Former smoker −0.30 −3.04; 2.45
Occasional smoker 0.96 −7.38; 9.30
Regular smoker −2.01 −8.84; 4.82
CHA2DS2-VASc-Score > 1d
3.42 −5.14; 11.98 0.433 0.09
Long-term indication for oral anticoagulation therapye
Atrial fibrillation/flutter 2.22 −1.06; 5.50 0.185 0.08
Recurrent venous thromboembolism −0.81 −5.17; 3.55 0.716 0.08
Recurrent pulmonary embolism −2.12 −6.76; 2.53 0.371 0.08
Mechanical heart prosthesis −3.27 −8.00; 1.46 0.175 0.08
Intracardiac thrombus −0.23 −13.22; 12.75 0.972 0.08
Comorbiditiese
Ischemic heart disease −3.42 −6.24;−0.59 0.018 0.09
Cerebral insult/bleeding −2.17 −5.68; 1.35 0.227 0.09
Congestive heart failure −3.41 −6.31;−0.51 0.021 0.09
Peripheral arterial occlusive disease (PAOD) −1.83 −6.43; 2.78 0.436 0.08
Arterial hypertension 0.00 −3.64; 3.64 1.000 0.08
Renal insufficiency −5.76 −9.22;−2.30 0.001 0.10
Diabetes mellitus −1.67 −4.38; 1.05 0.228 0.09
Chronic pulmonary diseases −5.91 −9.33;−2.49 0.001 0.10
Diseases of the esophagus, stomach, duodenum −0.41 −3.89; 3.07 0.818 0.08
Malignant tumor −4.31 −9.84; 1.22 0.126 0.09
Compliancef
Not compliant Reference
Moderately compliant 6.41 −2.22; 15.04 0.008 0.10
Highly compliant 10.87 2.67; 19.06
Self-measurement (n= 648)g
No Reference
Yes 5.21 1.74; 8.67 0.003 0.10
Hospitalization
No Reference
TTR averaged 75.1% in the intervention group and 74.3% in the control group, which is considered good in current guidelines, which recommend a TTR > 70% [26]. In addition, it is higher than the TTR found in previous trials in German GP practices. For example, in a trial by Vormfelde et al., the mean TTR was 66% [32], and in a
[image:10.595.54.538.101.156.2]trial by Mueller et al., the mean TTR was 67.7% [33]. In the thrombEVAL study, which was carried out in GP practices and among ambulatory specialists, the mean TTR was 63.9% [34]. While the TTR in a meta-analysis in the United States was 51% in a primary care setting [35], the Swedish national quality registry for atrial Table 5Linear mixed model analyses (TTR calculation based on standard target ranges)a–patient-level covariates(Continued)
Variables Regression coefficient 95% confidence interval Pvalueb R2
Number of days of hospitalizationh
Per day −0.09 −0.14;−0.04 0.001 0.10
Occurrence of primary endpointi −4.78 −8.85;−0.71 0.021 0.09
a
These analyses are based onn= 688 patients and the models are adjusted via randomization group b
p values marked in bold are statistically significant based on a significance level of 0.05 c
Age was calculated from 15/mm/yyyy since the exact birth date was not documented to ensure data privacy d
Reference category“= 1”because no“= 0”exists e
Patients may have had more than one indication, and/or more than one comorbidity f
Compliance was assessed for each patient by his GP g
Distinction between self-measurement yes and no, dose adjustment not taken into account h
“Days in hospital in total”(during the study period) i
primary endpoint = combination of all thromboembolic events requiring hospitalization and major bleeding complications, as documented by GPs in the case report form (if more than one event occurred in a patient, the earliest event was considered)
Table 6Linear mixed model analyses (TTR calculation based on GP-based target ranges)a–practice-level covariates
Variables Regression coefficient 95% confidence interval Pvalueb R2
Male gender −3.51 −7.54; 0.52 0.086 0.09
Age of GP, years 0.07 −0.20; 0.34 0.621 0.09
Job experience since medical school, years 0.08 −0.18; 0.33 0.551 0.09
Practice type
Single-handed practice Reference
Shared or group practice −1.08 −5.06; 2.90 0.588 0.09
Panel size, registered patients per quarter, no. (%)c 0.598 0.10
500–999 Reference
1009–1499 −2.72 −8.87; 3.43
1500–1999 −4.83 −11.37; 1.71
> 2000 −4.19 −11.13; 2.76
Main focus of the practiced
Cardiology −0.41 −4.36; 3.54 0.836 0.09
Diabetology −0.06 −4.01; 3.89 0.977 0.09
Geriatrics −0.33 −4.61; 3.95 0.878 0.09
Natural medicine −4.26 −9.93; 1.40 0.137 0.09
Third-party certification in quality management for medical practices (e.g. QEP)e −5.74 −9.47;−2.01 0.003 0.10
Knowledge test on OAC for GPs, pointsf 0.00 −1.27; 1.28 0.996 0.09
Location of the practice
Rural (< 20.000 inhabitants) Reference
Provincial (20.000–100.000 inhabitants) −4.14 −8.55; 0.27 0.266 0.10
Urban (> 100.000 inhabitants) −0.97 −5.96; 4.02
a
These analyses are based onn= 688 patients and the models are adjusted for randomization group bp
values marked in bold are statistically significant at a significance level of 0.05 c
In Germany, panel size is calculated as the number of patient registrations in a practice over a 3-month period d
Practices may have had more than one focus e
The quality management system QEP (Qualität und Entwicklung in Praxen® [Quality and Development in practices]) was developed by the National Association of Statutory Health Insurance Physicians and regional Associations of Statutory Health Insurance Physicians
f
[image:10.595.59.539.350.672.2]Table 7Linear mixed model analyses (TTR calculation based on GP-based target ranges)a–patient-level covariates
Variables Regression coefficient 95% confidence interval Pvalueb R2
Age, yearsc −0.13 −0.27; 0.01 0.060 0.10
Male gender 3.14 0.56; 5.72 0.017 0.11
Educational attainment 0.161 0.12
No educational attainment Reference
Vocational training −32.54 −66.17; 1.09
Vocational on-the-job training 3.19 −0.93; 7.31
On-the-job training combined with school-based education −0.32 −5.45; 4.80
Education in a technical college 3.84 −1.19; 8.86
Polytechnic degree 1.90 −4.37; 8.17
University degree 5.34 −1.02; 11.69
BMI, units 0.15 −0.11; 0.42 0.252 0.09
Smoking 0.962 0.09
Non-smoker Reference
Former smoker −0.25 −2.96; 2.47
Occasional smoker 0.74 −7.51; 8.99
Regular smoker −2.24 −9.00; 4.51
CHA2DS2-VASc-Score > 1d
3.90 −4.61; 12.40 0.368 0.10
Long-term indication for oral anticoagulation therapye
Atrial fibrillation /flutter 1.90 −1.34; 5.15 0.250 0.09
Recurrent venous thromboembolism −0.85 −5.17; 3.47 0.699 0.09
Recurrent pulmonary embolism −2.55 −7.14; 2.04 0.275 0.09
Mechanical heart prosthesis −2.36 −7.05; 2.32 0.322 0.09
Intracardiac thrombus −0.93 −13.77; 11.90 0.886 0.09
Comorbiditiese
Ischemic heart disease −3.28 −6.08;−0.49 0.022 0.10
Cerebral insult / bleeding −2.24 −5.72; 1.24 0.206 0.09
Congestive heart failure −3.77 −6.64;−0.90 0.010 0.10
Peripheral arterial occlusive disease (PAOD) −2.19 −6.75; 2.37 0.346 0.09
Arterial hypertension −0.25 −3.85; 3.35 0.893 0.09
Renal insufficiency −5.26 −8.69;−1.84 0.003 0.11
Diabetes mellitus −2.01 −4.70; 0.67 0.141 0.10
Chronic pulmonary diseases −5.49 −8.88;−2.11 0.002 0.11
Diseases of the esophagus, stomach, duodenum −0.73 −4.17; 2.72 0.679 0.09
Malignant tumor −3.66 −9.13; 1.81 0.190 0.09
Compliancef
Not compliant Reference
Moderately compliant 6.89 −1.64; 15.42 0.007 0.12
Highly compliant 11.22 3.11; 19.32
Self-measurement (n= 648)g
No Reference
Yes 6.17 2.76; 9.59 < 0.001 0.12
Hospitalization
No Reference
fibrillation and anticoagulation ‘AuriculA’showed that a high TTR of 80.3% could be achieved in primary care centers [36].
In the PICANT study, the cTTR in the individual GP practices ranged from 52.7 to 86.7%. This rather wide range is in line with results from a previous trial in anticoagulation clinics, in which median cTTR values ranged from 57.7 to 87.7% [37]. We investi-gated factors at a practice and patient level to deter-mine any association with the TTR. On a practice level, GP practices with third-party certification in quality management (QM) had a lower TTR than practices without such certification. However, a lower proportion of intervention than control practices had third-party certification in quality management (46.2% vs. 65.4%), and the type of certification varied. An examination of the importance of QM certification from the point of view of German GPs showed that the benefits of QM in general practice were viewed critically on account of a tendency towards strict standardization in the treatment of individual patients [38]. Other factors tested at a practice level were not significantly associated with the TTR. In a recent trial in German GP practices, practice characteristics were also unable to explain poor adjustment quality, de-fined as TTR < 60% [33]. Factors such as differences in the patient collective of a specific practice, or the GP’s response to patient-dependent risk factors, might, for example, lead to poorer quality of therapy.
At a patient level, we found that the TTR was signifi-cantly higher in patients with moderate to high compli-ance, in men, and in patients that self-managed their INR values, while we found a significantly lower TTR in patients with certain comorbidities and with a hospital stay during the study period. Previous studies have de-scribed a negative association between female gender and the quality of OAC [39,40]. A negative association has also been discovered between patients with specific comorbidities and their TTR in previous trials. While ischemic heart disease, congestive heart failure, renal in-sufficiency and chronic pulmonary diseases were associ-ated with a significantly lower TTR in the PICANT study, a recent trial identified an association with dia-betes mellitus and peripheral arterial disease [41]. Schae-fer et al. have further shown that the presence of at least two comorbidities, regardless of their nature, is associ-ated with poor quality of OAC, defined as percentage of INR values within target range < 75% [39].
[image:12.595.54.538.101.156.2]OAC with VKAs is a complex therapy that requires in-dividual dose adjustment and regular INR monitoring. It is therefore plausible that a moderate to high level of compliance in the PICANT study, or adherence as reported in a previous trial [33], was associated with a statistically significantly higher TTR. In PICANT, hospitalization was associated with a significantly lower TTR. However, we were unable to ascertain whether problems in OAC management led to the hospital stays, or whether the TTR was lower as a result of Table 7Linear mixed model analyses (TTR calculation based on GP-based target ranges)a–patient-level covariates(Continued)
Variables Regression coefficient 95% confidence interval Pvalueb R2
Number of days of hospitalizationh
Per day −0.09 −0.14;−0.03 0.001 0.11
Occurrence of primary endpointi −4.42 −8.44;−0.39 0.032 0.10
a
These analyses are based onn= 688 patients and the models are adjusted via randomization group b
pvalues marked in bold are statistically significant based on a significance level of 0.05 c
Age was calculated from 15/mm/yyyy since the exact birth date was not documented to ensure data privacy d
Reference category“= 1”because no“= 0”exists e
Patients may have had more than one indication and/or more than one comorbidity f
Compliance was assessed for each patient by his GP g
Distinction between self-measurement yes and no, dose adjustment not taken into account h
“Days in hospital in total”(during the study period) i
primary endpoint = combination of all thromboembolic events requiring hospitalization and major bleeding complications, as documented by GPs in the case report form (if more than one event occurred in a patient, the earliest event was considered)
Table 8Considered results of the main studya
Intervention (n= 365)
Control (n= 371)
Total (n= 736)
Occurrence of primary endpoint: patients suffering a thromboembolic or major bleeding event, no. (%)b 40 (11.0) 48 (12.9) 88 (12%)
Hospitalized patients, no. (%) 184 (50.4) 209 (56.5) 393 (53.5%)
Days of hospitalization per patient, mean (SD)c 12.7 (24.9) 14.5 (24.1) 13.6 (24.5)
a
This table shows results of the intention-to-treat analysis of the main study, which can be seen in detail in the corresponding paper [24]. It is shown here, because these results were included in the linear mixed model analysis (see Tables5and7)
b
If more than one event occurred in a patient, the earliest event was counted c
[image:12.595.56.542.635.698.2]hospitalization, as it may have resulted from a change in the attending physician, or a necessary interruption of OAC due to an invasive procedure. Alternatively, both events may have been triggered by another factor. In PICANT, patients that were self-managing their INR values had a significantly higher TTR. Previous stud-ies have also shown that the INR values of patients that carry out self-management are statistically signifi-cantly more likely to be in their therapeutic target range [34, 42, 43].
Compared to standard target ranges, GP-based target ranges were more variable and partly differed from those generally recommended in guidelines. It is necessary to examine critically antithrombotic therapies when the tar-get ranges are outside those specified in guidelines. One reason for a non-standard target range may be that fear of a higher individual risk of bleeding or thromboembol-ism, encourages GPs to set the target range limits slightly higher or lower than specified in guidelines. Some physicians may also narrow INR target ranges to obtain tighter control of anticoagulation and thus fewer complications. However, a previous study recommended avoiding a narrow INR management strategy since, ra-ther than achieving tighter anticoagulation control, it re-sulted in a significantly increased incidence of out-of-range INR values and blood draws [44]. Further investi-gations of practice characteristics associated with high or low TTR values will help in the development of rec-ommendations in primary care. However, the repeatedly demonstrated association between patient-level factors and the TTR underlines the importance of taking into account those patient characteristics that may make it difficult to achieve high quality therapeutic outcomes. Currently, with increased use of DOACs, the importance of VKAs in OAC is changing [3]. However, the discus-sion on the advantages and disadvantages of VKAs and DOACs is still relevant and the subject of many studies [45,46]. Choosing the right drug for oral anticoagulation and ensuring the therapy is of high quality continues to be an important challenge for GPs. Despite increased use of DOACs, some patients will still take VKAs be-cause they are indicated in patients with mechanical heart valve replacement or in patients with severe chronic kidney disease. In the future, target group-spe-cific investigations into the quality of therapy may there-fore provide further important insights.
Strengths and limitations
In addition to the large sample size and the intervention period of 24 months, an important strength of the PICANT study is that it depicts the reality of caring for patients with OAC under everyday conditions. For this reason, it is also reassuring that the quality of treatment was generally at a relatively high level already. Another
strength is the relatively low loss to follow-up during the study period. After 24 months, 79 of 736 patients (9% in the intervention group vs. 12.4% in the control group) had left the study before it ended either because of death, or the patient’s decision to cancel participation.
There may have been some selection bias, as the propor-tion of patients self-managing their INR values was higher among participants than among non-participants. One rea-son for this may be that patients who agree to participate in clinical trials are particularly motivated and therefore more likely to perform INR self-management. However, partici-pants and non-participartici-pants showed no relevant differences in terms of age and gender. Hospitalization among partici-pating patients was documented in days, but the INR values measured during such hospital stays could not be ascer-tained. In 116 (15.8%) patients changed their anticoagulant medication during the course of the study for a variety of reasons. Thus, oral anticoagulation with a given drug could not be monitored over the entire study period in these pa-tients. This fact also reflects the changes in antithrombotic therapy resulting from increased approval of DOACs dur-ing the course of the trial. Despite the overall large sample size, the variation in the cTTR between GP practices must be assessed cautiously in light of the limited sample size per practice. Finally, an important limitation in the interpret-ation of the results are the small values for R2(range 0.08– 0.12, see Tables4,5,6and7), which suggest that no single factor is able to explain the variance of the TTR. It can be assumed that there is a complex interplay of many individ-ual factors.
Conclusions
As the quality of OAC was generally high, the intervention resulted in no statistically significant improvement. How-ever, variation between the practices indicates optimization potential in some of them. Nevertheless, a repeatedly dem-onstrated association between patient-level factors and the TTR underlines the importance of bearing in mind those patient characteristics that may make it difficult to achieve high quality therapeutic outcomes.
Additional file
Additional file 1:Knowledge test for GPs. The additional file shows an English version of the knowledge test for GPs which was developed for the PICANT study. It was used to evaluate the level of knowledge of participating GPs about oral anticoagulation therapy. (DOCX 220 kb)
Abbreviations
Acknowledgements
First and foremost, we would like to thank all practices and patients that participated in the pilot phase and the main trial.
We would also like to thank Antje Erler, MD, Ina Roehl, MD, Marion Torge, MD, and Julia Hirschfeld, MSc, for their support in collecting and analyzing the data. We are most grateful to Corina Guethlin, PhD, and Martin Beyer for their help in protocol development and to the hemostasis experts Prof. V. Hach-Wunderle, MD, and T. Gary, MD, for their support in the critical review of the study materials. Furthermore, we are grateful to the members of the scientific board (Professor Jack E. Ansell, MD, Professor Herbert Watzke, MD, Professor Meinhard Kieser, Dr.sc.hum, Justine Rochon, MSc) and the practice advisory board (Armin Wunder, MD, Joachim Fessler, MD, Wolfgang Blank, MD). We would also like to express our gratitude to Birgit Schorsch for per-forming the financial calculations and to Phillip Elliott for editing the final manuscript.
Authors’contributions
AS, JJP and CM designed the study. CM drafted the manuscript. AB, GP and CM analyzed the data. JJP contributed to the interpretation of the findings and helped draft the manuscript. AS, JJP, LRU, KM, BK, SR, SH, SSR, and FMG contributed to the discussion of the results and all authors read and approved the final manuscript.
Funding
This study was funded by the German Federal Ministry of Education and Research (grant number 01GY1145). The funding authority had no influence on study design, data collection, data analysis, data interpretation, preparing this report, or the decision to submit this paper for publication. None of the authors received any remuneration from a pharmaceutical company or another for-profit organization for writing this manuscript. The corresponding author had full access to all the data in the study and was ultimately respon-sible for the decision to submit for publication.
Availability of data and materials
The datasets used and analyzed during the current study are available at Data Archiving and Networked Services (DANS).https://easy.dans.knaw.nl/ui/datasets/ id/easy-dataset:112285;jsessionid=9032382CAF7B08281C5C7A7C2A58E465
Ethics approval and consent to participate
The Ethics Committee (E 191/11) of the Department of Medicine of the University of Frankfurt am Main (“Ethik-Kommission des Fachbereichs Medizin der Goethe-Universität Frankfurt am Main”) rated the study with ap-proval on June 26, 2012.
Reference number: 404/11
Before the study started, we obtained signed written informed consent from all participants.
Consent for publication
Not applicable.
Competing interests
JJP was co-investigator and KM project manager in the PANORA study (‘Prevalence of anti-cyclic citrullinated peptide (CCP) positivity in patients with new non-specific onset of musculoskeletal symptoms, possibly related to early rheumatoid arthritis in general practices in Germany’). The PANORA study was conducted by the Fraunhofer Institute and financed by Bristol-Meyer Squibb. JJP and KM are employed by the Institute of General Practice of Goethe University Frankfurt and have never personally received any finan-cial compensation from a pharmaceutical company. AS carried out a system-atic review of the self-management of oral anticoagulation in 2014 with funding from the Federation of Austrian Social Insurance Institutions (HVB). She also received financial support from ROCHE Diagnostics to conduct a study on self-management of oral anticoagulation from 2002 to 2005. SH has received honoraria for scientific lectures from Boehringer Ingelheim GmbH, Pfizer GmbH, Daiichi Sankyo GmbH, and Bayer AG. The other authors declare no competing interests.
Author details
1Institute of General Practice, Goethe University Frankfurt am Main,
Theodor-Stern-Kai 7, 60590 Frankfurt/Main, Germany.2Institute of General
Practice and Evidence-based Health Services Research, Medical University
Graz, Auenbruggerplatz 2/9, A-8036 Graz, Austria.3Institute for Medical
Informatics, Statistics and Documentation, Medical University Graz, Auenbruggerplatz 2/9, A-8036 Graz, Austria.4Institute of Clinical
Pharmacology, Goethe University Frankfurt am Main, Theodor-Stern-Kai 7, 60590 Frankfurt/Main, Germany.
Received: 29 January 2019 Accepted: 25 July 2019
References
1. Zoni-Berisso M, Lercari F, Carazza T, Domenicucci S. Epidemiology of atrial fibrillation: European perspective. Clin Epidemiol. 2014;6:213–20.
2. Ansell J, Hirsh J, Hylek E, Jacobson A, Crowther M, Palareti G. Pharmacology and management of the vitamin K antagonists: American College of Chest Physicians Evidence-Based Clinical Practice Guidelines (8th edition). Chest. 2008;133(6 Suppl):160S–98S.
3. Schwabe U, Paffrath D, Ludwig W-D, Klauber J. Arzneiverordnungs-Report 2017 [drug prescription report 2017]. Berlin; Heidelberg: Springer; 2017. Available from:https://ebookcentral.proquest.com/lib/gbv/detail. action?docID=5113054.
4. Garkina SV, Vavilova TV, Lebedev DS, Mikhaylov EN. Compliance and adherence to oral anticoagulation therapy in elderly patients with atrial fibrillation in the era of direct oral anticoagulants. J Geriatr Cardiol. 2016; 13(9):807–10.
5. Arzneimittelkommission der deutschen Ärzteschaft. Leitfaden“Orale Antikoagulation bei nicht valvulärem Vorhofflimmern”(2. überarbeitete Auflage). [Drug commission of the German medical profession. Guideline“Oral anticoagulation in non-valvular atrial fibrillation”(2nd revised edition)]; 2016. 6. Holbrook A, Dormuth C, Morrow R, Lee A, Troyan S, Li G, et al. Comparative
effectiveness and safety of oral anticoagulants for atrial fibrillation in real-world practice: a population-based cohort study protocol. BMJ Open. 2016; 6(11):e013263.
7. Douketis J, Bell AD, Eikelboom J, Liew A. Approach to the new oral anticoagulants in family practice: part 2: addressing frequently asked questions. Can Fam Physician. 2014;60(11):997–1001.
8. Steffel J, Verhamme P, Potpara TS, Albaladejo P, Antz M, Desteghe L, et al. The 2018 European heart rhythm association practical guide on the use of non-vitamin K antagonist oral anticoagulants in patients with atrial fibrillation. Eur Heart J. 2018;39(16):1330–93.
9. Mekaj YH, Mekaj AY, Duci SB, Miftari EI. New oral anticoagulants: their advantages and disadvantages compared with vitamin K antagonists in the prevention and treatment of patients with thromboembolic events. Ther Clin Risk Manag. 2015;11:967–77.
10. Hart RG, Pearce LA, Aguilar MI. Meta-analysis: antithrombotic therapy to prevent stroke in patients who have Nonvalvular atrial fibrillation. Ann Intern Med. 2007;146(12):857.
11. Oake N, Fergusson DA, Forster AJ, van Walraven C. Frequency of adverse events in patients with poor anticoagulation: a meta-analysis. CMAJ. 2007; 176(11):1589–94.
12. White HD, Gruber M, Feyzi J, Kaatz S, Tse H-F, Husted S, et al. Comparison of outcomes among patients randomized to warfarin therapy according to anticoagulant control: results from SPORTIF III and V. Arch Intern Med. 2007; 167(3):239–45.
13. Szummer K, Gasparini A, Eliasson S, Ärnlöv J, Qureshi AR, Bárány P, et al. Time in Therapeutic Range and Outcomes After Warfarin Initiation in Newly Diagnosed Atrial Fibrillation Patients With Renal Dysfunction. J Am Heart Assoc. 2017;6(3).
14. Taggar JS, Lip GYH. Anticoagulation for elderly patients with atrial fibrillation: not to be neglected. Europace. 2008;10(1):1–2.
15. Kimmel SE, Chen Z, Price M, Parker CS, Metlay JP, Christie JD, et al. The influence of patient adherence on anticoagulation control with warfarin: results from the international normalized ratio adherence and genetics (IN-RANGE) study. Arch Intern Med. 2007;167(3):229–35.
16. Couris R, Tataronis G, McCloskey W, Oertel L, Dallal G, Dwyer J, et al. Dietary vitamin K variability affects international normalized ratio (INR) coagulation indices. Int J Vitam Nutr Res. 2006;76(2):65–74.
18. Siebenhofer A, Ulrich L-R, Mergenthal K, Berghold A, Pregartner G, Kemperdick B, et al. Primary care management for patients receiving long-term antithrombotic treatment: a cluster-randomized controlled trial. PLoS One. 2019;14(1):e0209366.
19. Ulrich L-R, Petersen JJ, Mergenthal K, Roehl I, Rauck S, Erler A, et al. Eine Monitoring-Liste für ein hausärztliches Case Management bei oraler Antikoagulation. [A monitoring list for oral anticoagulation case management in primary care]. Z Allg Med. 2013;89(4):165–71.
20. EuroQol--a new facility for the measurement of health-related quality of life. Health Policy 1990; 16(3):199–208.
21. Goetz K, Freund T, Gensichen J, Miksch A, Szecsenyi J, Steinhaeuser J. Adaptation and psychometric properties of the PACIC short form. Am J Manag Care. 2012;18(2):e55–60.
22. Morisky DE, Green LW, Levine DM. Concurrent and predictive validity of a self-reported measure of medication adherence. Med Care. 1986;24(1): 67–74.
23. Hua TD, Vormfelde SV, Abu Abed M, Schneider-Rudt H, Sobotta P, Friede T, et al. Practice nursed-based, individual and video-assisted patient education in oral anticoagulation--protocol of a cluster-randomized controlled trial. BMC Fam Pract. 2011;12:17.
24. Man-Son-Hing M, Laupacis A, O'Connor AM, Biggs J, Drake E, Yetisir E, et al. A patient decision aid regarding antithrombotic therapy for stroke prevention in atrial fibrillation: a randomized controlled trial. JAMA. 1999; 282(8):737–43.
25. Rosendaal FR, Cannegieter SC, van der Meer FJ, Briët E. A method to determine the optimal intensity of oral anticoagulant therapy. Thromb Haemost. 1993;69(3):236–9.
26. Kirchhof P, Benussi S, Kotecha D, Ahlsson A, Atar D, Casadei B, et al. 2016 ESC guidelines for the Management of Atrial Fibrillation Developed in collaboration with EACTS. Rev Esp Cardiol (Engl Ed). 2017;70(1):50. 27. Tosetto A, Manotti C, Marongiu F. Center-related determinants of VKA
anticoagulation quality: a prospective. Multicenter Evaluation PLoS ONE. 2015;10(12):e0144314.
28. IBM Corp. Released 2017. IBM SPSS statistics for Macintosh, version 25.0. Armonk: IBM Corp.
29. R: A Language and Environment for Statistical Computing. Version 3.4.4. Vienna, Austria: R Foundation for Statistical Computing; 2018. Available from: URL:www.R-project.org.
30. Ulrich L-R, Mergenthal K, Petersen JJ, Roehl I, Rauck S, Kemperdick B, et al. Anticoagulant treatment in German family practices - screening results from a cluster randomized controlled trial. BMC Fam Pract. 2014;15:170. 31. Maikranz V, Siebenhofer A, Ulrich L-R, Mergenthal K, Schulz-Rothe S,
Kemperdick B, et al. Does a complex intervention increase patient knowledge about oral anticoagulation? - a cluster-randomised controlled trial. BMC Fam Pract. 2017;18(1):15.
32. Vormfelde SV, Abu Abed M, Hua TD, Schneider S, Friede T, Chenot J-F. Educating orally anticoagulated patients in drug safety: a cluster-randomized study in general practice. Dtsch Arztebl Int. 2014;111(37): 607–14.
33. Mueller S, Pfannkuche M, Breithardt G, Bauersachs R, Maywald U, Kohlmann T, et al. The quality of oral anticoagulation in general practice in patients with atrial fibrillation. Eur J Intern Med. 2014;25(3):247–54.
34. Prochaska JH, Göbel S, Keller K, Coldewey M, Ullmann A, Lamparter H, et al. Quality of oral anticoagulation with phenprocoumon in regular medical care and its potential for improvement in a telemedicine-based coagulation service--results from the prospective, multi-center, observational cohort study thrombEVAL. BMC Med. 2015;13:14.
35. Baker WL, Cios DA, Sander SD, Coleman CI. Meta-analysis to assess the quality of warfarin control in atrial fibrillation patients in the United States. J Manag Care Pharm. 2009;15(3):244–52.
36. Wieloch M, Själander A, Frykman V, Rosenqvist M, Eriksson N, Svensson PJ. Anticoagulation control in Sweden: reports of time in therapeutic range, major bleeding, and thrombo-embolic complications from the national quality registry AuriculA. Eur Heart J. 2011;32(18):2282–9.
37. Tajer C, Ceresetto J, Bottaro FJ, Martí A, Casey M. Assessment of the quality of chronic anticoagulation control with time in therapeutic range in atrial fibrillation patients treated with vitamin K antagonists by hemostasis specialists: the TERRA registry: Tiempo en rango en la República Argentina. Clin Appl Thromb Hemost. 2017;23(5):445–53.
38. Kühlein T, Madlo-Thiess F, Wambach V, Schaffer S. Zehn Jahre Qualitätsmanagement: Wahrnehmung und Stellenwert aus Sicht von
Hausärzten in einem Ärztenetz. [10 years of quality management: perception and importance from GPs’point of view]. Gesundheitswesen. 2018;80(3):226–31.
39. Schaefer C, Wuillemin WA, Kessels A, Jacobson A, Nagler M. Predictors of anticoagulation quality in 15 834 patients performing patient self-management of oral anticoagulation with vitamin K antagonists in real-life practice: a survey of the international self-monitoring Association of Orally Anticoagulated Patients. Br J Haematol. 2016;175(4):677–85.
40. Apostolakis S, Sullivan RM, Olshansky B, Lip GYH. Factors affecting quality of anticoagulation control among patients with atrial fibrillation on warfarin: the SAMe-TT2R2score. Chest. 2013;144(5):1555–63.
41. Esteve-Pastor MA, Rivera-Caravaca JM, Roldán-Rabadán I, Roldán V, Muñiz J, Raña-Míguez P, et al. Quality of oral anticoagulation with vitamin K antagonists in‘real-world’patients with atrial fibrillation: a report from the prospective multicentre FANTASIIA registry. Europace. 2018;20(9):1435–41. 42. Siebenhofer A, Jeitler K, Horvath K, Habacher W, Schmidt L, Semlitsch T.
Self-management of oral anticoagulation. Dtsch Arztebl Int. 2014;111(6): 83–91.
43. Völler H, Glatz J, Taborski U, Bernardo A, Dovifat C, Heidinger K. Self-management of oral anticoagulation in nonvalvular atrial fibrillation (SMAAF study). Z Kardiol. 2005;94(3):182–6.
44. Meier DJ, Seva S, Fay WP. A comparison of anticoagulation results of patients managed with narrow vs. standard international normalized ratio target ranges. J Thromb Haemost. 2007;5(6):1332–4.
45. Zirlik A, Bode C. Vitamin K Antagonists: relative strengths and weaknesses vs. direct oral anticoagulants for stroke prevention in patients with atrial fibrillation. J Thromb Thrombolysis. 2017;43(3):365–79.
46. arznei-telegramm. Vohrhofflimmern: Neue orale Antikoagulanzien in der„realen Welt“. [Atrial fibrillation: New oral anticoagulants in the„real world“]. 2018.
Publisher’s Note