Research article
Impact of false-positive mammography on subsequent screening
attendance and risk of cancer
Jenny McCann
1, Diane Stockton
2and Sara Godward
11Cancer Intelligence Unit, Strangeways Research Laboratory, Cambridge, UK
2Scottish Cancer Surveillance Group, Information and Statistics Division, Scottish NHS, Edinburgh, UK
Correspondence: Dr Jenny McCann, Senior Research Associate, Cancer Intelligence Unit, Strangeways Research Laboratory, Wort’s Causeway, Cambridge CB1 8RN, UK. Tel: +44 1223 740272; fax: +44 1223 411609; e-mail: jenny.mccann@srl.cam.ac.uk
Introduction
Effective population-based screening requires adequate compliance among the target population [1]. The goal of
the UK breast screening programme, a 25% reduction in mortality, required first-screen compliance to be 70% [2,3]. This target was exceeded in many areas throughout
CI = confidence interval; HRT = hormone replacement therapy; OR = odds ratio.
Abstract
Background: One area of concern within the largely successful UK National Health Service breast
screening programme is the relatively high proportion of women showing mammographic abnormalities who undergo further diagnostic tests that prove negative. Previous studies suggest that, in addition to increasing anxiety, such false-positive mammography is associated with increased risk of subsequent interval cancer. In the present article, we quantify this increased risk, investigate whether it extends to cancers detected at rescreening, and determine whether cancers differ between women who have, and have not, experienced false-positive mammography.
Methods: This was a retrospective cohort study of 140,387 women aged 49–63 years routinely
invited for first screening by the East Anglian National Health Service breast screening programme. Proportions reattending, and subsequent risk and pathological attributes of cancer were compared between women who underwent further (negative) assessment following false-positive mammography and women mammographically normal at first screen.
Results:At first screen, 108,617 (91.9%) of the screened women were mammographically normal,
4278 (3.6%) were assessed and then judged normal, and 514 (0.4%) underwent benign biopsy. Compared with nonassessed normal women, reattendance was lower among assessed women: 83.1% (95% confidence interval [CI], 82.0–84.1) versus 85.7% (95% CI, 85.5–85.9) (odds ratio [OR], 0.82; 95% CI, 0.76–0.89). Assessed women were at greater risk of interval cancer (rate per 1000 women screened, 9.6 [95% CI, 6.8–12.4] versus 3.0 [95% CI, 2.7–3.4]; OR, 3.19 [95% CI, 2.34–4.35]), and also of cancer detected at second screen (rate per 1000, 8.4 [95% CI, 5.8–10.9] versus 3.9 [95% CI, 3.5–4.3]; OR, 2.15 [95% CI, 1.55–2.98]). More cancers in assessed women measured ≥20 mm (OR, 1.59; 95% CI, 0.99–2.55).
Conclusions: Women undergoing false-positive mammography at first screen were less likely to reattend
for subsequent screens than were nonassessed women, yet they were more likely to develop interval cancers or cancers at second screen, and their cancers were larger. Factors predisposing for false-positive mammography require investigation. Women should be encouraged to continue with screening.
Keywords:breast screening, false-positive mammography, interval cancer, screen-detected cancer, screening attendance
Received: 28 March 2002 Revisions requested: 17 May 2002 Revisions received: 4 June 2002 Accepted: 12 June 2002 Published: 17 July 2002
Breast Cancer Res2002, 4:R11
This article may contain supplementary data which can only be found online at http://breast-cancer-research.com/content/4/3/R3
the UK [4]. Another key prerequisite to maintaining a suc-cessful screening programme is acceptability, and the ≥90% reattendance rate among previous screenees indi-cated high acceptability in UK women [4].
Despite meeting most of the targets set, however, breast screening in the UK has not been an unmitigated success story. When screening was introduced there were reports of increased anxiety among the large numbers of women undergoing assessment following positive screening mammography [5]. Although most women do not show abnormalities on their screening mammograms and are simply asked to return for rescreening in 3 years, the mammograms of 5–9% of all women indicate possible malignancy. These women must undergo a second ‘assessment’ phase of the screening process, which involves further procedures such as ultrasound, needle biopsy and, possibly, open biopsy to establish a definitive diagnosis. As expected, malignancy is ruled out for the majority of women assessed, indicating that the result of their mammography was falsely positive. In the current study, the term ‘false positive’ is thus applied to any woman who is recalled for assessment on the basis of mammographic findings and in whom cancer is not diag-nosed. Other studies may limit use of the term only to those women who have undergone open biopsy with no resultant diagnosis of cancer.
Although some studies have indicated that false-positive mammography does not deter women from reattending [6–8], it clearly has associated financial and psychological costs. Furthermore, ourselves [9] and other workers [10] have found that women judged false positive at first screen are more likely to develop an interval cancer before the second screening is due. To assess the impact of false-positive mammography on screening effectiveness, we investigate whether false-positive mammography affects subsequent reattendance in East Anglia. We quan-tify the magnitude of the increased risk of interval cancer, and extend these investigations to determine whether false-positive mammography at first screen increases the risk of cancer detected at second screen. Finally, we compare the pathology of cancers presenting in women who have undergone false-positive mammography with that of cancers in women judged normal at the preceding screening.
Methods
Screening was introduced in East Anglia over the period 1989–1991. Women were invited by year of birth, in 5-year age groups [11]. The first round of screening occurred in 1989–1995, and the second occurred 3 years later (1992–1998). All women invited to the first round, and eligible for reinvitation to the second, were identified on the breast screening computer system. The majority was aged 50–62 years. Those aged 63–64 years were
beyond the invited age range at the time of the second screen and were excluded. We only included women invited on schedule (i.e. within 24 months of commencing invitation of the relevant birth cohort) in order to exclude women who failed to respond at first invitation but who attended for the first time on reinvitation 3 years later [12].
Women were followed up from the date of first invitation until invitation to the second screening if within 3.5 years (i.e. 1277 days), or for the mean interscreen interval for the screening unit if no screen occurred within this time (mean ± standard error interscreen interval for all regional screening units, 1106 ± 7.6 days). Interval and screen-detected cancers were identified by matching screening unit and Cancer Registry databases as described previ-ously [12]. Women not attending within 6 months of the first invitation were deemed to have refused screening. With the exception of women attending for the first invita-tion within 6 months but placed on early recall, only those women whose second screening episode (either accepted or refused) was completed within 3.5 years of the first invitation are considered in the present analysis.
Information on prognostic characteristics size (maximum diameter of invasive component), grade [13], node status and histological subtype [14] was obtained from the Cancer Registry, from screening units and from medical records. Cancers were assigned a prognostic risk group [9], based on histological type and malignancy grade [15–17]. Differences in distribution of these attributes, and of the risk of cancer, among study groups were expressed as ORs [18].
Study groups
Table 1 presents the relationship of the study groups to the total population of 203,194 women eligible for invita-tion to the first screening round. Of these women, 140,387 (69.1%) were identified as first-round invitees who were invited within schedule and were eligible for reinvitation to rescreening.
nonassessed normal, assessed normal and assessed benign study groups, comprising 80.8% of all women who were invited for a routine first screen within schedule and were eligible for reinvitation to the second round.
The mean ± standard deviation age of women was similar in all study groups: 56.0 ± 3.5 years in the entire invited cohort eligible for reinvitation, 55.8 ± 3.5 years in the nonassessed normal group, 56.1 ± 3.5 years in the assessed normal group, and 56.4 ± 3.6 years in the assessed benign group.
Of the 6337 women assessed immediately following the first screen, 680 were initially diagnosed with cancer. A further 11 women were diagnosed following initial nonat-tendance at assessment, and 22 at early recall. This pro-duced a total of 713 women. Of the 680 women diagnosed at initial assessment, 676 were registered at the Cancer Registry. The remaining four women were either recurrences of earlier breast primaries or other malignancies not classified as primary breast cancer (e.g. cytosarcoma phyllodes) [19,20].
Results
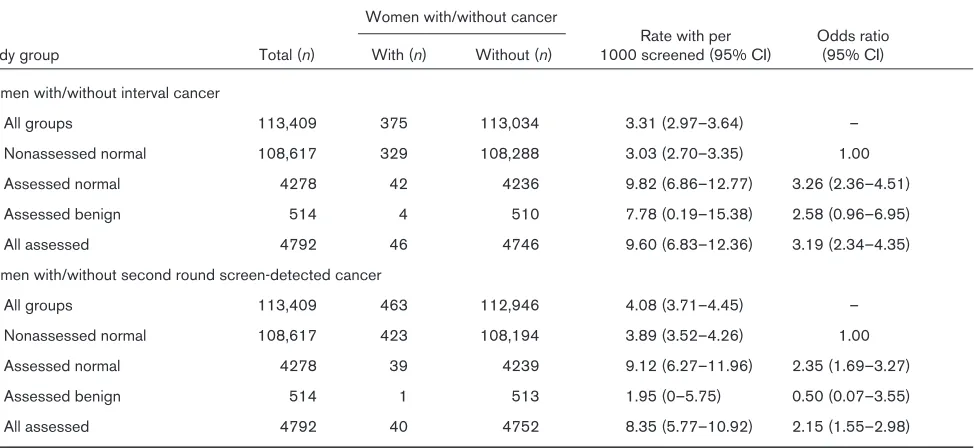
Numbers of cases, rates per 1000 screened, and odds of presenting with interval cancer or having a cancer detected at second screen are presented by study group in Table 2. In all study groups combined, 375 interval cancers presented and 463 cancers were detected at second screen. The risk of subsequent interval cancer, or
cancer detected at second screen, was higher in women assessed at the preceding screen. The OR among all assessed women for an interval cancer arising was 3.19 (95% CI, 2.34–4.35) compared with the nonassessed normal group, and that for detecting a cancer at second screen was 2.15 (95% CI, 1.55–2.98). Compared with the nonassessed normal group, the OR of a second round screen-detected cancer in the assessed benign group was lower, but the difference was not significant, possibly due to the small size of the assessed benign group (OR, 0.50; 95% CI, 0.07–3.55).
[image:3.612.56.559.118.365.2]Numbers and proportions of women with appointments for, and attending, the second screen are presented, by study group and interval cancer status, in Table 3, which also presents the ORs for the likelihood of recorded appointments and reattendance. Explanations for a lack of recorded reinvitation appointment include deletion of appointments cancelled in advance, and removal of women from the invitation list following moving house, bilateral mastectomy or death. Overall, 90.6% of women had recorded appointments for a second screen within 3.5 years, and 85.6% reattended. Compared with the nonassessed normal group, the proportion with recorded appointments was slightly lower among the assessed normal group (OR, 0.78; 95% CI, 0.71–0.86) and was lower still among the assessed benign group (OR, 0.51; 95% CI, 0.41–0.65) (see Table 3). Reattendance was similarly slightly lower among women in the assessed normal group (OR, 0.84; 95% CI, 0.78–0.92) compared
Table 1
Relationship of study groups to total population of women eligible for and invited to the first screening round in East Anglia
Group Number Percent
All women eligible for screening in the first round 203,194 100.0
Those not aged 49–63 years and hence ineligible for reinvitation to the second round 337,668 16.6
Those not invited as routine first screen 7272 3.6
Those not invited within schedule (see Methods) 21,769 10.7
Those eligible for reinvitation, invited as routine first screen, within schedule 140,387 69.1
Those eligible for reinvitation, invited as routine first screen, within schedule 140,387 100.0
Those judged normal at first screen (nonassessed normal group)a 108,617 77.4
Nonresponders to first invitation 24,048 17.0
Technical (and clinical) recalls 1385 1.0
Those assessed immediately after first screen and judged normal (assessed normal group)a 4278 3.0
Those assessed immediately after first screen then undergoing benign biopsy (assessed benign group)a 514 0.4
Those assessed immediately after first screen then diagnosed with cancer 680 0.5
Those assessed immediately after first screen and put on early recall 753 0.5
Those assessed immediately after first screen then undergoing delayed episode completion
(includes nonresponders, delayed responders, those who moved or died, etc.) 112 0.1
with the nonassessed normal group, and was lower still among the assessed benign group (OR, 0.65; 95% CI, 0.52–0.81). Reattendance among women with recorded reinvitation appointments was similar in all groups (94–95%, calculated from data in Table 3).
Reattendance was much lower among women presenting with interval cancer following the first screen. Combining assessed and nonassessed women, 90.8% of women without interval cancer had reinvitation appointments recorded, and 85.8% actually reattended, whereas only 27.2% of women with interval cancer had reinvitation appointments, and 19.2% reattended (see Table 3). Among the 680 women diagnosed with cancer immedi-ately following first screen, similarly low proportions with reinvitation appointments (250 of 680 women [36.8%]) and reattending (224 of 680 women [32.9%]) were observed (data not shown).
The effects of the study group on pathological attributes of interval cancers and second round screen-detected cancers are presented in Table 4. Interval cancers and cancers detected at second screen in assessed women were larger compared with cancers in nonassessed women, with more measuring at least 20 mm (OR, 1.59; 95% CI, 0.99–2.55). This effect reached statistical signifi-cance in the assessed normal group (OR, 1.63; 95% CI, 1.01–2.64). There were no significant differences between assessed and nonassessed women in risk of high grade (grade 3) cancers. Compared with the nonassessed normal group, there were some indications
of fewer high grade interval cancers among those assessed (OR, 0.47; 95% CI, 0.17–1.28), but this was not statistically significant. Cancers detected at second screen in women who were assessed at first screen showed some indication of increased risk of positive nodes (OR, 1.51; 95% CI, 0.67–3.39). There was a non-significant increase in numbers of advanced stage (stage 2+) interval and second round screen-detected cancers in assessed women (OR, 1.32; 95% CI, 0.83–2.11). Interval cancers in the assessed normal group showed a slightly increased tendency to present in the left breast (OR, 1.51; 95% CI, 0.77–2.95). For interval cancers, the likelihood of a cancer being of high prognostic risk (group 3) was sig-nificantly lower in the assessed normal group than in the nonassessed group (OR, 0.34; 95% CI, 0.12–0.99).
Discussion
False-positive mammography is a relatively frequent occur-rence within breast screening programmes. It was calcu-lated that, during 10 years in New England, USA, one-third of women screened by mammography and clinical exami-nation underwent false-positive screening [21]. Last year in the UK there were around 11 unnecessary recalls for every cancer detected within the National Health Service breast screening programme (8.3% of women assessed at first screen, 6.7 cancers detected per 1000 screened; 7.6% false-positive at first mammography) [4]. This figure fell to around six recalls for every cancer detected at repeat screening (3.9% of women assessed, 5.5 cancers detected per 1000 screened; 3.4% false-positive at subse-quent mammography) [4]. For a woman attending all five
Likelihood of presentation of interval cancer following an initial screen, and of detection of cancer by screening at the second screening round, by assessment status
Women with/without cancer
Rate with per Odds ratio Study group Total (n) With (n) Without (n) 1000 screened (95% CI) (95% CI)
Women with/without interval cancer
All groups 113,409 375 113,034 3.31 (2.97–3.64) –
Nonassessed normal 108,617 329 108,288 3.03 (2.70–3.35) 1.00
Assessed normal 4278 42 4236 9.82 (6.86–12.77) 3.26 (2.36–4.51)
Assessed benign 514 4 510 7.78 (0.19–15.38) 2.58 (0.96–6.95)
All assessed 4792 46 4746 9.60 (6.83–12.36) 3.19 (2.34–4.35)
Women with/without second round screen-detected cancer
All groups 113,409 463 112,946 4.08 (3.71–4.45) –
Nonassessed normal 108,617 423 108,194 3.89 (3.52–4.26) 1.00
Assessed normal 4278 39 4239 9.12 (6.27–11.96) 2.35 (1.69–3.27)
Assessed benign 514 1 513 1.95 (0–5.75) 0.50 (0.07–3.55)
[image:4.612.69.556.131.355.2]screens to which she is currently invited, assuming the result of each screening is independent of any previous result, her cumulative probability of at least one false-positive screening is therefore around 19% {1 – (P[No. false positives on first screen] × P [No. false positives on subsequent screen]4)},
i.e. {1 – ([1 – 0.0763] × [1 – 0.0335]4)}.
[image:5.612.61.556.131.636.2]In East Anglia, 4.1% of women screened in the first screening round and eligible for a second screen under-went false-positive mammography at first screen. These women were more than three times as likely as nonassessed normal women to present with an interval cancer before the second screen was due, and more than
Table 3
Numbers and proportions of cases of interval cancer and second round screen-detected cancer, and likelihood of presentation, by study group and interval cancer status
Reinvited Reattending
Women (n) Women (n)
Total % Yes Odds ratioa % Yes Odds ratioa
Study group (100%) Yes No (95% CI) (95% CI) Yes No (95% CI) (95% CI)
All groups
All 113,409 102,772 10,637 90.6 97,062 16,347 85.6
(90.5–90.8) (85.4–85.8)
With interval cancer 375 102 273 27.2 72 303 19.2
(22.7–31.7) (15.2–23.2)
Without interval cancer 113,034 102,670 10,364 90.8 96,990 16,044 85.8
(90.7–91.0) (85.6–86.0)
Nonassessed normal
All 108,617 98,561 10,056 90.7 1.00 93,081 15,536 85.7 1.00
(90.6–90.9) (85.5–85.9)
With interval cancer 329 97 232 29.5 69 260 21.0
(24.6–34.4) (16.6–25.4)
Without interval cancer 108,288 98,464 9824 90.9 93,012 9824 85.9
(90.8–91.1) (85.7–86.1)
Assessed normal
All 4278 3782 496 88.4 0.78 3572 706 83.5 0.84
(87.4–89.4) (0.71–0.86) (82.4–84.6) (0.78–0.92)
With interval cancer 42 5 37 11.9 3 39 7.1
(2.1–21.7) (0–14.9)
Without interval cancer 4236 3777 459 89.2 3569 667 84.3
(88.2–90.1) (83.2–85.4)
Assessed benign
All 514 429 85 83.5 0.51 409 105 79.6 0.65
(80.3–86.7) (0.41–0.65) (76.1–83.1) (0.52–0.81)
With interval cancer 4 0 4 0 0 4 0
Without interval cancer 510 429 81 84.1 409 101 80.2
(81.0–87.3) (76.7–83.7)
All assessed
All 4792 4211 581 87.9 0.74 3981 811 83.1 0.82
(87.0–88.8) (0.68–0.81) (82.0–84.1) (0.76–0.89)
With interval cancer 46 5 41 10.9 3 43 6.5
(1.9–19.9) (0–13.7)
Without interval cancer 4746 4206 540 88.6 3978 768 83.8
(87.7–89.5) (82.8–84.9)
Table 4 Effect of study group on pathological attributes of interval cancers and second round screen-detected cancers Size (mm) Grade Node status Stage Laterality
Tumour risk group
Odds Odds Odds Odds Odds Odds 20+ < 20 ratio a 3 1+2 ratio b +ve –ve ratio c 2+ 1 ratio d Left Right ratio e 3
1 + 2
ratio f Interval cancer Nonassessed 160 124 1.00 72 148 1.00 101 133 1.00 179 131 1.00 139 162 1.00 75 216 1.00 Assessed normal 26 14 1.44 5 2 2 0.47 13 18 0.95 25 15 1.22 22 17 1.51 4 3 4 0.34 (0.72–2.87) (0.17–1.28) (0.45–2.03) (0.62–2.40) (0.77–2.95) (0.12–0.99) Assessed benign 1 1 0.78 1 0 – 1 2 0.66 1 2 0.37 2 2 1.17 2 2 2.88 (0.05–12.51) (0.06–7.36) (0.03–4.08) (0.16–8.38) (0.40–20.81) All assessed 27 15 1.40 6 2 2 0.56 14 20 0.92 26 17 1.12 24 19 1.47 6 3 6 0.48 (0.71–2.74) (0.22–1.44) (0.44–1.91) (0.58–2.15) (0.77–2.80) (0.19–1.18)
Second screen cancer
Nonassessed 78 275 1.00 57 256 1.00 72 206 1.00 104 253 1.00 180 172 1.00 54 294 1.00 Assessed normal 11 24 1.62 5 2 3 0.98 10 19 1.51 13 22 1.44 16 16 0.96 4 3 0 0.73 (0.76–3.44) (0.36–2.68) (0.67–3.39) (0.70–2.96) (0.46–1.97) (0.25–2.14) Assessed benign 0 1 – 0 1 – 0 1 – 0 1 – 0 1 – 0 1 – All assessed 11 25 1.55 5 2 4 0.94 10 20 1.43 13 23 1.37 16 17 0.90 4 3 1 0.70 (0.73–3.29) (0.34–2.56) (0.64–3.20) (0.67–2.82) (0.44–1.84) (0.24–2.07) All cancers Nonassessed 238 399 1.00 129 404 1.00 173 339 1.00 283 384 1.00 319 334 1.00 129 510 1.00 Assessed normal 37 38 1.63 10 45 0.70 23 37 1.22 38 37 1.39 38 33 1.21 8 6 4 0.49 (1.01–2.64) (0.34–1.42) (0.70–2.11) (0.86–2.25) (0.74–1.97) (0.23–1.06) Assessed benign 1 2 0.84 1 2 1.57 1 3 0.65 1 3 0.45 2 3 0.70 2 3 2.64 (0.08–9.29) (0.14–17.41) (0.07–6.33) (0.05–4.37) (0.12–4.21) (0.44–15.94) All assessed 38 40 1.59 11 47 0.73 24 40 1.18 39 40 1.32 40 36 1.16 10 67 0.59 (0.99–2.55) (0.37–1.46) (0.69–2.01) (0.83–2.11) (0.72–1.87) (0.30–1.18)
aOdds ratio of cancer measuring 20 mm and above versus < 20 mm. bOdds ratio of cancer of grade 3 versus grades 1 or 2. cOdds ratio of node positive cancer versus node negative.
twice as likely to have a cancer detected at second screening. If the followup period of the current study had been extended beyond the interscreen interval, these women might have continued to show increased risk of cancer beyond the due date for second screen. The rate in lapsed attenders who were false positive at first screen is thus also likely to have been high.
For women who undergo false-positive mammography and then present with cancer, the validity of the negative assessment comes into question. Among women in the current study, 12.3% of those presenting with interval cancer after the first screen, and 8.6% of those with cancer detected at second screen, had previously been assessed compared with the 4.2% of women assessed of those not diagnosed with cancer. A review of the origi-nal screening films of women with interval cancers has shown that around one-fifth of all East Anglian cases might potentially be prevented through earlier diagnosis at the previous screening [9]. However, quantification of the extent to which failure of diagnosis at assessment has contributed to the interval cancer rate requires detailed comparison of the site and nature of relevant lesions at assessment and diagnosis, which was beyond the scope of the current study.
Another possible explanation for the increased risk of cancer in women following false-positive mammography might be that a characteristic of women’s breasts which makes them difficult to interpret mammographically and predisposes them to the risk of a false-positive result is actually itself a risk factor for breast cancer. Such a link between risk of false-positive mammography and risk of cancer might be hormone replacement therapy (HRT). Laya
et al. in 1996 [22], and others since [23], demonstrated
that current use of HRT by women aged 50+ years is asso-ciated both with decreased screening sensitivity (increased interval cancers) and decreased specificity (increased false positives). Furthermore, long-term use of HRT has been shown to increase breast cancer risk [24]. It has been proposed that these effects of HRT are medi-ated through high risk (i.e. dense) mammographic patterns [25], which themselves have been shown to be associ-ated both with reduced screening specificity [22,26,27] and with increased risk of breast cancer [28,29]. Unfortu-nately, information on HRT use among women in the current study was not available to test this hypothesis. If found relevant, however, consideration of a woman’s indi-vidual risk profile might prove helpful in deciding a strategy for subsequent rescreening.
In addition to being at increased risk of cancer, women who experienced false-positive mammography were 18% less likely than those who were genuinely screen normal to reattend for a second screening. Women who underwent benign biopsy were even less likely (35%) to return. This
finding was in contrast with reports from previous studies when false-positive mammography either had no effect on subsequent attendance [6–8] or, alternatively, actually increased by 20% the likelihood of future reattendance [30], even in those who underwent a negative biopsy [31]. As previously suggested [7,32], however, regional varia-tions in handling of assessment procedures and false-posi-tive cases may explain differences in uptake of screening reinvitations. Such findings suggest that the figures may be amenable to improvement through a change in practice.
The reduced reattendance among women with false-posi-tive mammography was accompanied by a reduced likeli-hood of reinvitation appointments recorded on the screening computer system. Followup of the 85 assessed benign women who did not have reinvitation appointments recorded on the computer system (Table 2) revealed that at least 35 of them (41%) had been offered reinvitation appointments, which they had cancelled in advance. The reduced reattendance among assessed women would not have been apparent had the analysis investigated the pro-portions of women with recorded reinvitation
appoint-ments who returned, since reattendance among those
with recorded reinvitation appointments was similarly high in all women (around 94%), regardless of assessment history. Furthermore, such analysis would have failed to reveal the correct magnitude of the increased risk of cancer among women undergoing false-positive mammo-graphy, since the OR for an interval cancer arising in all assessed women versus that in nonassessed women was 3.19 (95% CI, 2.34–4.35). This OR fell to 1.21 (95% CI, 0.49–2.97) when only those women with recorded re-invitation appointments within 3.5 years were considered (data not shown). Regardless of whether the lack of recorded reinvitation appointments is due to an active choice on the part of women not to attend or due to a failure of the system to reinvite them, the fact that they are not being rescreened yet they are at increased risk of cancer is clearly of great concern.
For women who experienced false-positive mammography and then presented with an interval or screen-detected cancer, the current study indicated that these cancers were more likely to measure 20+ mm and to be of a higher stage than those in nonassessed women, and second screen-detected cancers were more likely to be node pos-itive. This indicates a poorer prognosis for women who presented with cancer having undergone false-positive mammography, although when assessed by histological subtype and grade such cancers were apparently of lower prognostic risk than those in nonassessed women. The reasons for this inconsistency are unclear.
The current findings relate to women assessed at first screen within the East Anglia screening programme, carried out over the period 1989–1995. With technical improvements to the programme and women’s increased familiarity with it, reduced reattendance and increased risk of cancer may be less associated with false-positive mam-mography at first screen. Furthermore, the impact of false-positive mammography may be lower after a second or subsequent screening. Fewer women are assessed at second and subsequent screens [37,38], possibly due to the increase in specificity associated with the availability of previous films for comparison [39]. Finally, it should be noted that, while there was increased risk of subsequent cancer associated with women assessed at first screen, such women contributed only a modest proportion of all interval and second round screen-detected cancers.
Conclusions
False-positive mammography in the first screening round in East Anglia was associated both with increased risk of interval cancers and cancer detected at second screen-ing, and with reduced reattendance at subsequent screens. If these associations persist within the screening programme, then efforts must be made to identify the factors predisposing certain women to false-positive mam-mography, to encourage continued participation, and to detect any subsequent cancers at the earliest possible opportunity.
Acknowledgements
JM was funded by a grant from the National Health Service Executive of the Eastern Region Office. The authors wish to thank directors and staff at the region’s seven screening units, three health authorities, and the East Anglian Cancer Registry for their cooperation and support in providing data. The authors also thank Peter Treasure for useful discus-sions, and Neil Walker for writing the computer matching program.
References
1. Day NE, Williams DRR, Khaw KT: Breast cancer screening pro-grammes: the development of a monitoring and evaluation system.Br J Cancer 1989, 59:954-958.
2. Forrest P: Breast Cancer Screening.London: HMSO; 1986. 3. Secretary of State for Health: The Health of the Nation. A
Strat-egy for Health in England.London: HMSO; 1992.
4. Lancucki L (Ed): Statistical Bulletin 2001/10; Breast Screening Programme, England: 2000–2001. London: Department of Health; 2002.
logical consequences one month after placing women on early recall because of a diagnostic uncertainty. A multicentre study.J Med Screen 1997, 4:158-168.
6. Meldrun P, Turnbull D, Dobson HM, Colquhoun C, Harper Gilmour W, McIlwaine GM: Tailored written invitations for a second round breast screening: a randomised controlled trial. J Med Screen 1994, 1:245-258.
7. Orton M, Fitzpatrick F, Fuller A, Mant D, Mlynek C, Thorogood M: Factors affecting women’s response to an invitation to attend for a second breast screening examination. Br J Gen Pract 1991, 41:320-323.
8. O’Sullivan I, Sutton S, Dixon S, Perry N: False positive results do not have a negative effect on reattendance for subsequent breast screening.J Med Screen 2001, 8:145-148.
9. McCann J, Britton P, Warren RML, Hunnam G: Radiological peer review of interval cancers in the East Anglian Breast Screening Programme: what are we missing?J Med Screen 2001, 8:77-85. 10. Everington D, Gilbert FJ, Tyack C, Warner J: The Scottish Breast
Screening Programme’s experience of monitoring interval cancers.J Med Screen 1999, 6:21-27.
11. McCann J, Stockton D, Day NE: Breast cancer in East Anglia: the impact of the breast screening programme on stage at diagnosis.J Med Screen1998, 5:42-48.
12. McCann J, Duffy S, Day NE: Predicted long term mortality reduction associated with the second round of breast screen-ing in East Anglia.Br J Cancer 2001, 84:423-428.
13. World Health Organisation: International Statistical Classification of Diseases and Related Health Problems — Oncology, 2nd revi-sion. Geneva: World Health Organisation; 1990.
14. World Health Organisation: International Statistical Classification of Diseases and Related Health Problems, 10th revision. Geneva: World Health Organisation; 1992.
15. Ellis EO, Galea M, Broughton N, Locker A, Blamey RW, Elston CW: Pathological prognostic factors in breast cancer II. Histo-logical type. Relationship with survival in a large study with long follow up.Histopathology 1992, 20:479-489.
16. Northridge ME, Rhoads GG, Wartenberg D, Koffman D: The importance of histologic type on breast cancer survival.J Clin Epidemiol 1997, 50:283-290.
17. Tabar L, Duffy S, Chen HH, Vitak B, Prevost T: The natural history of breast carcinoma. What have we learned from screening? Cancer 1999, 86:449-462.
18. McCullagh P, Nelder JA: Generalised Linear Models, 2nd edition. London: Chapman & Hall; 1989.
19. Ainsworth A, Gravestock S, Linklater L, Page M: Information and Training Manual for Cancer Registration in England and Wales. London: UK Association of Cancer Registries Consultative Group; 1993.
20. Hermanek P, Sobin LH (Eds): UICC International Union against Cancer: TNM Classification of Malignant Tumours, 5th edition. Berlin: Springer-Verlag; 1997.
21. Elmore JG, Barton MB, Moceri VM, Polk S, Arena PJ, Fletcher SW: Ten-year risk of false positive screening mammograms and clinical breast examinations. N Engl J Med 1998, 338: 1089-1096.
22. Laya MB, Larson EB, Taplin SH, White E: Effect of oestrogen replacement therapy on the specificity and sensitivity of screening mammography.J Natl Cancer Inst 1996, 88:643-649 23. Banks E: Hormone replacement therapy and the sensitivity and specificity of breast cancer screening: a review. J Med Screen2001, 8:29-35.
24. Collaborative Group on Hormonal Factors in Breast Cancer: Breast cancer and hormone replacement therapy: collabora-tive reanalysis of data from 51 epidemiological studies of 52 705 women with breast cancer and 108 411 women without breast cancer. Lancet 1997, 350:1047-1059.
25. Sala E, Warren JL, McCann J, Duffy S, Luben R, Day NE: High risk mammographic parenchymal patterns, hormone replace-ment therapy and other risk factors: a case control study.Int J Epidemiol2000, 29:629-636.
26. Lehman CD, White E, Peacock S, Drucker MJ, Urban N: Effect of age and breast density on screening mammograms with false positive findings.Am J Roentgenol 1999, 173:1651-1655. 27. Kavanagh AM, Mitchell H, Giles GG: Hormone replacement
28. Wolfe JN: Breast patterns as an index of risk for developing breast cancer.Am J Roentgenol 1976, 126:1130-1139. 29. Sala E, Solomon L, Warren RML, McCann J, Duffy S, Luben R,
Day NE: Size, node status and grade of breast tumours: asso-ciation with mammographic parenchymal pattern. Eur Radiol 2000, 10:157-161.
30. Burman ML, Taplin S, Herta DF, Elmore JG: Effect of false posi-tive mammograms on interval breast cancer screening in a health maintenance organisation.Ann Intern Med 1999, 131 :1-6.
31. Pisano ED, Earp JA, Gallant TL: Screening mammography behaviour after a false positive mammogram.Cancer Detect Prev 1998, 22:161-167.
32. Sutton S, Saidi G, Bickler G, Hunter J: Does routine screening for breast cancer raise anxiety? Results from a three wave prospective study in England.J Epidemiol Community Health 1995, 49:413-418.
33. Cockburn J, Staples M, Hurley SF, De Luise T: Psychological consequences of screening mammography. J Med Screen 1994, 1:7-12.
34. Olsson P, Armelius K, Nordahl G, Lenner P, Westman G: Women with false positive screening mammograms — how do they cope? J Med Screen 1999, 6:89-93.
35. Lidbrink E, Elfving J, Frisell J, Jonsson E: Neglected aspects of false positive findings of mammography in breast cancer screening: analysis of false positive cases from the Stock-holm trial. BMJ 1996, 312:273-276.
36. Fletcher S: False positive screening mammograms: good news, but more to do. Ann Intern Med 1999, 131:60-62. 37. NHS Breast Screening Programme: Guidelines on Quality
Assur-ance Visits, publication number 40. Sheffield: NHS Breast Screening Programme; 1998.
38. NHS Breast Screening Programme: NHS Breast Screening Pro-gramme Review 1999. Sheffield: NHS Breast Screening Pro-gramme; 2000.