This is a repository copy of Late Holocene paleohydrology of Walker Lake and the Carson Sink in the western Great Basin, Nevada, USA.
White Rose Research Online URL for this paper: http://eprints.whiterose.ac.uk/145779/
Version: Accepted Version
Article:
Adams, K.D. and Rhodes, E.J. orcid.org/0000-0002-0361-8637 (2019) Late Holocene paleohydrology of Walker Lake and the Carson Sink in the western Great Basin, Nevada, USA. Quaternary Research. ISSN 0033-5894
https://doi.org/10.1017/qua.2018.151
This article has been published in a revised form in Quaternary Research
[http://doi.org/10.1017/qua.2018.151]. This version is free to view and download for private research and study only. Not for re-distribution, re-sale or use in derivative works. © University of Washington.
eprints@whiterose.ac.uk https://eprints.whiterose.ac.uk/
Reuse
Items deposited in White Rose Research Online are protected by copyright, with all rights reserved unless indicated otherwise. They may be downloaded and/or printed for private study, or other acts as permitted by national copyright laws. The publisher or other rights holders may allow further reproduction and re-use of the full text version. This is indicated by the licence information on the White Rose Research Online record for the item.
Takedown
If you consider content in White Rose Research Online to be in breach of UK law, please notify us by
1
Late Holocene paleohydrology of Walker Lake and the Carson Sink in the western Great 1
Basin, Nevada, USA 2
3
Kenneth D. Adams* 4
Desert Research Institute 5
2215 Raggio Parkway 6
Reno, NV 89512 7
USA 8
(775) 673-7345 9
kadams@dri.edu
10
11
Edward J. Rhodes 12
Department of Geography 13
University of Sheffield, 14
Sheffield, S10 2TN 15
United Kingdom 16
17
18
19
*Corresponding author 20
2
ABSTRACT
22
The late Holocene histories of Walker Lake and the Carson Sink were reconstructed by 23
synthesizing existing data in both basins along with new age constraints from key sites, 24
supplemented with paleohydrologic modeling. The repeated diversions of the Walker 25
River to the Carson Sink and then back to Walker Lake caused Walker Lake-level 26
fluctuations spanning 50 + m. Low lake levels at about 1000, 750, and 300 cal yr BP are 27
time correlative to the ages of fluvial deposits along the Walker River paleochannel, 28
when flow was directed toward the Carson Sink. The timing and duration of large lakes 29
in the Carson Sink was further refined using moisture-sensitive tree ring chronologies. 30
The largest lakes required a 4 – 5-fold increase in discharge spanning decades. Addition 31
of Walker River flow to the Carson Sink by itself is inadequate to account for the 32
required discharge. Instead, increases in the runoff coefficient and larger areas of the 33
drainage basin contributing surface runoff may explain the enhanced discharge required 34
to create these large lakes. 35
36
Keywords: Lake Lahontan, Walker Lake, Carson Sink, Holocene, paleohydrologic
37
modeling 38
39
INTRODUCTION
40
Paleohydrologic records from Great Basin pluvial lakes provide a rich source of 41
information enhancing understanding of the character, magnitudes, and rates of past 42
climatic changes (e.g., Smith and Street-Perrot, 1983; Benson and Thompson, 1987a; 43
3
evaporated by the end of the Pleistocene, a few small lakes remained that were fed by 45
perennial rivers sourced in high mountains. These extant lakes have continued to record 46
climatic perturbations through the Holocene by altering their depths, surface areas, and 47
volumes according to the water balance of their watersheds. 48
This paper focuses on the late Holocene histories of Walker Lake and the Carson Sink 49
in western Nevada. These lakes were integrated when Lake Lahontan was at high levels 50
during the late Pleistocene but separated during early Holocene desiccation. Throughout 51
the Holocene, however, their histories remained linked by the unusual behavior of the 52
Walker River, which periodically switched course from one terminal basin to the other 53
(Russell, 1885; Benson and Thompson, 1987a, b; Benson et al., 1991; King, 1993, 1996; 54
Adams, 2003, 2007). Lake-level changes in these basins therefore not only reflect climate 55
changes but also the wandering behavior of the Walker River. Here, new data and 56
interpretations on Holocene lake-level fluctuations at Carson Sink and Walker Lake 57
augment records developed in Benson et al. (1991), Adams (2003, 2007), Bell et al. 58
(2010), and Bell and House (2010). Together with new stratigraphy indicating timing of 59
river diversions, these data refine the climatic and physiographic controls on lake-level 60
history. 61
The lake-level and river-flow records are then analyzed, with respect to the historical 62
hydrology of these systems, in terms of the timing, rates, magnitudes, and areas of 63
hydrologic change during the late Holocene. In particular, the moisture-sensitive gridded 64
tree ring database contained within the Living Blended Drought Atlas (Cook et al., 2010) 65
assists in the characterization of the duration, magnitude, and geographical extent of wet 66
4
shoreline ages, and, by simple paleohydrologic modeling, estimates of the rates and 68
magnitudes of past lake-level changes. 69
70
REGIONAL SETTING AND HYDROLOGY
71
The Carson Sink and Walker Lake represent adjacent subbasins of the pluvial Lake 72
Lahontan system in western Nevada. These lakes were part of a single waterbody only 73
when levels were above about 1310 m (King, 1993), which is close to the late Pleistocene 74
highstand elevation (~1332 m) in the area (Adams et al., 1999). Currently, Walker Lake 75
is fed by a drainage basin extending over about 10,200 km2, with the West Walker and
76
East Walker rivers being the major tributaries that join together to form the Walker River 77
at the south end of Mason Valley before flowing north and then turning south toward 78
Walker Lake (Figs. 1 and 2). 79
Cumulative mean annual discharge for both branches of the Walker River during the 80
historical period (1926 – 2017) is about 0.38 km3/yr, with flows during the wettest years
81
ranging up to about 1 km3/yr (Table 1). According to the Parameter-elevation 82
Regressions on Independent Slopes Model (PRISM) (Daly et al., 2008), the highest parts 83
of the drainage basin along the Sierran crest receives from 100 to 170 cm/yr of mean 84
annual precipitation, most of which accumulates in the winter as snow (Fig. 1). In 85
contrast, precipitation at Walker Lake ranges from about 12 to 20 cm/yr (Fig. 1) (Daly et 86
al., 2008). 87
Harding (1965) and Milne (1987) estimated that the mean annual lake evaporation 88
rate for Walker Lake is about 125 cm/yr. Allander et al. (2009) measured evaporation 89
5
actual annual lake evaporation rate was about 152 cm/yr. Allander et al. (2009) attributed 91
the difference between these two values to be due to previously unaccounted groundwater 92
inflow, based on a water budget approach. 93
At its historical highstand in 1868, Walker Lake reached an elevation of about 1252 94
m, had a surface area of about 300 km2, and a volume of about 13 km3 (Adams, 2007; 95
Lopes and Smith, 2007). Because of drought and upstream water diversions and 96
consumption, the lake-surface elevation had dropped to about 1191 m at the start of the 97
2017 water year, corresponding to a surface area of about 109 km2 and volume of about 98
1.2 km3. Due to the unusually deep snowpack of the 2016-17 winter in its headwaters,
99
runoff down the Walker River had raised the level of the lake by just over 3 meters by the 100
start of the 2018 water year. 101
The Carson and Humboldt sinks (herein shortened to the Carson Sink) occupy the 102
lowest part of a drainage basin that encompasses about 54,000 km2 and is primarily fed 103
by the Carson River from the west and the much larger Humboldt River drainage basin 104
from the east (Figs. 1 and 2). The Carson River also derives most of its flow from near 105
the Sierran crest where precipitation is about 100 to 140 cm/yr (Daly et al., 2008). As the 106
Carson River enters the basin near Fallon, NV, it splits into a series of distributaries that 107
alternately direct flow either to the Carson Sink (aka North Carson Lake), or east to 108
Stillwater Marsh, or southeast to Carson Lake (Fig. 2). Since the mid-19th century most of
109
the flow has been directed toward Carson Lake (Morrison, 1964), which has a surface 110
area of ~ 150 km2 and volume of ~ 0.4 km3 when it is overflowing north through the 111
6
historic highstand in the Carson Sink occurred in 1862 when lake level reached 1185.7 m, 113
corresponding to an area of 1300 km2 and volume of 5.7 km3 (Fig. 2). 114
Much of the flow in the Humboldt River is derived from the Ruby Mountains where 115
precipitation ranges from about 80 to 110 cm/yr, also mostly snow, although significant 116
volumes of water are probably occasionally derived from the Santa Rosa, Independence, 117
Jarbidge, and Toiyabe ranges (Fig. 1). The Humboldt River typically terminates in the 118
Humboldt Sink (Fig. 2), which is separated from the rest of the Carson Sink by a valley-119
spanning beach ridge complex known as the Humboldt Bar (Russell, 1885). A narrow 120
channel cut through the lowest part of the Humboldt Bar indicates occasional flow from 121
the Humboldt Sink south to the Carson Sink. During the mid-1980s highstand in the 122
Carson Sink (1183 m; 890 km2; 2.5 km3) (Fig. 2), almost twice the volume of water came 123
down the Humboldt River as did from the Carson River even though their average annual 124
flows are very similar (Table 1). 125
126
PREVIOUS WORK
127
Morrison (1964) documented the existence of low elevation shorelines (< 1204 m) 128
rimming the Carson Sink that he grouped as part of the late Holocene Fallon Formation 129
(later renamed the Fallon Alloformation; Morrison, 1991). Davis (1978) identified the 130
Turupah Flat tephra (< 2 ka) within the Salt Wells beach barrier (~1202 m) and Adams 131
(2003) dated detrital charcoal from 5 cm beneath the tephra to 660 – 910 cal yr BP. A 132
slightly lower beach (~1198 m) was dated to 1310 -1520 cal yr BP (Adams, 2003). 133
Bell et al. (2010) and Bell and House (2010) mapped the Lahontan Mountains and 134
7
the late Pleistocene and Holocene history of the Carson Sink. In particular, they 136
documented ages and elevations of key outcrops and landforms consistent with results of 137
previous studies but add detail to the record of late Holocene lake-level fluctuations. 138
In the Walker Lake subbasin, Benson (1978) used the ages and elevations of tufa 139
samples to construct a Holocene lake-level curve, which was updated by Benson and 140
Thompson (1987a, b), Benson (1988), and Benson et al. (1991) with the addition of lake-141
level proxies from deep-water cores. Large-scale lake-level drops at about 2 ka and 1 ka 142
were attributed to temporary diversion of the Walker River out of the basin (Benson et 143
al., 1991). Bradbury et al. (1989) added to this history using biological proxies from the 144
cores. The late Holocene tufa ages of Newton and Grossman (1988) are largely in 145
agreement with the results of Bradbury et al. (1989) and Benson et al. (1991). Yuan et al. 146
(2004, 2006) collected additional cores and used fluctuations in several proxies to infer 147
hydrologic fluctuations over the last 2700 years. 148
Adams (2007) used radiocarbon ages from terrestrial plant material and charcoal 149
collected from diverse sedimentary environments including fluvial, deltaic, beach, and 150
offshore settings to refine the late Holocene curve for Walker Lake. The revised curve 151
confirmed several large-scale fluctuations over the last few thousand years (Adams, 152
2007). Because the study focused on stratigraphic sections and not shorelines, however, 153
the maximum elevations of Holocene highstands could only be estimated. Subsequent 154
geologic mapping along the lower Walker River and at Walker Lake by House and 155
Adams (2009, 2010) identified the upper limit of late Holocene beach deposits at about 156
8
Hatchett et al. (2015) used a coupled water balance and lake evaporation model along 158
with the Walker Lake-level curve of Adams (2007) to simulate the climatic conditions 159
that led to two lowstands separated by a minor highstand during the Medieval Climate 160
Anomaly (MCA). This sequence of drought-deluge-drought generally fits the pattern of 161
western U.S. hydroclimate during the MCA originally defined by Stine (1994), which 162
was in part based on the death ages of trees found within the West Walker River channel 163
near its headwaters. The timing of this sequence was refined by Cook et al. (2010). 164
Hatchett et al. (2015), however, did not consider the effect of the wandering behavior of 165
the Walker River on Walker Lake levels, which means that the lake-level fluctuations 166
that they were modeling may have had additional non-climate controls. 167
Multiple studies (e.g., Davis, 1982; King, 1993, 1996; Benson and Thompson, 168
1987a,b; Benson et al., 1991; Adams, 2007) concluded that during the Holocene the 169
Walker River was occasionally diverted from the Walker Lake subbasin to become a 170
tributary of the Carson River and Carson Sink (Fig. 2), but the timing of these diversions 171
(and returns) was unclear. During such diversions, the Carson Sink received substantial 172
additional water and Walker Lake was deprived of its only major water source. 173
King (1993, 1996) concluded that diversions of the Walker River through Adrian 174
Valley were as recent as within the last few hundred years, based on the ages of 175
Anodonta shells (300 + 60 14C yr BP) found along the paleochannel. S.J. Caskey (pers.
176
comm., 2004) determined a similar age (330 + 60 14C yr BP) from other Anodonta shells 177
along the same reach. 178
The sum of evidence from multiple studies indicates that Walker Lake has undergone 179
9
strictly due to climate change or to the occasional diversion of the Walker River out of 181
and back into the basin is one of the topics addressed in this paper. 182
183
METHODS
184
This synthesis compiles existing radiocarbon data from a number of published sources 185
that bear on the Holocene histories of Walker Lake and the Carson Sink, as well as 186
presents new radiocarbon and infrared stimulated luminescence (IRSL) ages for key 187
outcrops and landforms. All radiocarbon ages have been calibrated with the Calib 7.1 188
program using the IntCal13 calibration curve (Reimer et al., 2013) and are reported in 189
radiocarbon years before present (14C yr BP) and calibrated years before present (cal yr 190
BP). The reservoir effect associated with lakes in the Carson Sink and the Walker River 191
are unknown so radiocarbon ages of mollusk shells from these locales are not corrected, 192
but are assumed to represent maximum ages. Luminescence ages have been corrected to 193
reflect calibrated years before present (1950 AD). 194
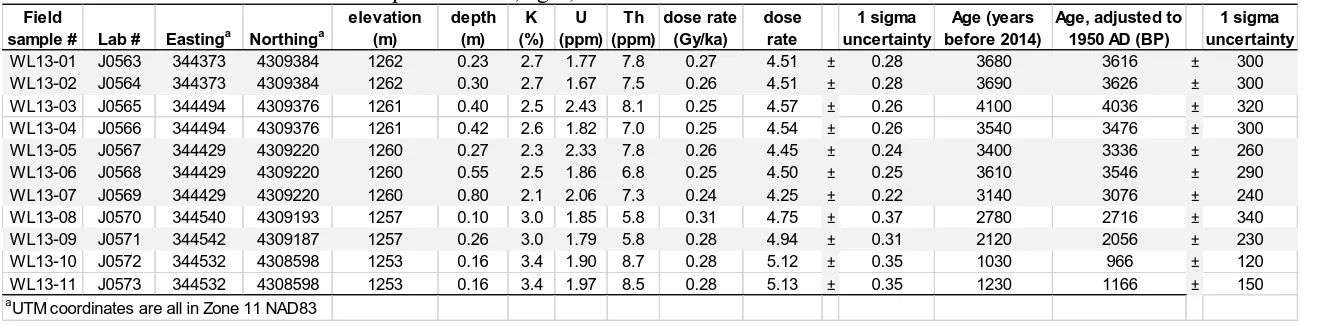
Luminescence samples were collected from six hand excavated pits on a suite of 195
beach ridges near the north end of Walker Lake. Duplicate samples were collected by 196
pounding a steel pipe horizontally into the vertical wall of each sample pit and then 197
excavating the pipe and capping the ends with light-tight material. An attempt was made 198
to sample parts of the exposures with visible bedding, in order to minimize the mixing 199
effects of bioturbation. In situ gamma spectrometer measurements were collected from 200
the same holes where the sediment was collected to determine dose rate, in addition to a 201
bulk sample surrounding each sample site for laboratory radiation measurements. All 202
10
luminescence laboratory using the single grain K-feldspar post IR IRSL protocol outlined 204
in Rhodes (2015). More details on this methodology are found in the supplementary data. 205
Calibrated radiocarbon ages from the late Holocene typically have a 2-sigma error 206
range of several hundred years, which makes it difficult to assess rates of hydrologic 207
change that typically occur over shorter periods (e.g., Adams et al., 2015). For selected 208
radiocarbon samples from the Carson Sink, the moisture-sensitive tree ring chronologies 209
contained within the Living Blended Drought Atlas (LBDA) of Cook et al. (2010) were 210
used to refine the timing and duration of lake highstands associated with particularly wet 211
periods. The LBDA provides a year by year view of the spatial-temporal distribution of 212
drought areas and relatively wet regions across North America that extends back to the 213
year 0 AD (Cook et al., 2010). This information can be viewed in the form of maps or by 214
examining the annual time series of Palmer Drought Severity Index (PDSI) values for the 215
summer months (JJA) at a particular grid node within the LBDA (Fig. 1). Although there 216
are higher numbers of chronologies for younger time periods, more than 15 chronologies 217
contribute to PDSI values for the grid nodes in the Humboldt, Carson, and Walker basins 218
that begin in the time period 500 – 1500 AD and three that extend to the year 0 AD 219
(Figure 1, inset). 220
Assuming that large lakes in the Carson Sink reflect extended periods of above 221
average precipitation within its headwaters, the LBDA time series can guide estimates of 222
timing, duration, and magnitude of specific wet periods encompassed by the imprecise 223
radiocarbon ages associated with high lake levels. Here we assume the beginning of the 224
lake-level rise coincides with the beginning of the wet period as indicated by positive 225
11
become negative. We estimated the number of years it took for the lakes to desiccate by 227
applying the modern evaporation rate (~ 130 cm/yr) to the depths of the lakes, but 228
recognize that this is a minimum duration estimate. 229
The elevations of dating samples and landforms measured for this study were 230
surveyed with either a total station referenced to local benchmarks, high precision GPS 231
instruments, or were determined from high precision LiDAR or photogrammetric-derived 232
topographic data. These elevation measurements therefore have a precision of < 1 m, 233
which is well within the natural variability in the height of shorelines formed above a still 234
water plane (Atwood, 1994; Adams and Wesnousky, 1998). 235
To augment the geologic records of lake-level fluctuations, we applied 236
paleohydrologic models to gain additional insight into timing, rates, and magnitudes of 237
hydrologic changes. For Walker Lake, annual streamflow was simulated using the tree-238
ring chronologies contained within the LBDA that, in turn, was routed to a Walker Lake 239
water balance model that also runs in annual time steps, similar to the approach used by 240
Adams et al. (2015) for Tulare Lake in California. In this case, the combined annual flow 241
volume recorded at two stream gauges along the East Walker River (10293000) and West 242
Walker River (10296500) were regressed against LBDA-derived PDSI values from a grid 243
point (GP 2239; Fig. 1) located in the headwaters of the Walker River to develop 244
statistical relationships between annual tree growth and stream flow. These relationships 245
enabled estimates of annual flow volumes of the Walker River over the last 2000 years. 246
This approach is justified because most of the water utilized by the trees during the 247
growth season comes from snowmelt, which also controls annual river discharge. The 248
12
constrained by the hypsometry of the basin (Lopes and Smith, 2007), to simulate lake-250
level fluctuations over this same period. 251
The water balance model was calibrated by using annual gauged flow recorded at the 252
lowest gauge (10302002) along the Walker River, which is below all points of diversion 253
or storage, along with PRISM estimates of precipitation (Daly et al., 2008) on the lake as 254
input, and a randomly varied lake-evaporation rate between 125 - 135 cm/yr (Milne, 255
1987) controlling the output. To assess the reasonableness of the water balance model, 256
simulated lake-level changes were compared to actual lake-level changes over the 1995 – 257
2017 period of record for the gauge. Historical lake-level changes could not be simulated 258
prior to 1995 because the total volume of water actually reaching the lake was not 259
accurately recorded. 260
This same coupled modeling approach was attempted for the Carson Sink but the 261
volumes of modeled flow were insufficient to account for the large lakes present at 262
various times in the late Holocene. Instead, the relatively simple lake water balance 263
models of Adams (2003) were updated to address the questions of what volumes of 264
stream discharge were necessary over what periods of time to produce the late Holocene 265
lakes. 266
267
RESULTS
268
Walker Lake
269
The geologic mapping of House and Adams (2009, 2010) demonstrated that the undated 270
but late Holocene highstand at Walker Lake was at about 1262 m, based on beach ridges 271
13
are at about the same elevation as a sill with a channel leading to the Double Springs 273
subbasin to the northeast of Walker Lake (Fig. 2). Although this subbasin is relatively 274
small (36 km2 and 0.48 km3 when full), it apparently accommodated all overflow when 275
Walker Lake was at the 1261 m sill, thereby restricting late Holocene levels to this 276
elevation and below. 277
To augment the Walker Lake-level record of Adams (2007), luminescence samples 278
were collected from a suite of beach ridges located in the northwestern part of the basin 279
that range in elevation from about 1252 to 1262 m (Figs. 2 and 3). The beach ridges are 280
primarily composed of granitic sand and grit with small angular to subangular gravel 281
clasts (< 5 cm) likely reworked from existing alluvial fan deposits and older beach 282
deposits. The surfaces of the upper beach ridges (1262 m, 1261 m, and 1260 m; Fig. 3) in 283
this sequence are partially covered by a loose, poorly developed pavement or patches of 284
discontinuous cryptogamic crust preferentially developed around the bases of widely 285
spaced (1-5 m) desert shrubs. Soil development is minimal, consisting of small amounts 286
of eolian silt and fine sand infiltrating into the upper parts (< 20 cm) of the beach ridges, 287
but not enough has accumulated to develop Av horizons. Sample pits dug either on the 288
barrier crests or slightly lakeward revealed an internal structure consisting of laminae to 289
thin beds (< 5 cm) of sand and fine gravel gently dipping to the south toward the former 290
lake, with local heavy mineral concentrations along the laminae. The lower beach ridges 291
(1257 m, 1253 m, and 1252 m; Fig. 3) lack the loose pavements, patchy cryptogamic 292
crusts, and infiltrated dust that characterize the upper beach ridges, but their internal 293
structure is similar. The surface and soil characteristics of all of these beach ridges are 294
14
displayed by Lahontan highstand beach features (~15,500 cal yr BP) in the area that 296
possess better developed pavements and stronger soil development (Adams and 297
Wesnousky, 1999) 298
Results from the luminescence samples are also consistent with a late Holocene age, 299
with the upper most and oldest beach ridge (1262 m) dating from about 3620 + 300 cal yr 300
BP (Table 3 and Fig. 3), based on two samples. Although the duplicate sample ages from 301
each of the lower beach ridges show wider scatter, each group overlaps within 1-sigma 302
uncertainty, except for those from the 1257 m ridge for which 90 years separates the 1-303
sigma age ranges (Table 3). 304
Based on the luminescence ages and their uncertainties, the 1262, 1261, and 1260 m 305
beach ridges were most likely formed between about 3300 – 4000 cal yr BP, and the 306
1257 m ridge formed between 2000 and 3000 cal yr BP. The 1253 m ridge formed about 307
1000 cal yr BP (Table 3 and Fig. 3). All of these beach ridges are above the historical 308
highstand of 1252 m (Adams, 2007). The new ages and elevations of the beach ridges 309
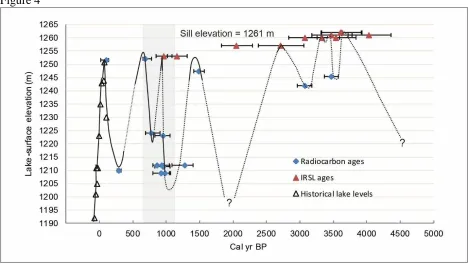
were combined with lake-level data from Adams (2007) to revise the Walker Lake-level 310
curve for the last 4500 years (Fig. 4). Most of the changes were made in the older part of 311
the curve, accounting for the ages and elevations of the beach ridges dated in this study. 312
Particularly uncertain parts of the curve are labeled with question marks. 313
314
Carson Sink
315
As part of their efforts to map the surficial geology of the Lahontan Mountains and to 316
apply modern dating methods to the Quaternary stratigraphy originally defined by 317
15
stratigraphic sections and deposits that reflect late Holocene lake-level changes in the 319
Carson Sink. The two main sites include one above the northeast shore of Carson Lake at 320
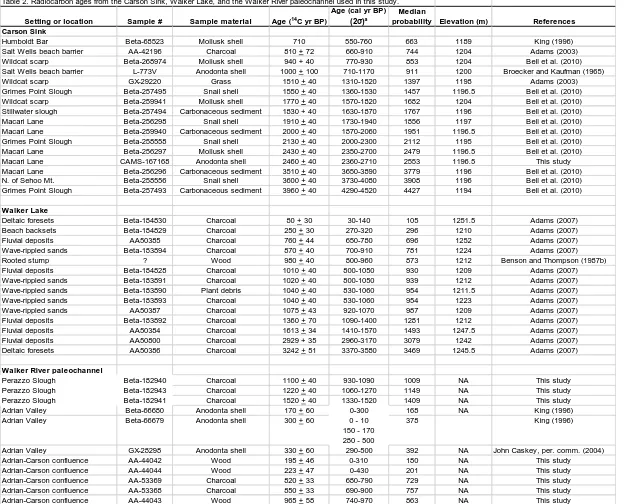
Macari Lane and the other along Grimes Point Slough, which connects Carson Lake with 321
the rest of the Carson Sink via the Stillwater Marsh (Fig. 2). Four additional radiocarbon 322
samples bearing on late Holocene lake levels were collected by Bell et al. (2010) from 323
other sites in the area (Table 2). 324
The Macari Lane and Grimes Point Slough sections are similar and consist of thin to 325
medium beds of brown silty sands with aquatic mollusks interbedded with thin beds of 326
dark gray organic-rich silts that Bell et al. (2010) interpreted as interbedded lacustrine, 327
marsh, and fluvial sediments. We used the elevations and ages of these units combined 328
with the ages of the 1202 m and 1198 m beaches in the area (Adams, 2003) to reconstruct 329
lake-level fluctuations in the Carson Sink over the last 5000 years. 330
Figure 5 presents the late Holocene Carson Sink lake-level curve that is based on a 331
synthesis of all relevant radiocarbon ages (Table 2). In this curve, radiocarbon samples 332
from lacustrine sediments within the Carson Lake subbasin but above the outlet elevation 333
(~1195 m) indicate lakes that probably encompassed much of the Carson Sink. These 334
lakes attained highstands during the intervals 660 – 910, 1310 – 1520, 1570 – 1820, 1730 335
– 1940, and 2350 – 2700 cal yr BP (Table 2 and Fig. 5). The lacustrine samples dating 336
from about 550 - 760, 2000 - 2300, and 3730 - 4080 cal yr BP were collected from sites 337
within the main body of the Carson Sink. 338
We refined the timing of five of the highstands by using tree ring records as an 339
indicator of wet periods (Cook et al., 2010). The end year of each of the five youngest 340
16
tree ring records, these periods of elevated lake levels lasted from about 20 to 50 years 342
(Fig. 5). 343
344
Walker River paleochannel
345
There are multiple channel traces in Mason Valley marking past courses of the Walker 346
River. The Walker River paleochannel is defined as the one that can be almost 347
continuously traced from where it splits from the modern Walker River in southern 348
Mason Valley and then flows northwest through Adrian Valley to connect with the 349
Carson River (Fig. 2). This channel has probably accommodated the most recent flows 350
during diversions. Although the area of the channel bifurcation is now a smooth 351
agricultural field, the natural elevation difference between the paleochannel and the 352
modern Walker River is only one to two meters. Two sites along the paleochannel give 353
evidence for water flowing toward the Carson Sink, but do not necessarily exclude the 354
possibility that water was also flowing into Walker Lake at the same time. 355
356
Perazzo Slough site 357
The Perazzo Slough site is located in northwest Mason Valley along the paleochannel 358
where a drainage ditch cuts across a series of meanders (Figs. 6A and 6B), exposing a 359
cross section through the fluvial landforms and stratigraphy. The sediments primarily 360
consist of thin to medium cross-bedded fine to coarse sands with thin discontinuous 361
lenses of silt or fine gravel. These sequences form discrete packages separated by angular 362
buttress unconformities (Fig. 6A). Some packages have thin mud layers at their bases that 363
17
sedimentary units (numbered i – vi, in order of increasing relative age) conforms to the 365
surface morphology where the youngest channel unit (i) spans the width of the surface 366
channel and is inset into older units (ii and iv) whose edges conform to the bases of 367
terrace risers on the surface (Figs. 6A and 6B). The different stratigraphic units are 368
interpreted as a series of inset channel and point bar deposits that reflect different periods 369
when the Walker River was flowing through the paleochannel. According to the 370
radiocarbon ages of these units, this channel was active several times between about 1520 371
and 930 cal yr BP (Fig. 6A; Table 2). 372
373
Adrian Valley-Carson River confluence 374
At the north end of Adrian Valley, the Walker River paleochannel becomes a tributary to 375
the Carson River at the Adrian Valley-Carson River confluence (Figs. 2, 6C, and 6D). A 376
five-meter-high cutbank into this terrace on the south side of the Carson River exposes a 377
cross section through the stratigraphy of the paleochannel (Fig. 6C). 378
The predominately fine to coarse sandy sediments exposed here are arranged into 379
discrete packages separated by angular buttress unconformities. The units are numbered 380
from 1 to 10 in order of increasing age (Fig. 6C). Unit 10 is the oldest in the exposure and 381
consists of horizontal thin to medium bedded sands, silty sands, and organic and 382
charcoal-rich silty muds. This unit is interpreted to represent vertical accretion of Carson 383
River floodplain deposits from about 970 to 680 cal yr BP (Fig. 6C). On the east side of 384
the exposure, a series of inset channel units are exposed in cross section and generally 385
young to the east. The two radiocarbon ages from these units indicate that they were 386
18
sandy sediments are arranged into thin to medium beds that generally parallel the base of 388
each unit (Fig. 6C) and show common bedding and current ripple cross-389
laminations. Whereas the oldest of these inset channel deposits are graded to a level at 390
about the modern Carson River channel, the younger channels appear to be graded to 391
progressively higher base levels. The age of channel unit 9 is younger than unit 10, but 392
cannot be directly related to the ages of channel units 1 – 8. 393
Based on their approximately perpendicular orientation to the modern Carson River, 394
and their location at the mouth of Adrian Valley, the inset channels exposed on the east 395
side of the exposure are interpreted to represent paleochannels of the Walker River (Fig. 396
6C). Further, the ages of these sediments indicate that these channels have been active 397
multiple times during the last 1000 years. 398
The presence of Carson River meander scars on the surface of the terrace at the 399
mouth of Adrian Valley (Fig. 6D) suggests the possibility that the inset channels exposed 400
in the cutbank (Fig. 6C) were formed by the Carson River instead of the Walker River. 401
Similar meander scars are characteristic of this terrace surface both upstream and 402
downstream from the confluence, but the only place that inset channels were found in the 403
stratigraphy was at the mouth of Adrian Valley. All of the other terrace exposures 404
examined along the Carson River displayed vertically accreted sediments without 405
evidence of cutting and filling. Although not definitive, the inset channels at the mouth of 406
Adrian Valley are most likely associated with the Walker River paleochannel. 407
408
Paleohydrological modeling
19
Paleohydrologic modeling gives estimates of the total annual discharge of the Walker 410
River and the response of Walker Lake to a variety of flow scenarios. The statistical 411
relationship between the PDSI time series from grid point 2239 to the total annual gauged 412
flow in the East Walker and West Walker rivers has an r2 = 0.56 and a standard error of
413
0.13 (Fig. 7a). This relationship was used to reconstruct Walker River discharge for the 414
period 1926 to 2005 that could be directly compared to the gauged flow (Fig. 7b). 415
Although the reconstructed flows match the gauged flows at moderate volumes 416
reasonably well, the reconstructed flows slightly underestimate the largest annual flow 417
volumes and slightly overestimate the lowest gauged flows. Underestimating flow 418
volumes in particularly wet years is a common phenomenon in many streamflow 419
reconstructions (e.g., Meko et al., 2001; Graumlich et al., 2003; Watson et al., 2009; 420
Wise, 2011) because high volume and rapid discharge may not have a lasting effect on 421
soil moisture (Meko and Woodhouse, 2011). Annual precipitation at Walker Lake was 422
simulated for the historical period based on the statistical relationship between PRISM 423
precipitation estimates and the PDSI time series from grid point 2339, which has an r2 = 424
0.48 and a standard error of 28 (Fig. 7c). This relationship was then used to reconstruct 425
annual precipitation at Walker Lake for the period 0 to 2005 AD. 426
To test the Walker Lake water balance model, lake-level fluctuations were modeled 427
for the historical period using gauged flow as well as tree-ring-reconstructed flow as 428
input, along with PRISM precipitation estimates at Walker Lake and an annual 429
evaporation rate ranging between 125 and 135 cm/yr. Although the Siphon gauge 430
(10302002) record is relatively short (1995 – 2017), use of this data in the model results 431
20
credibility of the lake water balance model. Lake-level fluctuations that would have 433
occurred during the historical period if water had not been diverted were also modeled by 434
using the combined flows from stream gauges located upstream from major points of 435
diversion (Fig. 8). These hypothetical lake levels, using actual gauge records, are closely 436
matched by modeled lake-level changes derived from tree-ring-reconstructed flow from 437
those same stream gauges. The magnitude of difference between these latter two curves 438
ranges up to one to three meters (Fig. 8), likely indicating the uncertainty in the 439
paleohydrologic modeling procedure (Adams et al., 2015). 440
Tree ring simulated mean annual Walker River flow volumes and precipitation values 441
at Walker Lake, along with an annual evaporation rate of 125 – 135 cm/yr, were then 442
used to simulate lake-level changes at Walker Lake for the last 2000 years (Fig. 9). Our 443
estimates indicate that lake level quickly rose from a starting elevation of 1225 m at 2000 444
cal yr BP to fluctuate between 1250 and 1255 m until about 1080 cal yr BP (870 AD) 445
when lake level fell to about 1246 – 1247 m. Lake level remained relatively low until 446
about 950 cal yr BP (1000 AD) when lake level rose in a step-like manner to reach 1255 447
m by 830 cal yr BP (1120 AD). Lake level dropped to 1248.5 m by about 710 cal yr BP 448
(1240 AD) before rising to fluctuate around 1255 m into the historical period (Fig. 9). 449
450
DISCUSSION
451
The paleohydrologic histories of the Carson Sink and Walker Lake reflect interactions 452
among climate and river dynamics. In particular, these two lake systems are linked by the 453
occasional diversions of the Walker River from Walker Lake to the Carson Sink. 454
21
basin size and location and lake-basin hypsometry have also affected how these basins 456
have responded to climate fluctuations during the Holocene. 457
The Walker River was diverted back into Walker Lake by about 5500 cal yr BP, after 458
spending most of the early and middle Holocene emptying into the Carson Sink (Benson 459
and Thompson, 1987a; Bradbury et al., 1989; Benson et al., 1991). By about 4000 cal yr 460
BP, Walker Lake had reached its highest levels of the Holocene at around 1262 m (Fig. 461
4), coincident with the Neopluvial period that was originally defined by Allison (1982) to 462
indicate a period of relatively high lake levels that coincided with the Neoglacial period 463
(e.g., Denton and Stuiver, 1966; Porter and Denton, 1967). Except for two minor lake 464
level drops to about 1240 – 1245 m, Walker Lake remained at relatively high levels (> 465
1255 m) until about 2800 cal yr BP (Fig. 4). Benson et al. (1991) indicated that Walker 466
Lake nearly desiccated by around 2000 cal yr BP based on the abundance of ruppia 467
pollen found in a core interval dating from this period, which was interpreted to represent 468
a shallow playa lake. Berelson et al. (2009) suggested that lake level did not fall below 469
about 1200 m at this time, based on the ages and carbonate-associated sulfate content of a 470
low elevation tufa. The timing of this low lake level agrees with evidence for the Late 471
Holocene Dry Period in the Great Basin that extended from about 2900 to 1850 cal yr BP 472
(Mensing et al., 2013), although such low Walker levels may have resulted from 473
diversion of the Walker River into the Carson Sink. 474
From about 1500 cal yr BP to the historical period, Walker Lake has undergone 475
several high amplitude fluctuations, constrained by the age of shorelines or nearshore 476
deposits at relatively high elevations and fluvial deposits or other evidence of desiccation 477
22
about 1000 cal yr BP (Fig. 4) was adjusted upward from the 2007 curve based on the age 479
of the 1253 m shoreline (Fig. 3 and Table 2). 480
These late Holocene Walker Lake fluctuations correspond to surface area changes 481
ranging from about 300 to 150 km2 and volumetric changes ranging from about 13 to 3
482
km3. The magnitude of these changes can be placed in perspective by noting the 483
historical decline of Walker Lake from 1252 m in 1868 to 1190 m in 2016, owing to 484
annual reductions in Walker River flow ranging from about 50% to over 90% due to 485
upstream diversions and consumption. The question remains: are late Holocene lake-level 486
fluctuations representative of climate fluctuations or were they caused by changes in the 487
path of the Walker River? 488
Evidence against strictly climatic factors and for multiple river diversions explaining 489
the dramatic lake-level changes includes discrete packages of different-aged fluvial 490
sediments preserved at two different sites along the Walker River paleochannel (Fig. 6). 491
Each of these packages indicate periods when Walker River water was flowing through 492
the paleochannel into Carson Sink, presumably instead of flowing into Walker Lake, 493
although it is possible that flow was occasionally split between the two channels. The 494
lengths of time or volumes of water that flowed through the paleochannel cannot be 495
determined based on the geologic evidence. 496
Paleohydrologic modeling bolsters the case for Walker River diversions over the last 497
2000 years. According to results of the tree-ring based water balance modeling, Walker 498
Lake levels would have remained relatively high (1245 – 1258 m) during the last 2000 499
years, with only relatively minor fluctuations, particularly through the Medieval Climate 500
23
fluctuations therefore suggests that river diversions in and out of the Walker basin are 502
likely responsible for the large lake-stage fluctuations. Consequently, the severe climatic 503
conditions that Hatchett et al. (2015) inferred from the large-scale lake-level fluctuations 504
during the Medieval Climate Anomaly may be overstated. 505
For the Carson Sink, our paleohydrologic models could not simulate geologically-506
documented high late Holocene lake levels using tree-ring simulated stream flows. 507
Adams (2003) used a simple water balance model (e.g., Benson and Paillet, 1989) in 508
annual time steps to determine that the combined flow of the Humboldt, Carson, and 509
Walker rivers would have only produced lakes below an elevation of about 1188 m 510
(~1660 km2, 8.4 km3) during the historical period. To produce a lake approaching 1200 m 511
(~2815 km2, 35.7 km3) in the Carson Sink, mean annual flow would have to have 512
increased by a factor of 4 to 5 (3 – 4 km3/yr) and remained in that range for decades
513
(Adams, 2003). The main constraining factor that limits high lake levels in the Carson 514
Sink is the broad, relatively flat hypsometry of the basin, which causes large increases in 515
lake surface area and evaporative output with relatively minor increases in lake level. 516
In contrast, the relatively deep and narrow hypsometry of the Walker Lake basin 517
(Lopes and Smith, 2007) indicates that a 50 m increase in lake level from 1200 m to 1250 518
m results in an increase in surface area from 132 to 304 km2 and an increase in volume 519
from about 2.3 to 12.8 km3. The evaporative output from Walker Lake when it is at 1250
520
m is about 0.4 km3/yr, which is similar to the mean annual historical flow into the basin 521
(Table 1). The near balance between Walker River inflow and the evaporative output of 522
Walker Lake when it is near 1250 m may explain why Walker Lake would have 523
24
withdrawals had not occurred (Fig. 8) and over the last 2000 years if river diversions had 525
not occurred (Figs. 9 and 10). 526
The tree ring chronologies contained within the LBDA may indicate the timing and 527
duration of high-flow periods sufficient to produce high lake levels in the Carson Sink. 528
Cook et al. (2010) examined precipitation conditions during the Medieval Climate 529
Anomaly and determined that two lengthy droughts in the Great Basin bookended a 530
particularly wet period that lasted 46 years from 1075 to 1121 AD (875 – 829 cal yr BP). 531
Spatially, the wettest part of the Great Basin during the Medieval pluvial was in the 532
headwaters of the Humboldt River where PDSI values averaged 1 to 2 (Cook et al., 533
2010), while PDSI values in the headwater reaches of the Carson and Walker river basins 534
ranged from 0 – 1 during this period. This particularly wet episode overlaps with the 535
radiocarbon age of the Salt Wells beach barrier (660 – 910 cal yr BP) (Adams, 2003), 536
suggesting that this lake expanded to a surface elevation of about 1200 m during this 537
period. The 46-year duration of the Medieval pluvial constrains the sustained magnitude 538
of flow into the Carson Sink to have been greater than the historical average by about a 539
factor of 4 to 5, based on the modeling of Adams (2003), or similar to the peak annual 540
discharges recorded for the Humboldt and Carson rivers (Table 1). The timing and 541
duration of four other lake stands over the last 2000 years were similarly refined and 542
indicate that discrete pluvial periods affecting the Carson Sink have lasted from 21 to 27 543
years (Fig. 5) and reflect periods of flow that were also much above the historical 544
average. The temporal refinement of the duration of the wet periods in the Carson Sink 545
led to the drawing of sharply peaked lake-level fluctuations on that curve separated by 546
25
Dry Period (2900 to 1850 cal yr BP; Mensing et al., 2013), suggesting that there may 548
have been a few relatively wet periods in this overall dry episode. 549
Based on the historical gauge records, it is apparent that during wet periods the 550
Humboldt River can deliver a higher proportion of water to the Carson Sink, relative to 551
its annual average, than the Carson River does. During the wettest years on record, the 552
Humboldt River delivered 4.4 times its mean average annual flow, whereas the Carson 553
River delivered 2.8 times its mean annual flow during the wettest year on record, even 554
though the mean annual discharges for these rivers are similar (Table 1). This 555
discrepancy may be due to the much larger size of the Humboldt River basin versus the 556
Carson River basin (Fig. 1). Sustained high discharge volumes in both basins may be 557
influenced by increases in the runoff coefficient during extended wet periods (e.g., 558
Risbey and Entekhabi, 1996; Menking et al., 2004). 559
Figure 10 shows summary plots of lake-level changes in Walker Lake and the Carson 560
Sink, the time periods when water was flowing through the Walker River paleochannel, 561
the timing of drought terminations in the Walker River (Stine, 1994), and 562
paleohydrologic modeling results for Walker Lake. These comparisons indicate that flow 563
through the paleochannel is indeed associated with falling or low Walker Lake levels and 564
sometimes high Carson Sink levels, suggesting that river diversion was at least partly 565
responsible for lake-level fluctuations in both basins. A striking example of this 566
association is during the Medieval pluvial (875 – 829 cal yr BP; Cook et al., 2010), when 567
Walker lake levels were low even though modeling results indicate that Walker should 568
have been rising from about 1245 m to 1250 m at that time. The death age of trees in the 569
26
droughts at around 830 cal yr BP (Stine, 1994) and the beginning of the Medieval pluvial. 571
The Walker River paleochannel was active during the Medieval pluvial and one of the 572
largest lakes in the late Holocene appeared in the Carson Sink, all of which suggests that 573
the Walker River was augmenting the flows of the Carson and Humboldt at this time. 574
Relatively high lake levels during the Medieval pluvial were also recorded at Mono Lake 575
(Stine, 1990) and Owens Lake (Bacon et al., 2018). 576
577
CONCLUSIONS
578
This study synthesizes existing data on the late Holocene lake-level histories of the 579
Carson Sink and Walker Lake, augmented by additional dating at key shoreline localities 580
and at sites along the Walker River paleochannel that connects these basins. Moisture-581
sensitive tree-ring chronologies from the Living Blended Drought Atlas (Cook et al., 582
2010) were used to refine the timing and duration of high lake levels in the Carson Sink 583
and to model annual lake-level fluctuations in Walker Lake over the last 2000 years. 584
Although these basins are in the same general region and are connected by the 585
paleochannel, the details of each of their histories differ in significant ways based on a 586
number of factors. Transient factors include the multiple diversions of the Walker River 587
back and forth between Walker Lake and the Carson Sink, as well as climate variability 588
across these drainage basins that span from the Sierra Nevada to northeast Nevada (Fig. 589
1). 590
There are also fundamental differences in some of the physical factors that influence 591
the basin histories, particularly the different hypsometries and drainage basin sizes. The 592
27
surface elevation lead to relatively large increases in surface area and evaporative output, 594
thus acting as a strong negative feedback to higher lake levels. In contrast, the relatively 595
narrow and deep Walker Lake basin would have maintained an average lake-surface 596
elevation of 1245-1255 m over the last 100 years under natural conditions, which 597
corresponds to a surface area just large enough to evaporate enough water to balance the 598
mean annual inflow. 599
Multiple large-scale (50 + m) lake-level fluctuations at Walker Lake in the last 2000 600
years likely resulted from river diversions. Evidence for this includes the ages of fluvial 601
sediments preserved along the paleochannel that coincide with low Walker Lake levels 602
and tree ring-based paleohydrologic modeling that suggests that lake levels would have 603
been relatively high over the last 2000 years, absent the diversions. 604
The large lakes that did occasionally appear in the Carson Sink during the late 605
Holocene were created by relatively wet periods that lasted from two to several decades. 606
The largest of these rose during the 46-year long Medieval pluvial centered around 1100 607
AD. Paleohydrologic modeling suggests that discharge into the Carson Sink must have 608
increased by a factor of four or five and maintained for those decades. In addition to the 609
diversion of the Walker River into the Carson Sink at that time, increased runoff may 610
have also been facilitated by an increase in the runoff coefficient as well as larger parts of 611
the drainage basin contributing runoff. 612
Regardless of the absolute temporal precision of the lake-level curves presented 613
herein, they probably capture the absolute magnitudes of hydrologic variability possible 614
in these basins under current climate boundary conditions (e.g., Wanner et al., 2008). 615
28
documenting the absolute flux of water across the landscape in prehistoric times. 617
Therefore, defining the timing, magnitude, and durations of both dry and wet climate 618
episodes from past lake levels helps to place possible future extremes into context. In this 619
way, knowledge of the recent past essentially informs future possibilities. 620
621
ACKNOWLEDGEMENTS
622
This research was supported by National Science Foundation grants EAR 0087840 and 623
EAR 1252225, as well as by the Desert Research Institute, but all analyses and 624
interpretations were made by the authors. We thank Mike Lawson and Chris McGuire for 625
their help in luminescence sample collection, Wendy Barrera and Tom Capaldi for 626
sample preparation, and Nathan Brown for sample preparation and measurements. We 627
also thank Edward Cook for providing a copy of the Great Basin portion of the Living 628
Blended Drought Atlas. Many discussions both in the office and in the field with John 629
Bell are greatly appreciated and helped focus the work. Thanks John Caskey for 630
providing an unpublished radiocarbon age of anodonta shells from the Walker River 631
paleochannel. Reviews by Noah Abramson, Jim O’Connor, Derek Booth and two 632
anonymous reviewers helped improve the clarity and content of the manuscript. 633
634
REFERENCES
635
Adams, K.D., 2003, Age and paleoclimatic significance of late Holocene lakes in the 636
29
Adams, K.D., 2007, Late Holocene sedimentary environments and lake-level fluctuations 638
at Walker Lake, Nevada, USA: Geological Society of America Bulletin, v. 119, p. 639
126-139. 640
Adams, K.D., and Wesnousky, S.G., 1998, Shoreline processes and the age of the Lake 641
Lahontan highstand in the Jessup embayment, Nevada: Geological Society of 642
America Bulletin, v. 110, p. 1318-1332. 643
Adams, K.D., and Wesnousky, S.G., 1999, The Lake Lahontan highstand: Age, surficial 644
characteristics, soil development, and regional shoreline correlation: 645
Geomorphology, v. 30, p. 357-392. 646
Adams, K.D., Wesnousky, S.G., and Bills, B.G., 1999, Isostatic rebound, active faulting, 647
and potential geomorphic effects in the Lake Lahontan basin, Nevada and 648
California: Geological Society of America Bulletin, v. 111, p. 1739-1756. 649
Adams, K.D., Negrini, R.M., Cook, E.R., and Rajagopal, S., 2015, Annually resolved late 650
Holocene paleohydroology of the southern Sierra Nevada and Tulare Lake, 651
California: Water Resources Research, v. 51, p. 1-17. 652
Allander, K.P., Smith, J.L., and Johnson, M.J., 2009, Evapotranspiration from the lower 653
Walker River basin, west-central Nevada, water years 2005-07: U.S. Geological 654
Survey Scientific Investigations Report 2009-5079, 62 p. 655
Allison, I.S., 1982, Geology of pluvial Lake Chewaucan, Lake County, Oregon: 656
Corvallis, OR, Oregon State University Press, 79 p. 657
Atwood, G., 1994, Geomorphology applied to flooding problems of closed-basin lakes - 658
30
Bacon, S.N., Lancaster, N., Stine, S., Rhodes, E.J., McCarley Holder, 2018, A continuous 660
5000-year lake-level record of Owens Lake, south-central Sierra Nevada, 661
California, USA: Quaternary Research, v. 90, no. 2, p. 276-302. 662
Bell, J.W., Caskey, S.J., and House, P.K., 2010, Geologic map of the Lahontan 663
Mountains quadrangle, Churchill County, Nevada (2nd ed.): Nevada Bureau of 664
Mines and Geology Map 168, 1:24,000 scale, 24 p. text. 665
Bell, J.W., and House, P.K., 2010, Geologic map of the Grimes Point quadrangle, 666
Churchill County, Nevada: Nevada Bureau of Mines and Geology Map 173, 667
1:24,000 scale, 24 p. text. 668
Benson, L.V., 1978, Fluctuations in the level of pluvial Lake Lahontan during the last 669
40,000 years: Quaternary Research, v. 9, p. 300-318. 670
Benson, L.V., 1988, Preliminary paleolimnologic data for the Walker Lake subbasin, 671
California and Nevada, U.S. Geological Survey, Water Resources Investigations 672
Report 87-4258, 50 p. 673
Benson, L., 2004, Western Lakes, in Gillespie, A.R., Porter, S.C., and Atwater, B.F., eds., 674
The Quaternary Period in the United States, Volume 1: Developments in 675
Quaternary Sciences: Amsterdam, Elsevier, p. 185-204. 676
Benson, L.V., and Thompson, R.S., 1987a, The physical record of lakes in the Great 677
Basin, in Ruddiman, W.F., and Wright, H.E., Jr., eds., North America and 678
adjacent oceans during the last deglaciation: Boulder, CO, United States, 679
Geological Society of America, p. 241-260. 680
Benson, L.V., and Thompson, R.S., 1987b, Lake-level variation in the Lahontan basin for 681
31
Benson, L., and Paillet, F., 1989, The Use of Total Lake-Surface Area as an Indicator of 683
Climatic Change: Examples from the Lahontan Basin: Quaternary Research, v. 684
32, p. 262-275. 685
Benson, L.V., Meyers, P.A., and Spencer, R.J., 1991, Change in the size of Walker Lake 686
during the past 5000 years: Palaeogeography, Palaeoclimatology, Palaeoecology, 687
v. 81, p. 189-214. 688
Berelson, W., Corsetti, F., Johnson, B., Vo, T., and Der, C., 2009, Carbonate-associated 689
sulfate as a proxy for lake level fluctuations: a proof of concept for Walker Lake, 690
Nevada: Journal of Paleolimnology, v. 42, p. 25-36. 691
Bradbury, J.P., Forester, R.M., and Thompson, R.S., 1989, Late Quaternary 692
paleolimnology of Walker Lake, Nevada: Journal of Paleolimnology, v. 1, p. 249-693
267. 694
Cook, E.R., Seager, R., Heim, R.R.J., Vose, R.S., Herweijer, C., and Woodhouse, C., 695
2010, Megadroughts in North America: placing IPCC projections of 696
hydroclimatic change in a long-term palaeoclimate context: Journal of Quaternary 697
Science, v. 25, p. 48-61. 698
Daly, C., Halbleib, M., Smith, J., Gibson, W.P., Doggett, M.K., and Taylor, G.H., 2008, 699
Physiographically sensitive mapping of climatological temperature and 700
precipitation across the conterminous United States: International Journal of 701
Climatology, v. 28, p. 2031-2064. 702
Davis, J.O., 1978, Quaternary tephrochronology of the Lake Lahontan area, Nevada and 703
California, University of Nevada, Nevada Archeological Survey Research Paper 704
32
Davis, J.O., 1982, Bits and pieces: the last 35,000 years in the Lahontan basin, in 706
Madsen, D.B., and O'Connell, J.F., eds., Man and Environment in the Great 707
Basin, Society of American Archeology Papers No. 2, p. 53-75. 708
Denton, G.H., and Stuiver, M., 1966, Neoglacial chronology, northeastern St. Elias 709
Mountains, Canada: American Journal of Science, v. 264, p. 577-599. 710
Graumlich, L. J., M. F. J. Pisaric, L. A. Waggoner, J. Littell, and J. C. King, 2003, Upper
711
Yellowstone River flow and teleconnections with Pacific basin climate variability
712
during the past three centuries: Climatic Change, v. 59, p. 245–262,
713
doi:10.1023/A:1024474627079.
714
Harding, S.T., 1965, Recent variations in the water supply of the western Great Basin: 715
Berkeley, California, Water Resources Center Archives, University of California, 716
225 p. 717
Hatchett, B.J., Boyle, D.P., Putnam, A.E., and Bassett, S.D., 2015, Placing the 2012-2015 718
California-Nevada drought into a paleoclimatic context: Insights from Walker 719
Lake, California-Nevada, USA: Geophysical Research Letters, v. 42, p. 8632-720
8640. 721
House, P.K., and Adams, K.D., 2009, Preliminary geologic map of the southern part of 722
the lower Walker River area, Mineral County, NV, Nevada Bureau of Mines and 723
Geology Open File Report 09-13, 1:24,000-scale. 724
House, P.K., and Adams, K.D., 2010, Preliminary geologic map of the northern part of 725
the lower Walker River area, Mineral County, NV, Nevada Bureau of Mines and 726
33
King, G.Q., 1993, Late Quaternary history of the lower Walker River and its implications 728
for the Lahontan paleolake system: Physical Geography, v. 14, p. 81-96. 729
King, G.Q., 1996, Geomorphology of a dry valley: Adrian Pass, Lahontan basin, Nevada: 730
Association of Pacific Coasts Geographers Yearbook, v. 58, p. 89-114. 731
Lopes, T.J., and Smith, J.L.R., 2007, Bathymetry of Walker Lake, West-Central Nevada, 732
USGS Scientific Investigation Report 2007-5012, 26 p. 733
Meko, D. M., M. D. Therrell, C. H. Baisan, and M. K. Hughes, 2001, Sacramento River
734
flow reconstructed to AD 869 from tree rings: Journal of the American Water
735
Resources Society, v. 37, p. 1029–1039,
doi:10.1111/j.1752-736
1688.2001.tb05530.x.
737
Meko, D. M., and C. A. Woodhouse, 2011, Application of streamflow reconstruction to
738
water resources management, in Dendroclimatology Progress and Prospects, vol.
739
11, Developments in Paleoenvironmental Research, M. K. Hughes, T. W.
740
Swetnam, and H. F. Diaz (eds.): Springer, Heidelberg, Germany, p. 231–261.
741
Menking, K.M., Anderson, R.Y., Shafike, N.G., Syed, K.H., and Allen, B.D., 2004, 742
Wetter or colder during the Last Glacial Maximum? Revisiting the pluvial lake 743
question in southwestern North America: Quaternary Research, v. 62, p. 280-288. 744
Mensing, S.A., Sharpe, S.E., Tunno, I., Sada, D.W., Thomas, J.M., Starratt, S., and 745
Smith, J., 2013, The late Holocene Dry Period: multiproxy evidence for an 746
extended drought between 2800 and 1850 cal yr BP across the central Great 747
Basin, USA: Quaternary Science Reviews, v. 78, p. 266-282. 748
Milne, W., 1987, A comparison of reconstructed lake-level records since the mid-1880s 749
34
Morrison, R.B., 1964, Lake Lahontan: Geology of the southern Carson Desert, U.S. 751
Geological Survey Professional Paper 401, 156 p. 752
Morrison, R.B., 1991, Quaternary stratigraphic, hydrologic, and climatic history of the 753
Great Basin, with emphasis on Lake Lahontan, Bonneville, and Tecopa, in 754
Morrison, R.B., ed., Quaternary nonglacial geology; conterminous U.S.: Boulder, 755
CO, United States, Geological Society of America, p. 283-320. 756
Newton, M.S., and Grossman, E.L., 1988, Late Quaternary chronology of tufa deposits, 757
Walker Lake, Nevada: Journal of Geology, v. 96, p. 417-433. 758
Porter, S.G., and Denton, G.H., 1967, Chronology of Neoglaciation in the North 759
American Cordillera: American Journal of Science, v. 265, p. 177-210. 760
Reheis, M.C., Adams, K.D., Oviatt, C.G., and Bacon, S.N., 2014, Pluvial lakes in the 761
Great Basin of the western United States: A view from the outcrop: Quaternary 762
Science Reviews, v. 97, p. 33-57. 763
Reimer, P.J., Bard, E., Bayliss, A., Beck, J.W., Blackwell, P.G., Bronk Ramsey, C., 764
Buck, C.E., Cheng, H., Edwards, R.L., Friedrich, M., Grootes, P.M., Guilderson, 765
T.P., Haflidason, H., Hajdas, I., Hatté, C., Heaton, T.J., Hogg, A.G., Hughen, 766
K.A., Kaiser, K.F., Kromer, B., Manning, S.W., Niu, M., Reimer, R.W., Richards, 767
D.A., Scott, E.M., Southon, J.R., Turney, C.S.M., van der Plicht, J., 2013, 768
IntCal13 and MARINE13 radiocarbon age calibration curves 0-50000 years cal 769
BP: Radiocarbon, v. 55, no.4, p. 1869-1887, doi: 10.2458/azu_js_rc.55.16947. 770
Rhodes, E.J., 2015, Dating sediments using potassium feldspar single grain IRSL: Initial 771
35
Risbey, J.S., and Entekhabi, D., 1996, Observed Sacramento Basin streamflow response 773
to precipitation and temperature changes and its relevance to climate impact 774
studies: Journal of Hydrology, v. 184, p. 209-223. 775
Russell, I.C., 1885, Geological history of Lake Lahontan, a Quaternary lake in 776
northwestern Nevada, U.S. Geological Survey Monograph 11, 288 p. 777
Smith, G.I., and Street-Perrott, F.A., 1983, Pluvial lakes of the Western United States, in 778
Porter, S.C., ed., The late Pleistocene.: Minneapolis, MN, United States, Univ. 779
Minn. Press, p. 190-212. 780
Stine, S., 1990, Late Holocene fluctuations of Mono Lake, California: Palaeogeography, 781
Palaeoclimatology, Palaeoecology, v. 78, p. 333-381. 782
Stine, S., 1994, Extreme and persistent drought in California and Patagonia during 783
mediaeval time: Nature, v. 369, p. 546-549. 784
Wanner, H., Beer, J., Butikofer, J., Crowley, T.J., Cubasch, U., Fluckiger, J., Goosse, H., 785
Gosjean, M., Joos, F., Kaplan, J., Kuttel, M., Muller, S., Prentice, I.C., Solomina, 786
O., Stocker, T.F., Tarasov, P., Wagner, M., and Widmann, M., 2008, Mid- to Late 787
Holocene climate change: an overview: Quaternary Science Reviews, v. 27, p. 788
1791-1828. 789
Watson, T. A., F. A. Barnett, S. T. Gray, and G. A. Tootle, 2009, Reconstructed
790
streamflows for the headwaters of the Wind River, Wyoming, United States:
791
Journal of the American Water Resources Association, v. 45, p. 224–236,
792
doi:10.1111/j.1752-1688.2008.00274.x.
793
Wise, E. K., 2010, Tree ring record of streamflow and drought in the upper Snake River:
794
Water Resources Research, v. 46, W11529, doi:10.1029/ 2010WR009282.
36
Yuan, F., Linsley, B.K., Lund, S.P., and McGeehin, J.P., 2004, A 1200 year record of 796
hydrologic variability in the Sierra Nevada from sediments in Walker Lake, 797
Nevada: Geochemistry, Geophysics, Geosystems, v. 5, p. 1-13. 798
Yuan, F., Linsley, B.K., Howe, S.S., Lund, S.P., and McGeehin, J.P., 2006, Late 799
Holocene lake-level fluctuations in Walker Lake, Nevada USA: Palaeogeography, 800
Palaeoclimatology, Palaeoecology, v. 240, p. 497-507. 801
37
FIGURE CAPTIONS
803
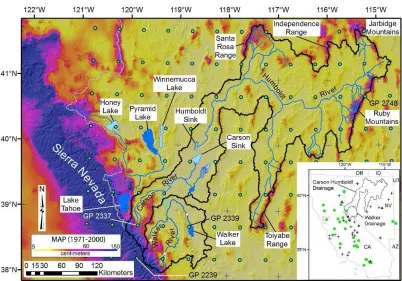
Figure 1. Overview map of the Carson Sink and Walker Lake drainage basins (black 804
lines) showing the locations of features and sites mentioned in the text. Background is 805
PRISM mean annual precipitation (Daly et al., 2008) draped over a hillshaded digital 806
elevation model. The green dots represent Living Blended Drought Atlas grid points from 807
Cook et al. (2010), with labels indicating the ones used in this study. The inset map
808
shows the distribution of tree ring chronologies utilized in the LBDA with chronologies
809
extending over the last 500 years shown by black crosses, chronologies covering the
810
years 500–1500 A.D. shown by filled green circles, and chronologies that are older than
811
500 A.D. shown by filled black triangles. For the full explanation of color symbols, see 812
the online version. 813
814
Figure 2. Map of the Carson Sink and Walker Lake basins showing the relevant 815
hydrographic features influencing late Holocene paleohydrology and locations mentioned 816
in text. Medium blue shading in the basins shows the largest extent of late Holocene 817
lakes, while the lighter blue shading indicates the modern extent of water bodies. White 818
outlines show the extent of historical highstands which occurred in 1862 in the Carson 819
Sink and 1868 in Walker Lake. The 1985 lake extent (~1183 m) is also shown in the 820
Carson Sink by a black line. For the full explanation of color symbols, see the online 821
version. 822
823
Figure 3. Geomorphic map of a series of late Holocene beach ridges (blue lines) in the 824
38
highstand reached an elevation of 1252 m and shorelines from 1253 to 1262 m date from 826
the late Holocene. Luminescence ages have been converted to years BP (Table 3). For the 827
full explanation of color symbols, see the online version. 828
829
Figure 4. Late Holocene lake-level curve for Walker Lake modified from Adams (2007). 830
Chronological data constraining this curve are found in Tables 2 and 3. The vertical grey 831
band represents the timing of the Medieval Climate Anomaly. 832
833
Figure 5. Late Holocene lake-level curve for the Carson Sink constructed from data in 834
Table 2. The outlet elevation of Carson Lake is at about 1195 m. The blue diamonds 835
represent lakes that flooded the entire Carson Sink, whereas the purple squares represent 836
lakes that may have only filled Carson Lake (see figure 2). Green circles represent fluvial 837
deposits along Grimes Point Slough and the orange triangle represents the historical 838
highstand in 1862. The groups of three red crosses represent the beginning, peak, and end 839
of pluvial periods derived from the LBDA (grid point 2748). Each of these pluvial 840
periods is labeled with the duration in years. The vertical grey band represents the timing 841
of the Medieval Climate Anomaly. 842
843
Figure 6. Cross-sections and maps of the two sites along the Walker River paleochannel 844
(see figure 2). A) Interpreted cross-section of the Perazzo Slough site showing discrete 845
packages of fluvial sediments related to flow along the paleochannel. Relative age 846
increases from i – vi. Width of the exposure is about 80 m. B) Lidar hillshade map 847
39
section. C) Cross section exposed along the right bank of the Carson River at the mouth 849
of Adrian Valley (D) showing a series of stacked channel features incised into 850
horizontally bedded flood plain sediments of the Carson River that are interpreted to 851
represent paleochannel deposits of the Walker River. Relative age of stratigraphic units 852
increases from 1 – 10. Exposure is about 5 m high and 90 m long. For the full explanation 853
of color symbols, see the online version. 854
855
Figure 7a. Relationship between LBDA PDSI values (grid point 2239) and annual 856
discharge of the East and West Walker River from 1958-2005. 7b. Reconstructed annual 857
discharge of the Walker River compared to gauged discharge for the period 1926-2005. 858
7c. Plot showing the relationship between PRISM water year annual precipitation and 859
annual PDSI values from grid point 2339 at Walker Lake. 860
861
Figure 8. Modeled Walker Lake-level fluctuations compared to actual lake-level 862
fluctuations for the period 1943-2017 using various simulated and observational data. 863
The solid blue line represents observed lake-level changes, whereas the red dashed line 864
represents modeled changes using discharge from the lowest gauge on the system, which 865
effectively represents the actual volumes of water delivered to the lake. The upper purple 866
dotted line represents lake levels that would have occurred had there been no 867
anthropogenic water withdrawals or consumption on the system by using discharge data 868
from gauges located upstream from points of diversion. The dashed green line represents 869