Int. J. Electrochem. Sci., 12 (2017) 8306 – 8314, doi: 10.20964/2017.09.06
International Journal of
ELECTROCHEMICAL
SCIENCE
www.electrochemsci.org
Electrodeposition Synthesis of PANI/MnO
2/Graphene
Composite Materials and its Electrochemical Performance
Wang Kai1,*, Li Liwei1, Xue Wen1, Zhou Shengzhe1, Lan Yong1, Zhang Hongwei2, Sui Zongqiang3
1
College of Automation and Electric Engineering, Qingdao University, Shandong Province, Qingdao, 266071, China
2
Materials Department, State Grid Shandong Electric Power Company, Jinan, 250001, China
3
State Grid Shandong Electric Power Maintenance Company, Jinan, 250021, China
*
E-mail: wkwj888@163.com
Received: 27 March 2017 / Accepted: 19 June 2017 / Published: 13 August 2017
This paper uses a simple pulse electrodeposition method to synthesize PANI/MnO2/Graphene
composite. The structure and composition of the complex was characterized by XRD and FT-IR. The morphology of the complex was characterized by SEM. The electrochemical performance was tested by electrochemical workstation. The results show that specific capacity can reach 1019F·g-1 under the current density of 0.5A·g-1. The stability is as high as 98.1% after a 500-cycle. The composite may have a good performance for its applications in supercapacitors.
Keywords: Composite materials; Supercapacitor; Electrochemical
1. INTRODUCTION
they have a better performance. Graphene composites are usually designed as 3D network structures. Compared with carbon materials, metal oxides and conducting polymers of grapheme can contribute to higher specific capacity in the process of redox reaction. Graphene provides a three dimensional conductive network to connect with its capacitance composite material [21-24].
2. TEST METHOD 2.1. Material Preparation
The three elements composite of PANI/MnO2/Gaphene was prepared and its electrochemical
properties were studied.
The methods of synthesizing composite materials were pulse electrodeposition and hydrothermal method. The materials needed grapheme, aniline, MnSO4, HCL and so on. Based on
getting 3D network structure of graphene ternary complexes, electrochemical method was chosen. The Graphene/MnO2/PANI ternary composites were synthesized by a simple pulse electrodeposition
method. Firstly, 0.125 g of grapheme, aniline, and 0.15g of MnSO4 were mixed with 60ml HCL. Then,
0.375 g of APS was added in 30 ml of HCl (1 mol L-1) and 0.09 g of KMnO4 in deionized water. The
mixture was added to the sealing of the autoclave and heated up to 180 degrees for 10 h. Finally, the composite materials of Graphene/MnO2/PANI were obtained after filtration and dried under vacuum
for further characterization. The characterization is simple, fast, easy to control, and it is a kind of low energy consumption and pure product. Using the improved Hummers method, Graphite Oxide (GO) was made and it became graphene after microwave procession. The improved method is that taking a certain volume and quality of aniline, sulfuric acid, MnSO4 and graphene, mixture 500mL solution
according to certain proportion. In this electrolyte, Aniline’s concentration was 0.2mol·L-1. Sulfuric-acid’s concentration was 0.4mol·L-1
. The concentration of manganese sulfate was 0.6mol·L-1. Graphene’s concentration was 0.04g·L-1.
The preparation of composite materials method was pulse electrodeposition. The method of pulse electrodeposition was using titanium plate as anode and using graphite as cathode. Its current density was 2mA/cm-2. Its pulse frequency was 1000Hz. Its duty ratio was 60%. Its unidirectional pulse deposition was under temperature of 25oC for 30 minutes. Firstly, titanium plate got composites of PANI/MnO2/Graphene; secondly, gently scraped down them with deionized water after repeated
washing; finally, dried them under temperature of 60oC.
2.2. Characterization and Testing
the shimadzu DTG-60 type a differential thermal analyzer. Temperature range was from the room temperature to 700oC, and heating rate was 10oC/min.
During Electrochemical performance test, the system was a three-electrode system. 6mol·L-1 of KOH solution was used as electrolyte. The composite material, activated carbon and Hg/HgO were respectively used as the working electrode, auxiliary electrode and reference electrode. Constant current charge-discharge test used new will electronics co., LTD. Shenzhen CT-3008W-5V3A-S4 charge and discharge tester. Cyclic voltammograms (CV) tests used type CHI660E electrochemical workstation.
Composite materials, acetylene black and PTFE (60% emulsion) was mixed in proportion of 80:15:5. Adding suitable amount of ethanol, and using ultrasonic shock to make it spread evenly. After 80oC water bath heating, solvent is evaporated, getting paste, coating it on the known nickel foam (1cm×1cm). After drying under 60oC for 12 h, the working electrode was made. Foam nickel electrode was pressed into thin slices under the pressure of 10MPa. Auxiliary electrodes are activated carbon electrode. Its preparation process and the working electrode are almost same. The coating active material is activated carbon. The nickel foam covers an area of 2.5cm×2.5cm. This experiment reference electrodes were Hg/HgO electrode; electrolyte was 6mol·L-1 KOH solution.
3. THE RESULTS AND DISCUSSION 3.1. Structure Characterization
Fig. 1 is PANI/MnO2/Graphene composites XRD spectra. 2θ=16°; 20° and 25° are
characteristic peaks of PANI green imine states, respectively corresponding (011), (020) and (200) crystal plane[16-18]. 2θ=16° and 25° diffraction peak owner chain with the vertical and parallel in the polymerization of the periodic structure[19-23], and 2θ=20° diffraction peak was caused by the alternation of polymer chain. Width of peak shape, explaining the PANI was amorphous structure. 22°, 34°, 42° and 55° diffraction peak belongs to -MnO2 (JCPDS 14-0644), corresponding to (120), (031),
(300) and (160) crystal plane respectively. Due to the characteristic 25° peak of graphene, it will be collocated with the characteristic peaks of PANI.
[image:3.596.218.378.589.741.2]
FT-IR spectra of PANI/MnO2/Graphene is shown in Fig. 2. The absorption peak neared at 811cm-1 is C-H key on the aromatic ring plane bending vibration. The absorption peak of 1128cm-1 is the result of C-H in-plane bending vibration. The absorption peak neared at 1299cm-1 is the polymer chain of C-N stretching vibration. 1480cm-1, 1570cm-1 of the absorption peak, respectively is the benzene ring and quinone ring frame vibration absorption peak. In addition to the above characteristic peaks of PANI, at 579cm-1 absorption peak was observed. This is corresponding vibration Mn-O key [14].
Figure 2. FT-IR spectra of PANI/MnO2/Graphene
Figure 3. (a) PANI/MnO2/Graphene TG-DTA curve; (b) PANI, MnO2, PANI/MnO2 and
PANI/MnO2/Graphene TGA curve
[image:4.596.190.405.217.423.2] [image:4.596.90.527.481.690.2]
adsorption of water stripping. There is a smaller mass loss, about 4%, between 120oC~270oC. The DTA curve is a smaller endothermic peak around 200oC. The last quality loss appears about 73.5%, within 270oC~650oC corresponding the decomposition of PANI composites. DAT curve appears near 395oC a wide exothermic peak. The PANI Chain starts to break down for short chain and aniline monomer. The molecular chain of the elements escapes from the system to cause a large loss. DTA curve analysis can determine PANI/MnO2/Graphene composites contained in the PANI.
PANI, MnO2, PANI/MnO2 and PANI/MnO2/Graphene TGA curves are shown in Fig. 3 (b).
According to the TGA curves, a conclusion can be got that MnO2 in PANI/MnO2 composites and
PANI/MnO2/Graphene composites of quality percentage were 21% and 16.7% respectively, the quality
of the content on the nuances of the mainly comes from adding of graphene. The quality retention rate are shown in Tab.1.
Table 1. The quality retention rate
Sample Residual rate
(wt%)
MnO2
(wt%)
PANI 0 —
MnO2 81.7 —
PANI/MnO2 17.1 21
PANI/MnO2/Graphene 13.8 16.7
[image:5.596.246.349.450.543.2]3.2. The microstructure
Figure 4. the SEM of PANI/MnO2/Graphene composites
The SEM of PANI/MnO2/Graphene composites are shown in Fig. 4. PANI/MnO2 nanorod is
deposited uniformly on the electrical conductivity of graphene sheet. The deposition of PANI/MnO2
graphene sheet presents a layer-layer three-dimensional structures. Lamella is clearly visible between the distributions of the PANI/MnO2 nanorods. The presentation layer-layer distribution of the
three-dimensional structure of PANI/MnO2/Graphene ternary composites can provide large specific surface
area.
Fig.5 is the synthesis of PANI/MnO2/Graphene mechanism schematic diagram. Since the
electrochemical polymerization activity of heterogeneous nucleation sites. These active sites reduce the interface between the solid surface and the electrolyte to base. In addition, due to containing aniline, MnSO4 and graphene electrolyte is a homogeneous system. Aniline monomer has an equal
opportunity to the spread of the active site. Thus, the growth of PANI/MnO2 nanorods is relatively
uniform on graphene surface. In the process of the reaction, the electrochemical polymerization of PANI is ongoing, and nanorod is growing in initiation reaction activity point. The reason why it generated nanords is that nanorods array structure existed in the perpendicular to the surface of the graphene substrate uniform, rather than adding graphene were the size of each other as directional random nuclear. MnO2 deposited in anodic with PANI. Both of them were composited together. The
specific equation is as follows:
Mn2+ + 2H2O → MnO2 + 4H+ + 2e-
Figure 5. PANI/MnO2/Graphene synthesis mechanism schematic diagram
3.3. Electrochemical performance study
Figure 6. PANI/MnO2/Graphene cyclic voltammetric curves under different scan rate (1, 2, 5, 10, 20,
50 mV/s)
Fig.6 is PANI/MnO2/Graphene composites curve under different scan rate. The CV curve has
[image:6.596.179.416.431.635.2]
Figure 7. The charging and discharging curves of PANI/MnO2/Graphene composites in different
current density (0.5, 1, 2, 3, 4A·g-1)
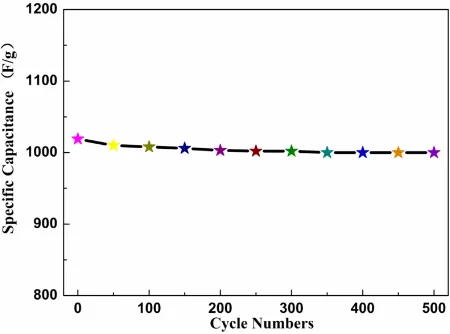
Figure 8. The charging and discharging cycle-life of Graphene/MnO2/PANI at a current density of 0.5
A•g-1 for 500 cycles
The charging and discharging curves of PANI/MnO2/Graphene composites in different current
density (0.5, 1, 2, 3, 4A·g-1) is shown in Fig. 7. The series charge and discharge curve shows in nonlinear relationship, the material is a typical constraint capacitance. Discharge curve apparently shows two major voltage drops. The first appears in 0.55~0.35V because of the internal impedance. The capacitance characteristics of the electrode material make the other potential drop more smoothly, appearing in 0.35~0.3V. The respective specific capacity of discharge curve in different current density are 1019, 759, 561, 270 and 191F·g-1. The specific capacity rate of PANI/MnO2/Graphene composites
is higher than pure MnO2 electrodeposition (277.9F·g-1, 0.5 A·g-1) [17]. The specific capacity rate of
PANI-Ag nano cable array which is made by PANI film (658.3 F·g-1, 5 mA·cm-2) doped with Ni2+ such as reduced oxide Graphene/PANI nano wafer compounds (329.5F·g-1, 5mA·cm-2) and Graphene/PANI nanofibers composites (579.8F·g-1, 0.3A·g-1). High specific capacity is due to special 3D nanostructures of PANI/MnO2/Graphene composites. The recombination of MnO2 and PANI in
[image:7.596.190.407.72.265.2] [image:7.596.185.410.328.495.2]
diffusion. Distribution of layer-layer of the three-dimensional structure enables the electrolyte in the process of charging and discharging to contact fully with more reactive points. Since charge diffusion and redox reaction rate can't keep up with the growth of the current density and active substances are underutilized, the specific capacity under high current density decreases obviously. The results suggest that these particles have relatively higher capacitance than other articles [21-23].
The charging and discharging cycle-life of Graphene/MnO2/PANI at a current density of 0.5 A•g-1
for 500 cycles is shown in Fig. 8. PANI/MnO2/Graphene's initial capacity is 1019 F·g-1. The
specific capacity is 1000 F/g after a 500-cycle, and the capacity retention rate is as high as 98.1%. At the same time, in the process of charging and discharging the electrolyte ions embedded out, which may cause damage to the structure of PANI. The existence of graphene can stabilize the structure of nanorods structure of PANI, and inhibits the mechanical deformation. The capacitance loss is lower than the article [25]. The above asymmetric supercapacitor is advantageous with respect to its high energy and power density, facile fabrication process, and inexpensive and environmentally friendly nature.
4. CONCLUSIONS
The PANI/MnO2/Gaphene composites were synthesized by the electrodeposition method. The
composites present a three-dimensional structure of layer and layer distribution. There are rod structures of PANI distributed uniformly on graphene. MnO2 nanoparticles are uniformly distributed
on the PANI nanorods, which increases the specific surface area. The specific capacity of the PANI/MnO2/Graphene three element complex at the current density of 0.5A·g-1 is up to 1019F·g-1, and
the stability of the 500 cycle is as high as 98.1%. This PANI/MnO2/Graphene ternary composite is
found to be better than that of many literature reports on composition material. The excellent performance is due to the synergistic effect between the components and graphene effectively inhibited the mechanical deformation of the material caused as a supporting material by repeated charging and discharging.
Excellent supercapacitor performance is attributed to using graphene as the matrix. The rod structure of PANI is distributed uniformly on the matrix. MnO2 nanoparticles are distributed evenly on
the PANI nanorods. All of these form a kind of special structure classification.
References
1. G Yu, X Xie, L Pan, Nano Energy, 2 (2013) 213. 2. Z Gao, W Yang, J Wang, Energy Fuels, 27 (2013) 568. 3. Y Li, X Zhao, P Yu, Langmuir, 29 (2013) 493.
4. K. Krishnamoorthy, M. Veerapandian, K. Yun, S. J. Kim, Carbon, 53 (2013) 38. 5. K. Wang, L. Zhang, Int. J. Electrochem. Sci., 8 (2013) 2892.
6. S Konwer, A.K Guha, S.K Dolui, J Mater SCI., 48 (2013) 1729. 7. K. Wang, L. Zhang, Electrochemistry, 81 (2013) 259.
8. P. Chen, T. Xiao, Y. Qian, S. Li, S. Yu, Adv. Mater., 25 (2013) 3192.
10. K. Wang, L. W. Li, T. Z. Zhang, Z. F. Liu, Energy, 70 (2014) 612.
11. T. Zhang, D. Q. Huang, Y. Yang, F. Y. Kang, J. L. Gu, Mater. Sci. Eng. B, 178 (2013) 1. 12. K. Wang, L. W. Li, T. Z. Zhang, Int, J. Electrochem. Sci., 8 (2013) 6900.
13. C. G. Liu, Z. N. Yu, D. Neff, A. Zhamu, B. Z. Jang, Nano Lett., 10 (2010) 4863. 14. J. Yan, J.P. Liu, Z.J. Fan, T. Wei, L.J. Zhang, Carbon, 50 (2012) 2179.
15. J. Che, L. Shen, Y.J. Xiao, J. Mater. Chem., 20 (2010) 1722.
16. H. Hu, Z. B. Zhao, W. Wan, Y. Gogotsi, J. S. Qiu, Adv. Mater., 25 (2013) 2219. 17. W. Chen, L. Yan, P. R. Bangal, Carbon, 48 (2010) 1146.
18. K. Wang, L. W. Li, T. Z. Zhang, Int, J. Electrochem. Sci., 8 (2013) 6252. 19. W. Gao, L. B. Alemany, L. J. Ci, P. M. Ajayan, Nature Chem., 1 (2009) 403. 20. H. Hu, B. Y. Guan, X. W. Lou, Chem., 1 (2016) 102.
21. T. Pichler, Nature Mater., 6 (2007) 332.
22. H. Hu, J. T. Zhang, B. Y. Guan, X. W. Lou, Angew Chem. Int. Ed., 33 (2016) 9666. 23. H. Hu, L. Han, M. Yu, Z. Wang, X. W. Lou, Energy Environ. Sci., 9 (2017) 107. 24. K. Wang, L.W Li., H.X. Yin, W.B. Wan. Plos one, 10 (2015)e0138672.
25. K. Ghosh, C.Y. Yue , M.M. Sk, R.K. Jena. ACS Appl. Mater. Interfaces, 18(2017)15350.
![Fig. 1 is PANI/MnO2characteristic peaks of PANI green imine states, respectively corresponding (011), (020) and (200) crystal plane[16-18]](https://thumb-us.123doks.com/thumbv2/123dok_us/1819574.137567/3.596.218.378.589.741/pani-characteristic-peaks-pani-states-respectively-corresponding-crystal.webp)