Experimental study of temperature stratification in an integrated
collector-storage solar water heater with two horizontal tanks
A. Madhlopa
a,*, R. Mgawi
b, J . Taulo
ca Department of Physics & Biochemical Sciences, b Department of Mechanical Engineering,
Malawi Polytechnic, P/Bag 303, Blantyre 3, Malawi.
c Malawi Industrial Research and Technology Development Centre, P O Box 357, Blantyre, Malawi.
Abstract
The effect of tank-interconnection geometry on temperature stratification in an integrated collector-storage solar water (ICSSW) heater with two horizontal cylindrical tanks has been studied. The tanks were parallel to each other, and separated horizontally and vertically, with the lower tank fitted directly below a glass cover, and half of the upper tank insulated. In addition, a truncated parabolic concentrator was fitted below the tanks, with its focal line along the axis of the upper tank. The heater was tested outdoors with the two tanks connected in parallel (P), and S1- and S2-series configurations, with and without hot water draw-off. Water temperature was monitored during solar collection and hot water draw-offs. For the heat charging process, it was found that only the lower tank exhibited temperature
stratification in the P- and S1-tank modes of operation. There was satisfactory temperature stratification in both tanks in the S2-tank configuration. For the hot water draining process, the P-tank configuration exhibited some degree of stratification in both tanks. A significant loss of stratification was observed in the lower tank, with the upper tank exhibiting practical stratification, when the system was operated in the S1-tank mode. The S2-tank interconnection maintained a satisfactory degree of temperature stratification in both tanks. So, the S2-tank mode of operation was most effective in promoting practical temperature stratification in both tanks during solar collection and hot water draw-offs. Other results are presented and discussed in this paper.
Keywords: temperature stratification, horizontal tanks, tank interconnection
1. Introduction
Temperature stratification is an important process in storage tanks of hot water. Hot water is found in the top part of a stratified storage tank with cold water in the bottom part of the tank. Stratification influences the performance of any solar water heating system (Shah and Furbo, 2003). In particular, improving stratification often leads to substantial improvement in the efficiency of thermal storages relative to a system incorporating thermally mixed storage tanks (Rosen, 2001). So, it is necessary to promote this process in a hot water storage vessel.
Stratification is affected by several factors, which have been investigated by different authors. Duffie and Beckman (1974) report that the location and design of tank connection are important to maintain temperature stratification in the storage tank of a solar water heater. Lavan and Thomson (1977) found that the location and geometry of the inlet port was very important in temperature stratification. Zurigat et al. (1990) examined the influence of different inlet geometries entering a thermocline thermal energy store horizontally. They also found that the inlet geometry significantly influenced the thermal stratification in a thermocline storage tank for Richardson numbers below 3.6. Later, Andersen and Furbo (1999) investigated destratification during hot water discharge in a solar tank with different inlets. They found that mixing during hot water draw-offs decreased the yearly thermal performance of the solar system. Rosen (2001) describes mixing as the major cause of loss of stratification, with significant mixing losses occurring during lengthy storing periods. The author also repots that a vertical cylindrical tank with a hot water inlet (outlet) at the top and cold water inlet (outlet) at the bottom is used, in most cases in practice. Indeed, this tank design exhibits a higher degree of stratification than a horizontal one. However, the former tank configuration increases the height of a solar water system, rendering it less aesthetic. Consequently, horizontal tanks have still found application in hot water storage, including integrated collector-storage solar water (ICSSW) heaters.
concentrator. They found that the systems operated efficiently and were suitable for practical applications. Later on, Tripanagnostopoulos et al. (2002) developed four ICSSW heaters with stationary compound parabolic concentrating (CPC) reflectors. The systems consisted of single (STS models) and double (DTS models) horizontal cylindrical tanks placed in symmetric and truncated CPC troughs. In particular, these authors used two cylindrical tanks in the DTS-1 and DTS-2 models to increase temperature stratification. Part of the upper tank of the DTS-1 model was thermally insulated while the lower tank was not. For the DTS-2 model, a higher proportion of the cylindrical surface of the upper tank was thermally insulated than that of the lower tank. This insulation pattern shows that the upper tanks, in both DTS models, would store thermal energy better than their corresponding lower tanks, with the performance of thermal collection being opposite to that of thermal storage. The tanks in the DTS models were connected in series from the top part of the lower tank to the bottom part of the upper tank. They found that asymmetric CPC reflectors contributed to lower thermal losses and that the two interconnected tanks resulted in effective water temperature stratification. However, Fig. 17 of this reference shows that the water temperature in the top part of the lower tank was distinctly higher than the temperature in the bottom part of the upper tank for the DTS-1 system model, which indicates that water in the top part of the lower tank was hotter than that in the bottom part of the upper tank during heat
charging. For the DTS-2 model, the water temperature in the top part of the lower tank was again slightly higher than the temperature in the bottom part of the upper tank during heat charging. Consequently, hot water from the top part of the lower tank would mix with water from the bottom part of the upper tank as the water flows from the lower tank into the upper one, resulting in loss of stratification.
The objective of this study was to investigate the effects of tank-interconnection configuration on the stratification of water temperature in an ICSSW heater with two horizontal cylindrical tanks incorporated in a stationary parabolic concentrating reflector. Half of the upper tank was thermally insulated on the top cylindrical surface while the lower tank was bare. The system was tested with the tanks connected in parallel (P-connection) and series configurations, with and without hot water draw-off at sunset. For the series-tank interconnection, the two tanks were connected with: a) one insulated hose pipe from the top part of the lower tank to the bottom part of the upper tank (S1-tank
exhibited satisfactory temperature stratification in both tanks during solar collection and hot water draw-offs. Other results are presented and discussed in this paper.
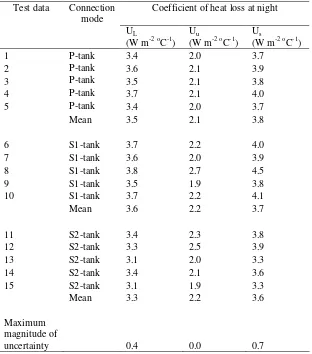
2. System description
An ICSSW heater was designed and constructed with two horizontal cylindrical tanks made of galvanized-iron (0.8 mm thick), and separated horizontally and vertically (Fig. 1). The tanks were painted matt black on the exterior surface and had a capacity of 61.8 litres each. One of these tanks was located in the upper part while the other tank was located in the lower part of the system. Half of the upper tank was insulated with waste cotton from David Whitehead & Sons (MW) Ltd textile industry. A clear glass cover (4 mm thick) was fitted directly above the lower tank (which was properly located in the centre of the aperture) to allow incoming solar radiation reach the tanks, with the system having an acceptance angle (α) of about 120o. The cover was inclined at 16o to the horizontal to optimize solar radiation
collection at the Malawi Polytechnic (15o 48′ S, 35o 02′ E), and the collector aperture was 1.1 m2. Further, a truncated
stationary parabolic concentrator with focal line along the axis of the upper tank, was fitted under the tanks. The incident and reflected rays of beam radiation were traced, with the sun assumed to be overhead at the Tropic of Cancer, test site and Tropic of Capricorn (on the same meridian). This optical analysis shows that the system can absorb most of the reflected beam radiation (from reflector) at normal (or nearly normal) angle of incidence. The loss of beam radiation through multiple reflections is highest during the month of June when the sun is farthest from the test site. It should also be pointed out that the location of the lower tank and wide acceptance angle allow the system to capture a significant proportion of the incident diffuse radiation. An air gap of 0.05 m was left between the transparent cover and lower tank. Hard board and waste cotton were used as insulation materials. The waste cotton was sandwiched between a galvanized-iron sheet case (on the outside) and hard board inside, with an aluminium foil forming the inner most layer of the bottom and vertical faces of the system. The design details of the system are presented in Table 1.
3. Experimentation 3.1 System mounting
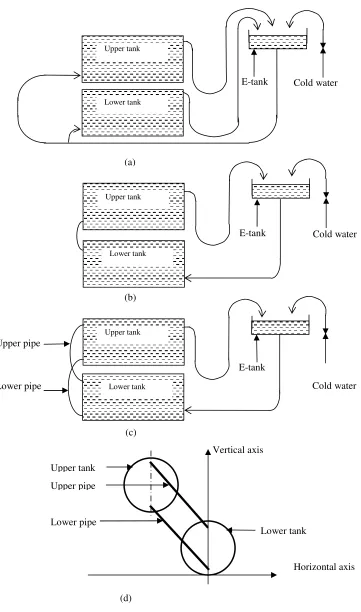
connected with insulated hose pipes (12.7 mm diameter) : a) parallel to each other (P-connection), b) in series with one insulated hose pipe from the top part of the lower tank to the bottom part of the upper tank (S1-tank interconnection), and c) in series with two insulated hose pipes of which one pipe (lower pipe) linked the bottom part of the lower tank to the bottom part of the upper tank while the other pipe (upper pipe) linked the top part of the lower tank to the top part of the upper tank (S2-tank interconnection). Outlet pipes from the tanks were bent down to form U-shaped tubes before rising up into an expansion tank (E-tank) to avert reverse flow of cooled water from the outlet tubes into the collector-storage tanks, during the periods of low insolation or at night. In addition, the arm of the U-tube adjacent to the collector-storage tank was insulated up to the lowest part of the U-section. Details of the experimental set up are shown in Fig. 2.
3.2 Meteorological conditions
The experiments were conducted from September to December 2003, and in October 2004 in Malawi. The climate in the country is tropical continental with a distinct rainy season from November to April and dry season from May to October. It is very cold from May through July, generally hot and dry from August to October, and hot and wet from November through March/April. The clearness of the sky is generally high from August through October in the country (Diabaté et al., 2004). Consequently, this is a suitable period for outdoor tests of solar systems. The system was tested under different weather conditions: the months of September and October fall within the hot dry season (generally clear) while November and December are within the rainy season (frequently cloudy). Moreover, the sun was to the north, close to overhead at and to the south of the test site in September, November and December respectively. So, the system received solar rays from different directions during the test period (September through December).
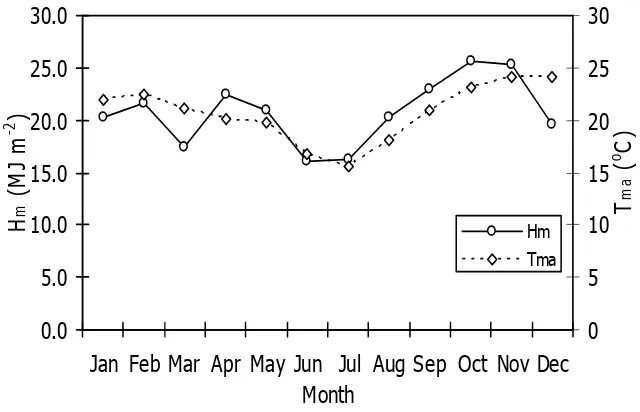
Fig 3 shows the mean monthly daily global solar radiation and ambient temperature recorded during the year 2003 at Chichiri Weather Station (15o 47′ S, 35o 02′ E) which is nearest to the Malawi Polytechnic. There was no pyranometer
for measurement of solar radiation at this weather site. So, the reported levels of solar radiation were computed from the mean monthly daily duration of sunshine (Masson, 1966; Zingano, 1986). It is observed that the mean monthly daily global radiation was lowest in June and highest in October, which is ascribed to the position of the sun relative to the earth (the sun is at the tropic of cancer on 21st June, Equator on 21st March and 21st September, and Tropic of
Capricorn on 21st December). The month of July exhibited the lowest mean monthly daily ambient temperature, with
Two mercury-in glass thermometers (one at the bottom (Tb) and the other on the top (Tt) parts of each collector-storage
tank) were used to measure the temperature of water during solar collection and hot water draw-offs. The ambient temperature was monitored using a minimum and maximum mercury-in-glass thermometer placed in a room with louvered windows, and the louvers were kept open to allow free circulation of air. Wind velocity was measured using a Casella low-speed air meter (N 1462) while the intensity of global solar radiation was measured by a first-class Kipp & Zonen pyranometer (CM 6B) mounted in the plane of the inclination of the transparent cover, and connected to a Kipp & Zonen solar integrator (CC 14). The water heating process was monitored from 06:00 to 17:00 hrs each day, and hot water was drawn off at sunset or stored from 17:00 to 06:00 hrs the next day. It should be noted that the tanks were simultaneously exposed to the same meteorological conditions. So, a tank-by-tank analysis was used to establish the trends of thermal performance for the different operational modes under varying weather conditions.
3.3 Hot water draw-off
Hot water was drained from the system and temperatures of water in the tanks recorded at intervals of 20 litres of the draw-off. For the P-tank connection, the two tanks were simultaneously drained into separate buckets until a volume of 10 litres of the warm water was drawn from each tank. During the draw-offs, the outlet pipes descended from the same height (outlet level of the upper tank) into the containers to ensure comparable flow rates from both tanks. The drained water from the individual tanks was mixed to obtain a total volume of 20 litres for each draw-off. For the S1- and S2-tank interconnections, the volume of each draw off was also 20 litres for performance comparison with the P-S2-tank mode of operation.
3.4 Data processing
The mean temperatures of water at the beginning (Tmi) and end (Tme) of the heating process were used to compute the
amount of heat (q) collected by each tank at the end of the heat charging process (17:00 hrs):
q = MCpw ((Tme - Tmi) (1)
where Tme = 0.5 (Tbe + Tte), Tmi = 0.5 (Tbi + Tti), Cpw is the specific heat capacity of water at constant pressure,
and M is the mass of water.
The total amount of heat (Qw) absorbed by water is equal to the sum of the thermal energy collected by the lower (qL)
within a period of time t = ti to t = te. In this study, the mean daily system collection efficiency of ηcs was calculated as
follows (Tripanagnostopoulos et al., 2002):
ηcs = Qw/QR = (qL + qu)/ QR = ηcL + ηcu (2)
where QR = Aa (He – Hi), Hi is the total radiation received per unit area from sunrise to t= ti, He is the total radiation
received per unit area from sunrise to t = te, and ηcL and ηcu are mean daily efficiencies of the lower and upper tanks
respectively. The computation of ηcL and ηcu was necessary for comparison of the performance of the two tanks.
Heat is also lost from the system during periods of low insolation and at night. The coefficient of thermal losses (U) at night (from 17:00 to 6:00 hrs the next day) was calculated for the lower (UL) and upper (Uu) tanks, and the whole
system (Us) by using the relationship reported by Aranovitch et al. (1986):
U = (mc/∆tA)ln [(Tme – Tman)/( Tmf – Tman)] (3)
where Tmf is the final average water temperature the next morning, mc ∆is the thermal mass a of a tank
including water (or the whole system), A is the external surface area of a tank (or the whole system) and ∆t is the time interval during the night.
Finally, the efficiency of heat retention (ηr) is given by (Smyth et al., 2003):
ηr = (Tmof – Tman)/( Tmoe – Tman) (4)
The efficiency of heat retention was also calculated for the lower (ηrL) and upper (ηru) tanks, and the whole system
(ηrs).
4.0 Results and discussion 4.1 Water temperature variation
4.1.1 Heat Charging
Fig.4 shows the variation of water temperature with time during solar collection on typical days. Generally, maximum temperatures were recorded around 14:00 to 15:00hrs on sunny days. For the parallel tank connection (P-tank
connection), it is seen that the temperature of the water in the top part of the lower tank (TLt) was highest (TLt = 72 oC)
at 15:00 hours. The bottom temperature of this tank (TLb) is also distinctly lower (TLb = 57 oC ) than TLt ,which shows
presence of temperature stratification in the lower (an important factor for hot water storage). This trend of temperature stratification is attributed to the fact that the tank received solar radiation on both the top and bottom parts, with more solar energy captured by the former part of the tank. Destratification in the lower tank started after the water attained a maximum temperature, due to top heat loss, with little or no temperature stratification by 06:00 hrs the next morning when energy recharging resumed. In contrast, temperature destratification in the upper tank commenced in the morning, with the temperatures of water in the top and bottom parts equal during the most part of the day (Tut = Tub =
50 oC at 15:00 hours). Probably, it is because this tank was heated from the bottom side only, and the thermal energy was quickly transferred to its top part through natural convection. It should also be noted that Tub < TLb. However,
temperature stratification in the upper tank was observed at 06:00 hrs, attributed to higher bottom heat loss at night.
For the tanks connected with one pipe from the top part of the lower tank to the bottom part of the upper tank (S1-tank interconnection), it is seen that the trend of the variation of water temperature during solar collection is similar to that of the P-tank configuration. There is temperature stratification in the lower tank with no stratification in the upper tank during the most part of the solar collection period. Moreover, the temperature of water in the top part of the lower tank is higher than that in the bottom part of the upper tank, in spite of the interconnection between the two parts of the tanks. Tripanagnostopoulos et al. (2002) also observed a higher temperature in the top part of the lower tank than that in the bottom part of the upper tank for the DTS models in which the tanks were connected in series (top part of the lower tank connected to the bottom part of the upper tank). This shows that there is little (or no) heat transfer from the top part (hotter) of the lower tank to the bottom part (cooler) of the upper tank.
For the S2-tank interconnection, there is again temperature stratification in the lower tank during the day, with TLt = 64 oC and T
60 oC and T
ub 53 oC at 15:00 hrs, which indicates that the S2-tank interconnection configuration promotes temperature
stratification in both tanks. It should also be noted that the corresponding temperatures in the tanks are now comparable (TLt≈ Tut, TLb≈ Tub).
We observed similar trends of the variation of temperature stratification during heat charging on other days (including partly-cloudy days) for each operational mode. This indicates that the system captured a significant proportion of the diffuse radiation. However, the maximum recorded temperatures on partly-cloudy days were lower than those observed on clear days. In addition, we tried to change the connection configuration once a day around solar noon (from P- to S1-tank, P- to S2-tank, S1- to S2-tank and reverses of each of these connection changes). We observed that there was an immediate switchover of the trend of temperature stratification for the P-S2 and S1-S2 changes in the tank
connection configurations, with the P-S1 changes producing no reversal in the trend of temperature stratification. If the top part of the upper tank was also exposed to solar radiation, this tank would also exhibit temperature stratification in the P- and S1-modes of operation. However, the design with an exposed top part of the upper tank would mask the effect of tank-interconnection on temperature stratification during solar collection.
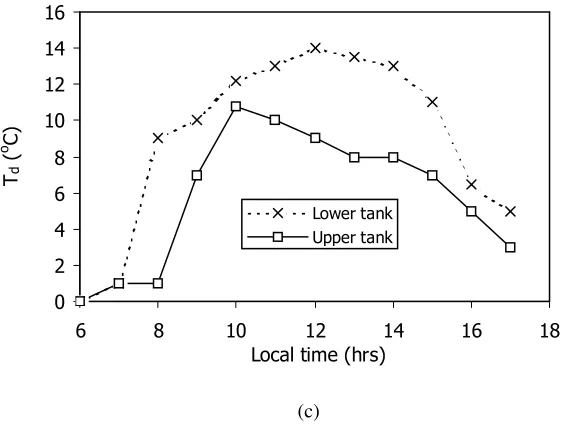
The difference (Td) between the temperatures in the top and bottom parts of a tank (Td = Tt – Tb), on typical days, is
shown in Fig. 5. For the P-tank connection configuration, it is observed that Td increases to a maximum level in the
lower tank but it decreases to zero in the upper tank during the collection period, which again indicates that there is temperature stratification in the lower tank and destratification in the upper tank during heat charging. For the S1-tank interconnection, a similar trend is observed (temperature stratification in the lower tank with destratification in the upper tank during solar collection). For the S2-tank interconnection, it is observed that Td increases to a maximum
level in both the lower and upper tanks, which again indicates that there is temperature stratification in both tanks during heat charging.
Table 2 shows the temperatures of water at the beginning and end of the collection period (6:00 to 17:00 hrs
respectively) for four consecutive days. For the P-tank connection configuration, there is temperature stratification in the lower tank, with the upper tank exhibiting no stratification at the end of the solar collection process. In each tank, the next-morning mean temperatures of water were below 40 oC, the minimum required temperature for the hot water
configuration, the trend of temperature stratification is similar to that of the P-tank connection configuration. The next-morning mean temperatures of water in the tanks were again below 40 oC. For the S2-tank interconnection, there is
temperature stratification in both tanks. The next-morning mean water temperatures were greater than 40 oC in the
upper tank on the 4th and 5th days. The highest value of the next-morning temperature observed by Chaurasia and
Twidell (2001), in the top part of an ICSSW heater, was 34 oC, which compares very well with our findings.
4.1.2 Draw-off characteristics
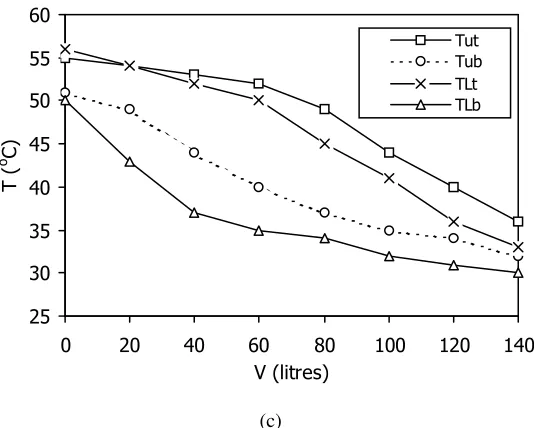
Fig.6 shows the variation of water temperature with the volume (V) of hot water draw-offs at sun set. For the P-tank connection, it is seen that the temperature of water in the top part of the lower tank (TLt) is distinctly highest before and
during water drainage until all the hot water is drawn off (TLt = 58 oC at V = 0). The tank exhibits some temperature
stratification. In contrast, there is no stratification in the upper tank (Tut = Tub = 44 oC) at V = 0, but it starts as soon as
some hot water is drained out from the top part and cold water introduced into the bottom part of the tank until all the hot water is drawn off. The observed trend of stratification is attributed to the pattern of cold water flow into the bottom parts of both tanks, which prevents mixing of cold and warm water in the tanks. However, it should be noted that the two horizontal tanks operate as separate units in the P-tank configuration. Consequently, the small diameter of each tank limits the degree of stratification.
For the S1-tank interconnection, the lower tank exhibits stratification at V = 0. However, the temperature of water in the top part of this tank (TLt) dropped from 55 oC (at V = 0) to 38 oC (at V = 60 litres), resulting in a significant loss of
stratification. In the upper tank, there is no temperature stratification (Tut = Tub = 41 oC) at V = 0. Both Tut and Tub
increase to 45 oC (a peak) at V = 40 litres in this tank. It is nevertheless observed that stratification starts when V > 40
litres. These observations indicate that there is mixing of the hotter water from the top part of the lower tank and cooler water from the bottom part of the upper tank. This mixing process continues until the temperature in the top part of the lower tank (TLt) is equal to (or less than) that in the bottom part of the upper tank (Tub), followed by progressive
stratification across the two tanks (from the bottom part of the lower tank to the top part of the upper tank, TLb < TLt <
Tub <Tut).
For the S2-tank interconnection, it is seen that both tanks exhibit temperature stratification for V ≥ 0, with steady
60 litres), which is more satisfactory than the corresponding drop (55 o to 38 oC) for the S1-tank interconnection
observed within 0 ≤ V ≤ 60 litres. The temperatures of water in the bottom parts of the two tanks are comparable (TLt≈
Tut) at V = 0, but TLb is lower than Tub for V > 0, which indicates that cold water introduced into the bottom part of the
lower tank does not directly flow into the bottom part of the upper tank, probably due to water density and pressure factors.
4.2 Thermal collection efficiency
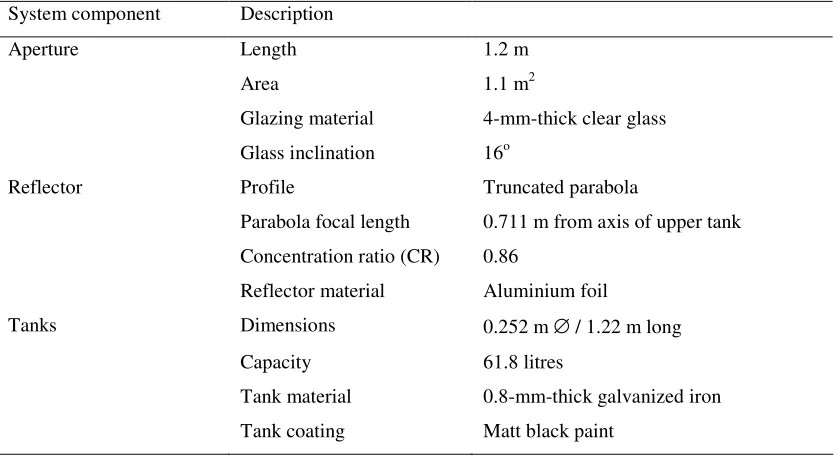
Inter-tank thermosiphoning is required, in a double-tank ICSSW heater with a larger insulated portion of the top part of the upper tank than the top part of the lower tank, to reduce heat loss to ambience. In this study, the daily proportions of thermal energy collected by each tank and the whole system at the end of the heat charging process are presented in Table 3 (Maximum observed magnitudes of combined uncertainty in the experimental results are reported in the present work). For the P-tank connection configuration, it is seen that the proportions of thermal energy collected by the lower tank (ηcL) are all higher than the corresponding proportions of thermal energy collected by the upper tank
(ηcu), commensurate with the variations of water temperature observed in Section 4.1. There is no exchange of thermal
energy, through the working fluid, between the two tanks. It should nevertheless be noted that the lower tank has a higher rate of heat loss than the upper tank. Consequently, the whole system would be less efficient if most of the thermal energy captured by the lower tank is not transferred into the upper tank through natural convection.
For the S1-tank interconnection configuration, ηcL is again higher than ηcu which indicates that there is little or no
inter-tank thermosiphoning. This observation is consistent with the trends of water temperature (temperatures in the top and bottom parts of the lower tank are higher than the corresponding temperatures in the upper tank).
For the S2-tank interconnection, ηcL is comparable with ηcu which indicates that there is a slight degree of inter-tank
the upper tank is insulated. Our results are consistent with findings of Vaxman and Sokolov (1986) who report that the height from the collector’s top to the tank’s bottom should be in the range of 30-80 cm for a thermosiphonic solar system.
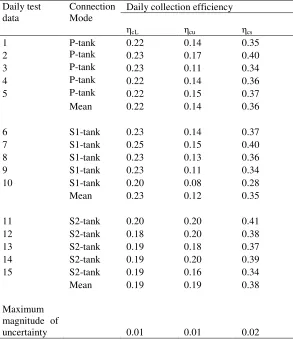
4.3 Thermal losses at night
Table 4 shows the variation of the coefficient of thermal loss for the lower (UL) and upper (Uu) tanks, and the whole
system (Us) at night. It is observed that Uu is consistently lowest, with Us being highest for all the connection modes.
This is expected because the lower tank is completely bare while the upper tank is partially insulated. So, the lower tank contributes a higher proportion of thermal losses of the system. Our results are comparable with findings of Tripanagnostopoulos et al. (2002) and Smyth et al. (2003).
4.4 Efficiency of heat retention at night
Table 5 shows the variation of the efficiency of heat retention by the lower (ηrL) and upper (ηru) tanks, and the whole
system (ηrs). It is observed that the lower tank retained the least amount of heat, with the upper tank exhibiting the
highest values for all the connection configurations. Again, this is commensurate with the values of the coefficient of heat loss reported in Section 4.3. It is seen that an average retention efficiency of about 35±3 % was obtained, which compares well with the findings of Chaurasia and Twidell (2001) for an ICSSW system with a transparent insulation material (TIM) fitted between the absorber plate and glass cover.
5. Conclusion
A solar water heater of the integrated variety, with two horizontal cylindrical tanks has been tested in three different operational modes: P-, S1- and S2-tank interconnection configurations. Water temperature was monitored during solar collection and hot water draw-offs. For the heat charging process, there was temperature stratification in the lower tank, with no stratification in the upper tank when the system was operated in the P-tank mode. The variations of the trends of temperature stratification in the S1-mode were similar to those of the P-tank connection configuration. Both tanks exhibited a satisfactory degree of stratification, with inter-tank thermosiphoning, in the S2-tank operational mode
S1-tank mode. Again, it was found that both tanks exhibited a satisfactory degree of stratification in the S2-tank mode of operation. Consequently, it appears that the S1-tank mode of operation would be suitable in a double-tank ICSSW heater if a) the water temperature in the top part of the lower tank is anticipated to be equal to or less than that in the bottom part of the upper tank, and b) inter-tank thermosiphoning is not required. Otherwise, the S2-tank
Nomenclature
A external surface area of a tank (or the system) (m2)
Aa aperture surface area of the system (m2)
Cpw specific heat capacity of water at constant pressure (J kg-1oC-1)
Hd daily global solar radiation (MJ m-2)
He total solar radiation received by a unit surface area from sunrise to time t = te (J m-2)
Hi total solar radiation received by a unit surface area from sunrise to time t = ti (J m-2)
mc thermal mass of the system (J K-1)
M mass of water (kg)
q heat collected per tank (MJ)
QR amount of solar energy intercepted by system (J)
Qw amount of heat absorbed by water (J)
Tb temperature of water at the bottom part of a tank (oC)
Tt temperature of water at the top part of a tank (oC)
Tmi mean temperature of water at the beginning of the solar collection process (oC)
Tme mean temperature of water at the end of the solar collection process (oC)
U coefficient of heat loss at night (W m-2oC-1)
V volume of hot water drawn off (litres) ∆t time interval during the night (s)
α acceptance angle
ηc mean daily solar collection efficiency
ηr mean efficiency of heat retention
Subscripts
c collection
e end
f final
i initial L lower tank
man mean ambient air at night r retention
Acknowledgements
The authors are very grateful to the Malawi Environmental Endowment Trust (MEET) for the financial support. The Malawi Polytechnic and Malawi Industrial Research and Technology Development Centre are also acknowledged for the logistical and technical support.
References
Andersen, E., Furbo, S., 1999. Thermal destratification in small standard solar tanks due to mixing during tapping. In proceedings of the ISES Solar World Congress 1999, pp.1197-1206. Aranovitch, E., Gilliaert, D., Gillet, W.B., Bates, J.E., 1986. Test methods for water heating
systems. In Proceedings of the 5th meeting of European Solar Collector and Systems Group,
Seville, Spain, pp.149-194.
Chaurasia, P.B.L., Twidell, J., 2001. Collector cum storage solar water heaters with and without transparent insulation material. Solar Energy 70, 406-416.
Diabaté, L., Blanc, Ph., Wald, L., 2004. Solar Climate in Africa. Solar Energy 76, 733-744. Duffie, J.A., Beckman, W.A., 1974. Solar Engineering of Thermal Processes. Wiley
Interscience, New York, pp. 252-256.
Garg, H.P., Avanti, P., Dutta, G., 1997. Non-dimensional parametric analysis for performance prediction of integrated collector-storage solar water heating system. In proceedings of
National Solar Energy Conversion – 97, 22-24 December, Chanai, India (Roa A., Sethumadhavan R and Carthikeyan G., eds), pp. 1.8, Auna University, Chennai, India.
Holman, J.P., Gajda, W.J., 1984. Experimental Methods for Engineers, 4th ed. MacGraw-Hill Book Company, New York, pp.50-57.
Kalogirou, S.A., 1999. Performance enhancement of an integrated collector storage hot water system. Renewable Energy 16, 652-655.
Kipp & Zonen, 1992. Instruction Manual: Pyranometer CM 6B/7B. Kipp & Zonen, Delft. Lavan, Z, Thomson, J., 1977. Experimental study of thermally stratified hot water storage tanks.
Solar Energy 19, 519-524.
Mathioulakis, E., Voropoulos, K., Belessiotis V., 1999. Assessment of uncertainty in solar collector modeling and testing. Solar Energy 66, 337-347.
Rosen, M.A., 2001. The exergy of stratified thermal energy storges. Solar Energy 71, 173-185. Shah, L.J., Furbo, S., 2003. Entrance effects in solar storage tanks. Solar Energy 75, 337-348. Smyth, M., Eames, P.C., Norton, B., 2003. Heat retaining integrated collector/storage
solar heaters. Solar Energy 75, 27-34.
Tripanagnostopoulos, Y., Souliotis, M., Nousia, Th., 1999. Solar ICS systems with two cylindrical storage tanks. Renewable Energy 16, 665-668.
Tripanagnostopoulos Y., Souliotis, M., Nousia, Th., 2002. CPC type integrated collector storage systems. Solar Energy 72, 327-350.
Tripanagnostopoulos, Y., Souliotis, M., 2004. ICS solar systems with horizontal (E-W) and (N-S) cylindrical water storage tank. Renewable Energy 29, 73-96.
Vaxman, M., Sokolov, M., 1986. Effects of connecting pipes in thermosyphonic solar systems. Solar Energy 37, 323-330.
Zingano B.W (1986) An Appraisal of Solar Water Heaters in Malawi. A Master of Science Thesis, University of Malawi, Zomba.
Table 1: Design details of the ICS solar water heater. System component Description
Aperture Length 1.2 m
Area 1.1 m2
Glazing material 4-mm-thick clear glass Glass inclination 16o
Reflector Profile Truncated parabola
Parabola focal length 0.711 m from axis of upper tank Concentration ratio (CR) 0.86
Reflector material Aluminium foil
Tanks Dimensions 0.252 m ∅ / 1.22 m long
Capacity 61.8 litres
Table 2: Water temperature at the bottom and top parts of the tanks, at different mean ambient temperature (Tma) .
Day/time Tma Lower tank Upper tank
Connection
configuration TLb TLt TUb TUt
(oC) (oC) (oC) (oC) (oC)
P-tank Day 1
6:00 hrs 23 27 27 27 27
17:00 hrs 26 54 60 47 47
Day 2
6:00 hrs 25 32 34 34 36
17:00 hrs 28 52 63 52 52
Day 3
6:00 hrs 22 32 33 34 35
17:00 hrs 24 54 60 49 49
Day 4
6:00 hrs 22 31 33 34 36
17:00 hrs 23 52 57 47 47
Next morning 22 32 33 34 36
S1-tank Day 1
6:00 hrs 22 27 27 27 27
17:00 hrs 22 51 58 43 43
Day 2
6:00 hrs 22 28 30 31 33
17:00 hrs 24 56 63 50 50
Day 3
6:00 hrs 23 34 36 36 38
17:00 hrs 29 59 65 54 54
Day 4
6:00 hrs 25 34 38 37 40
17:00 hrs 27 56 61 52 52
Next morning 25 35 36 38 40
S2-tank Day 1
6:00 hrs 23 28 28 28 28
17:00 hrs 26 51 56 53 56
Day 2
6:00 hrs 26 31 33 35 40
17:00 hrs 27 48 53 49 53
Day 3
6:00 hrs 27 31 33 35 39
17:00 hrs 29 53 58 55 58
Day 4
6:00 hrs 25 36 37 37 44
17:00 hrs 30 55 60 57 61
[image:18.612.130.493.122.684.2]Table 3: Daily collection efficiency by the lower (ηcL) and upper (ηcu) tanks, and the whole
system (ηcs)
Daily collection efficiency Daily test
data Connection Mode
ηcL ηcu ηcs
1 P-tank 0.22 0.14 0.35
2 P-tank 0.23 0.17 0.40
3 P-tank 0.23 0.11 0.34
4 P-tank 0.22 0.14 0.36
5 P-tank 0.22 0.15 0.37
Mean 0.22 0.14 0.36
6 S1-tank 0.23 0.14 0.37
7 S1-tank 0.25 0.15 0.40
8 S1-tank 0.23 0.13 0.36
9 S1-tank 0.23 0.11 0.34
10 S1-tank 0.20 0.08 0.28
Mean 0.23 0.12 0.35
11 S2-tank 0.20 0.20 0.41
12 S2-tank 0.18 0.20 0.38
13 S2-tank 0.19 0.18 0.37
14 S2-tank 0.19 0.20 0.39
15 S2-tank 0.19 0.16 0.34
Mean 0.19 0.19 0.38
Maximum magnitude of
Table 4: Coefficient of heat loss at night for the lower (UL) and upper (Uu) tanks, and the whole system (Us).
Test data Connection
mode Coefficient of heat loss at night UL
(W m-2oC-1) Uu
(W m-2oC-1) Us
(W m-2oC-1)
1 P-tank 3.4 2.0 3.7
2 P-tank 3.6 2.1 3.9
3 P-tank 3.5 2.1 3.8
4 P-tank 3.7 2.1 4.0
5 P-tank 3.4 2.0 3.7
Mean 3.5 2.1 3.8
6 S1-tank 3.7 2.2 4.0
7 S1-tank 3.6 2.0 3.9
8 S1-tank 3.8 2.7 4.5
9 S1-tank 3.5 1.9 3.8
10 S1-tank 3.7 2.2 4.1
Mean 3.6 2.2 3.7
11 S2-tank 3.4 2.3 3.8
12 S2-tank 3.3 2.5 3.9
13 S2-tank 3.1 2.0 3.3
14 S2-tank 3.4 2.1 3.6
15 S2-tank 3.1 1.9 3.3
Mean 3.3 2.2 3.6
Maximum magnitude of
Table.5: Efficiency of heat retention under different values of minimum (min) and maximum (max) ambient temperature at night, the lower (ηrL) and upper (ηru) tanks, and the whole system (ηrs).
Connection
mode Day Ambient temperature Efficiency of heat retention Min
(oC) Max (oC) η(%) rL η(%) ru η(%) rs
P-tank 2 23 28 20 40 28
P-tank 3 20 28 18 30 23
P-tank 4 21 26 17 36 25
P-tank Next morning 18 26 20 40 28
Mean 20 27 19 37 26
S1-tank 2 20 24 7 31 16
S1-tank 3 23 23 25 43 32
S1-tank 4 26 29 24 43 32
S1-tank Next morning 25 26 28 46 36
Mean 23 25 21 41 29
S2-tank 2 23 23 19 38 29
S2-tank 3 25 27 22 42 32
S2-tank 4 27 28 33 46 40
S2-tank Next morning 25 26 31 45 38
Mean 25 26 26 43 35
Maximum magnitude of
(a)
(b)
Fig.1 : Schematic presentation of an ICSSW heater showing its: a) perspective view, and b) cross-section of the system with AÁ = 0.940 m, ÁBÉ = parabolic section, OB = focal length of the parabola (0.711 m), EÉ = vertical section (0.705 m), B = the vertex of the parabola. (Not drawn to scale).
Glass cover Lower tank cover
Insulation
Glass cover Lower tank, 0.252 m φ
B É
Upper tank, 0.252 m φ
Á
A E
α
0.720 m
0.120 m 1.060 m 0.120 m
0.080 m 0.080 m
0.450 m
0.151 m radius
(d)
Fig. 2: Details of water flow pattern for : a) P-, b) S1-, and c) S2-tank connections; with d) showing the connection of pipes for the S2-configuration with respect to the vertical and horizontal axes.
Cold water Lower tank
E-tank Upper tank
(b) (a)
Cold water E-tank
Upper tank
Lower tank
(c) Lower pipe
Upper pipe
Cold water Lower tank
E-tank Upper tank
Horizontal axis Vertical axis
Lower tank Upper tank
Upper pipe
!
"
#
$
!
%
#
[image:24.612.153.473.225.431.2]$
Fig. 3: Variation of mean monthly daily global radiation (Hm) and ambient
& ' ( )
' ) & ' )
* + ! ,#
$
!
%
#
$ $ $* $*
(a)
& ' ( )
' ) & ' )
* + ! ,#
$
!
%
#
$ $ $* $*
(b)
Hd = 32.5 MJ m-2& ' (
' ) & ' )
* + ! ,#
$
!
%
#
$ $ $* $*
(c)
Fig.4: Variation of water temperature (T) in the lower and upper tanks on typical days with a) parallel tanks (26th September, 2003), b) S1- tank interconnection (14th October,2003) and c) S2-tank
(3rd November, 2003). The values of the daily intensity of global solar radiation (H
d) are also
indicated on the graphs.
' ) & ' )
* + ! ,#
$
!
%
#
* . /
0 /
(a)
0 5 10 15 20 25
6 8 10 12 14 16 18
Local time (hrs)
Td
(
o C
)
Low er tank
Upper tank
& ' ) & '
' ) & ' )
* + ! ,#
$
!
%
#
* . /
0 /
[image:28.612.175.458.78.290.2](c)
Fig. 5: Variation of temperature difference (Td) in the lower and upper tanks with a) P-, b) S1- and c) S2-tank
& & '
& ' ) &
1 ! + ,#
$
!
%
#
$ $ $* $*
(a)
& & '
& ' ) &
1 ! + ,#
$
!
%
#
$
$
$*
$*
& & '
& ' ) &
1 ! + ,#
$
!
%
#
$ $ $* $*
[image:30.612.176.443.111.325.2](c)