Int. J. Electrochem. Sci., 14 (2019) 2383 – 2390, doi: 10.20964/2019.03.81
International Journal of
ELECTROCHEMICAL
SCIENCE
www.electrochemsci.orgShort Communication
Co–Ni Alloy Superlattice Electrodeposited Using a Rectangular
Pulse Current over a Megahertz Frequency Range
M. Saitou
University of the Ryukyus, Department of Mechanical Systems Engineering, 1 Senbaru Nishihara-cho Okinawa, 903-0213, Japan.
E-mail: [email protected]
Received: 7 December 2018 / Accepted: 7 January 2019 / Published: 7 February 2019
Co–Ni alloy superlattices with a periodic composition modulation of Co were electrodeposited on a Cu plate using 0.3 and 0.35 MHz rectangular pulse currents. The energy dispersive X-ray spectroscopy analysis demonstrated that the Co content in the Co-Ni atomic layers electrodeposited at 0.3 MHz was approximately two times higher than that at 0.35 MHz. The Co–Ni alloy superlattices were comprised of unit lattices with high and low Co content atomic layers. The X-ray diffraction analysis demonstrated that the Co–Ni alloy superlattices had face-centered cubic crystal structures, and one Bragg diffraction peak from the Co–Ni alloy superlattice was observed in the small-angle X-ray scattering region. The lattice constants of the unit lattices were shown to be controlled by the number of Co–Ni atomic layers with either high or low Co contents.
Keywords: Co–Ni alloy; Superlattice; Composition modulation: Small-angle X-ray scattering, Lattice constant
1. INTRODUCTION
Co–Ni alloy superlattices have been extensively studied because of their unique properties such as hydrogen absorption [1], giant magnetoresistance [2–4], magnetic anisotropy [5–6], anti-corrosion [7], and wear resistance [8]. Electrodeposition for the production of Co–Ni alloy superlattices is an attractive technique owing to its advanced control over the Co–Ni alloy multilayer deposition [2–3]. In particular, their compositions [9] determine the crystalline structures of the Co–Ni alloy superlattices and affect the magnetic properties. Hence, the effects of the electrochemical parameters on the compositions have been investigated [10–11].
X-ray diffraction at the incident angle (θ>15°) termed wide-angle X-ray scattering (WAXS) [13]. SAXS provides information on the interface roughness, interface morphology, and thickness [14]. WAXS provides information on the mean interface roughness, disordered structure, and mean thickness [15– 16]. Co–Ni alloy superlattices formed by electrodeposition were reported to exhibit Bragg and satellite diffractions in the SAXS [2] and WAXS [17], respectively.
We previously reported that large changes in the Co content of Co–Ni alloy thin films electrodeposited by a rectangular pulse current over a megahertz frequency range occur at resonant frequencies [18]. Hence, if two frequencies are chosen to electrodeposit Co–Ni alloy layers including high and low Co contents, Co-Ni alloy superlattices modulated with Co contents will be formed. This is the motivation for this study.
The aim of the present study is to demonstrate that Co–Ni alloy superlattices comprising Co–Ni atomic layers modulated with Co content can be formed using 0.3 and 0.35 MHz rectangular pulse currents.
[image:2.596.127.472.365.627.2]2. EXPERIMENTAL SETUP
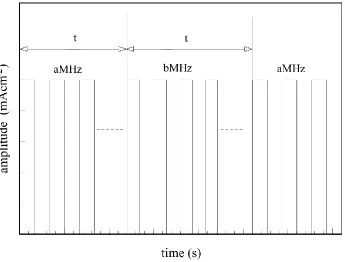
Figure 1. Schematic diagram of the rectangular pulse current employed for the electrodeposition of Co– Ni alloy superlattices. The symbol t denotes the time period during which the rectangular pulse currents with frequencies of a and b MHz flow to a cell.
chemical compounds (mol L-1) was prepared: NiSO4·6H2O 0.709, CoSO4·7H2O 0.236, and KNaC4H4O6·4H2O 0.65.
The cathode and anode were placed parallel in a cell filled with the aqueous solution, and maintained at a temperature of 300 K during the electrodeposition.
The rectangular pulse currents with frequencies of 0.3 and 0.35 MHz were supplied to the cell by a function generator. A 22 Ω metal film resistor was connected in series with the cell to determine the current flowing to the cell. The impedance of the metal film resistor was independent of the frequency under 80 MHz.
Figure 1 shows a schematic diagram of the rectangular pulse current comprising two frequencies with a time period, t. Using the process in Fig. 1, Co–Ni alloy superlattices were electrodeposited onto the copper plates.
After the electrodeposition, the Co–Ni alloy superlattices on the copper plates were rinsed with distilled water. The element contents in the Co–Ni alloy superlattices on the copper plate were determined using energy dispersive X-ray spectroscopy (Hitachi TM3030). The crystallographic textures of the Co–Ni alloy superlattices were determined using X-ray diffraction (XRD: Rigaku Ultima) with CuKα radiation.
3. RESULTS AND DISCUSSION
[image:3.596.89.509.397.682.2]
Figure 3. Co and Ni contents in the Co–Mn thin films electrodeposited at frequencies: (a) 0.3 and (b) 0.35 MHz.
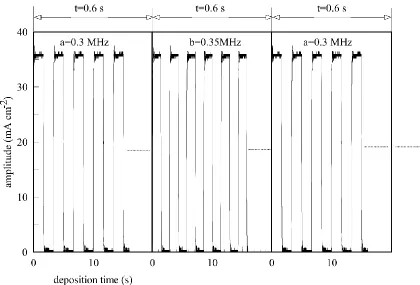
Figure 2 shows typical rectangular pulse currents with frequencies of 0.3 and 0.35 MHz. First, the rectangular pulse current with an amplitude of 36 mA cm−2 and frequency of 0.3 MHz flowed to the cell for t=0.6 s. Second, the rectangular pulse current with 36 mA cm−2 and 0.35 MHz flowed to the cell for t=0.6 s. These two processes were repeated to form the Co–Ni alloy super lattices. Here, we define the unit lattice consisting of the Co–Ni atomic layers formed at 0.3 MHz and those at 0.35 MHz for a time period of 2t. In this study, the time periods, t were 0.6 and 1.2 s.
Figure 3 shows the Co and Ni contents in the Co–Ni alloy films electrodeposited at 0.3 and 0.35 MHz. The dependence of the Co content in the Co–Ni alloy thin films on the frequency has already been reported [18]. The Co content in the Co–Ni alloy thin film electrodeposited at 0.3 MHz was approximately 2 times greater than that at 0.35 MHz. Thus, 0.3 and 0.35 MHz were chosen for the frequencies to form the unit lattice comprising Co–Ni atomic layers, including those with both high and low Co contents.
At an Ni content of 29 wt%, the Co–Ni alloy thin film has a phase transition from a face-centered cubic (FCC) crystal structure to a hexagonal closed-pack crystal structure [19]. In Fig. 3 (a), as the Co– Ni alloy thin film contained 32.7 wt% Ni, it had a FCC crystal structure [18]. The crystallographic structure of the Co–Ni alloy thin film in Fig. 3 (b) was also FCC. Hence, the Co–Ni alloy superlattices had a FCC crystal structure.
Figure 4 shows a schematic diagram of the Co–Ni alloy superlattices comprising four unit lattices. Here, n1 and n2 are the numbers of Co–Ni atomic layers with 67.3 and 35.0 wt% Co per unit lattice, respectively. As some Ni atoms in the FCC crystal structure are substituted with Co atoms, strains occur in the Co–Ni alloy superlattice [20]. Hence, the strain may periodically change corresponding to the periodicity of the Co–Ni unit lattice. The unit lattice comprising the n1 and n2 layers was formed over the time period 2t. The morphologies of the Co–Ni alloy superlattices affected by the surface roughness of the Cu plate with a mirror appearance were presumed to have distorted interfaces.
due to the diffraction from the Co–Ni super lattice in the SAXS [13]. To determine the angle, θs , at which the diffraction intensity has a maximum value in the broad diffraction peak, we applied the Lorentz function as a fitting curve. The yellow curve represents the fitting curve to the broad diffraction peak, yielding a maximum intensity at θs=9.0º. The interference between the diffracted X-ray waves from the Cu plate and those from the Co–Ni monolayer are negligible because the number of unit lattices was very large.
[image:5.596.171.427.193.359.2]Figure 4. Schematic diagram of the Co–Ni alloy superlattices comprising two kinds of atomic layers including 67.3 and 32.0 wt% Co when frequencies of 0.3 and 0.35 MHz were applied according to the process in Fig. 1. Here, ni (i=1 and 2) is the number of Co–Ni alloy atomic layers and ds is the lattice constant of the Co–Ni alloy superlattice.
[image:5.596.137.464.446.690.2]
Figure 6. XRD chart of the Co–Ni alloy superlattice electrodeposited for a time period of 1.2 s. The Co– Ni alloy superlattices comprised 250 unit lattices.
The Cu plate with a mirror appearance was not smooth at an atomic level. Hence, the Co–Ni monolayers did not grow layer by layer and had distorted interfaces, which resulted in the broad Bragg diffraction peak, disappearance of the Kiessig oscillations, and extinction of the sub-diffraction peaks around the Bragg diffraction [15]. Using Bragg’s formula; λ = 2𝑑𝑠𝑠𝑖𝑛𝜃 where λ is the X-ray wave
length, ds is the lattice constant of the super lattice, and θ is the incident angle of the X-ray; we obtained ds=0.49 nm.
Figure 6 shows a typical XRD pattern of the Co–Ni superlattice formed for t=1.2 s. The number of unit lattices was 250. Three diffraction peaks parallel to the Cu plate were indexed as the (111), (200), and (220) planes of Ni. One broad diffraction peak due to Bragg diffraction from the Co–Ni super lattice was observed in the SAXS, however, there were no Kiessig oscillations or sub-diffraction peaks. We applied the Lorentz function as a fitting curve and obtained ds=0.902 nm using θs=4.9º.
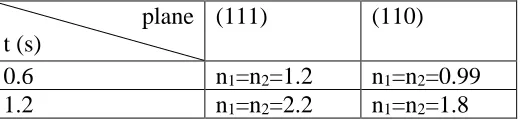
Table 1. Number of Co–Ni monolayers with the (111) and (110) planes parallel to the Cu substrate for time periods of 0.6 and 1.2 s.
plane t (s)
(111) (110)
0.6 n1=n2=1.2 n1=n2=0.99
1.2 n1=n2=2.2 n1=n2=1.8
4. CONCLUSIONS
The Co content in the Co–Ni alloy thin film formed by the 0.3 MHz rectangular pulse current was approximately two times greater than that formed by the 0.35 MHz rectangular pulse current. The Co–Ni alloy superlattice produced one Bragg diffraction peak in the SAXS. The calculated lattice constants of the Co–Ni alloy superlattices were controlled by the number of Co-Ni atomic layers with both high and low Co contents.
References
1. L. Wang, K. Young, T. Meng, T. Ouchi, and S. Yasuoka, J. Alloys. Compd., 660 (2016) 407. 2. G. Nabiyounia and W. Schwarzacher, J. Cryst. Growth, 275 (2005) e1259.
3. A. Dolati and S. S. Mahshid, Mater. Chem. Phys., 108 (2008) 391.
4. L. Péter, J. Pádár, E. T-Kádár, Á. Cziráki, P. Sóki, L. Pogány, and I. Bakonyi, Electrochim. Acta, 52 (2007) 3813.
5. M. J. Hu, B. Lin, and S. H. Yu, Nano Res, 1 (2008) 303.
6. G. Lauhoff, T. Suzuki, and A. Toporov, J. Appl. Phys., 100 (2006) 063909. 7. A. R. Shetty and A. C. Hegde, Surf. Coat. Technol., 322 (2017) 99.
8. V. Torabinejad, M. Aliofkhazraei, A. S. Rouhaghdam, and M. H. Allahyarzadeh, Tribol. Int., 106 (2017) 34.
9. A. S. Samardak, A. V. Ognev, A. Y. Samardak, E.V. Stebliy, E. B. Modin, L. A. Chebotkevich, S. V. Komogortsev, A. Stancu, E. P-Danaei, A. F-Ilkhichy, and F. Nasirpouri, J. Alloy. Compd., 732 (2018) 683.
10. R. Özdemir, Acta Phys. Pol. A, 132 (2017) 770. 11. L. Tian, J. Xu, and S. Xiao, Vacuum, 86 (2011) 27.
12. M. Sugawarsa, M. Kondo, S. Yamazaki, and K. Nakajima, J. Cryst. Growth, 93 (1988) 318. 13. E. E. Fullerton, I. K. Schuller, H. Vanderstraeton, and Y. Bruynseraede, Phys. Rev. B, 45 (1992)
9292.
14. H. Vanderstraeten, D. Neerinck, K. Temst, Y. Bruynseraede, E. E. Fullerton, and I. K. Schuller, J. Appl. Cryst., 24 (1991) 571.
15. T. Vreeland Jr. and B. M. Paine, J. Vac. Sci. Technol. A, 4 (1986) 3153. 16. P. Komar and G. Jakob, J. Appl. Cryst., 50 (2017) 288.
17. F. Nasirpouri, IEE Trans Magn., 47 (2011) 2015. 18. M. Saitou, Int. J. Electrochem. Sci., 13 (2018)305.
19. T. B. Massalski, Binary Alloy Phase Diagrams 2nd ed., ASM international, Materials Park, Ohio, 1990.
21. JCPDS-ICDD Card, No. 04-0850.