The
ECONOMIC
Background
THE INTERNATIONAL ENVIRONMENT Overview
Overall the outlook for the world economy has improved although most short and long-term interest rates in the major financial markets have increased slightly. These changes were undoubtedly based on the US rise in interest rates from 4.75% to 5% at the end of June. Within the Euro area there has been a strengthening of growth while inflation remained low and interest rates did not change. Japanese GDP increased by 1.9% in 1999ql which was a welcome sign. The increase in growth may however be attributed to the fiscal stimulus the economy has received. Oil prices have increased significantly although most other commodity prices showed little change.
The US
The US economy continues to exhibit strong GDP growth although growth in the second quarter of 1999 slowed to 0.6% according to preliminary estimates from 1.1% in 1999ql. There has been a slowdown in consumption, government spending and stockbuilding. Investment has again shown strong growth particularly in the high technology sectors. Export growth has not been consistent although there was a slight rise in 1999q2 but generally the strength of the dollar and weak domestic demand within the US' main trading partners do not help. Inflation was 1.5% throughout 1998 but is forecast to be closer to 2% this year. There has been little growth in earnings, strong productivity growth has kept unit labour costs at low levels. In the second quarter employment costs grew by 1.1%. The outlook for the US is reasonably good. We expect GDP growth of 3.4% this year, basically due to buoyant domestic demand and millennium related expenditures (up to 0.35% of GDP), but declining to 2.0% in the following year. We also expect some further appreciation of the US dollar. There has been a sharp reduction in the savings rate in the US
as wealth and house prices have grown. The US current account deficit was 3.1% of GDP in 1999ql and this is expected to widen in the second quarter.
Japan and Asia
Europe
GDP growth for the Euro Area was 0.5% for 1999ql suggesting growth has perhaps stabilised after the slowdown in 1998. The growth in Germany and Italy was stronger than expected. GDP growth for the Euro Area was only 0.3% for 1998q4 giving annual growth of only 2.2%. Growth has dipped in both Germany and Italy in 1998 with only 2.5% and 1.4% respectively compared to 2.8% for the Euro Area. The slackening of growth has been attributed to falling exports due to the Asian crisis and the fragile recovery in domestic demand in these two countries. German GDP growth appears to have strengthened in 1999ql with 1.2% growth in household consumption (strongest growth since 1994ql) and significant investment growth. Stockbuilding in Germany fell but the effect of this on annual growth is yet unclear. In Europe the expectation is that the European Central Bank's (ECB) 0.5% cut in interest rates could increase output by 0.3% next year. There has been no rate change by the ECB since April. Net trade continued to make a negative contribution to GDP growth during the first quarter with export volumes almost flat. The Euro Area current account surplus fell from 1.2% of GDP to 0.6% of GDP in 1999ql. The depreciation of the Euro since the beginning of the year has made the Euro economies slightly more competitive especially as 15% of German GDP is from trade with countries outside the EU. The weakness of the Euro and the upturn in Asia will probably increase German exports significantly in the second half of 1999. The dollar has appreciated as has the non-Euro currencies in the EU. There was a slight rise in the Euro effective exchange rate in July after markets revised their forecasts for Euro Area growth upwards. Inflation has been as expected very low throughout the Euro area remaining close to 1%. Falling commodity prices and the lack of capacity constraints have been the main factors here. Unemployment in the EU declined by 0.7% in
1998 and employment increased by 1.5% but this masks the fact that unemployment is above its equilibrium level in the Euro Area. Both German and French June business surveys saw a significant rise in business confidence.
Global trade looks set to rise steadily but slowly. The most adverse event that would cause some considerable adjustment to this outlook would be if Wall Street suffered a sizeable correction. The outlook for the global economy is relatively promising. Our forecasts of main economic indicators for the major economies are given in Table 1.
Table 1: International Forecasts of Main Economic Indicators; 1999-20011
us
Japan UK Germany OECD2
Euro Area EU
US Japan UK Germany OECD2
Euro Area EU
GDP (% change)
199 200 200 9 0 1 3.4 2.0 1.8 -1.4 0.4 1.1 1.1 2.3 2.5 1.6 2.8 2.6 1.7 2.3 2.2 2.1 2.8 2.6 2.0 2.1 2.2
Inflation (% change)
199 200 200 9 0 1 1.4 2.3 2.3 -0.9 0.1 1.0
1.2 2.4 2.6 1.1 0.9 1.4 1.1 1.6 2.0 1.0 1.4 1.8 1.3 1.6 2.0
Short Term Interest Rates (%)
199 200 200
9 0 1 5.0 5.1 5.2 0.7 0.6 0.7 5.2 5.3 5.3 2.7 2.8 3.1
2.7 2.8 3.1
Unemployment Rate (%)
199 200 200 9 0 1 4.2 4.5 4.7 4.6 5.1 5.5 6.2 6.2 6.4 10.3 10.0 9.4 7.3 7.3 10.3 10.0 9.4 10.3 10.0 9.5
Data Sources;
1 Fraser of Allander Institute, Bank of England Quarterly Economic Bulletin, Barclays Economic Review, Financial Times, IMF World Economy, National Institute Economic Review, OECD Economic Outlook, and various others.
2 Economic Outlook, (1998), 64, December, OECD, Paris (with
revisions).
UK MACROECONOMIC TRENDS
In the first quarter of 1999, the estimate of GDP at
market prices - 'money' GDP - rose by 0.1%.
After allowing for inflation, which was zero over the quarter, GDP at constant 1995 market prices grew by 0.1%, compared with 0.0% in the fourth quarter 1998, 0.5% in the third quarter, 0.5% in the second quarter, and 0.5% in the first quarter. Over the year to the first quarter, 'real' GDP at
constant market prices is estimated to have risen
by 1.2%. For 1998 as a whole, GDP growth is now estimated to be 2.2%, compared to 3.5% in 1997. Official estimates of 'real' GDP growth for the second quarter 1999 suggest that the economy grew by 0.5%.
Output of the production industries in the first
quarter fell again by 0.6% to a level 0.4% lower than the same period a year ago. Within production: manufacturing experienced a further decrease in output of 0.3% in the first quarter, output of the other energy and water supply industries fell by 2.8% in the first quarter, and
mining & quarrying, including oil & gas extraction fell by 1.1%. Manufacturing output in
the first quarter was 1.3% below the same period a year ago. The output of the service sector rose by 0.4% in the first quarter. Over the year to the first quarter service sector output rose by 2.7%. The
output in the first quarter of 0.2% with output in the industry falling by 3.6% over the year.
Official estimates for the second quarter 1999 indicate that output of the production industries rose by 0.6%, including a 0.4% increase in manufacturing, while service sector output grew by 0.4%.
Constsnt pries annua) growth rates - on m quarter In previous y GDP at market prices
Somes: ONS
In the first quarter of 1999, real households'
expenditure (which is consumers' expenditure
minus expenditure by non-profit making
institutions serving households) rose by 1.3%. This compares with a 1.1% rise in the fourth quarter 1998, a 0.2% rise in the third quarter, a 0.7% rise in the second quarter, and a 0.8% rise in the first quarter. Spending during the first quarter rose by 3.3% on the same period a year earlier. In the first quarter, households' expenditure provided the main positive contribution to GDP growth. The contribution to the GDP growth rate of 0.13% was 0.83% compared to a contribution of 0.31% from government spending and 0.04% from investment. It should be noted, however, that some of the stronger growth in household spending in the first quarter is likely to reflect the change in the registration date for new car sales from August to twice a year in March and September. This is likely to have produced a change in the seasonal pattern of vehicle spending, which will not have been allowed for in the historic seasonal adjustment factors. The official seasonally adjusted estimate of
retail sales volume for the three months to July
indicates an increase of 1.3% over the preceding three months and a rise of 2.9% over the same period a year earlier. The amount of outstanding
consumer credit rose by £0.95bn in June. This
compares with an increase of £0.73bn in May, £1.2bn in April, £2.1bn in March and £0.73bn in February. The household saving ratio fell to 5% in the first quarter, from 6.8% in the fourth quarter of 1998, 5.9% in the third quarter, 6% in the second quarter, and 6.9% in the first quarter. The reported underlying increase in average weekly
earnings in the year to June 1999 was
provisionally estimated to have been 5.2%, compared to an increase of 4.1 % in the year to May
and 4% in the year to April. In June, private sector earnings grew by 5.3% over the year, while earnings in the public sector grew by 5.2%. Real
household disposable income (RHDI) fell by
0.8% in the first quarter to a level 0.9% higher than in the same quarter in 1998. The fall in the saving ratio in the first quarter reflects the strong positive growth of households' expenditure compared to the fall in RHDI.
Constant prica annual growth rata* - on sama quarter in previous yaar
Household expenditure
^ ~ — ^
' • " ' ~ ~ — ' \
- — \ /
^
1997 1996 1999 Sourca: ONS
General government final consumption, rose by
1.7% in the first quarter, compared to an increase of 0.8° c in the fourth quarter, 0.4%in the third quarter, 0 4% in the second quarter, and 0.4% in the first quarter. Government consumption in the first quarter was 3.3% higher than in the corresponding quarter of 1998. Government consumption made a contribution of 0.31% points to overall GDP growth of 0.13% in the first quarter.
1,
i
Constant prica annual growth ratss - on sams quartar In previous vsar
General government final consumption
/ ^"\ / / \ /
\ /
Sourca: ONS
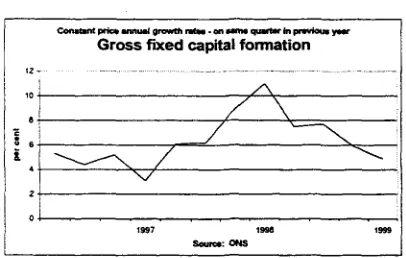
Real gross fixed investment or Gross fixed capital
formation rose by 0.2% in the first quarter to a level 5.9% higher than in the first quarter of 1998. The growth of investment has slowed since the third quarter of last year when it made the main positive contribution to GDP growth.
Inventory investment contributed negatively to
this aggregate made a negative contribution of 0.39% points to overall GDP growth of 0.13%.
Constant pric* annuel growth ratM - on Mm* quarter in pravtoue y
Gross fixed capital formation
Turning now to the balance of payments, the current account for the first quarter 1999 registered, after seasonal adjustment, a deficit of £1.8bn. This follows surpluses of £lbn in the fourth quarter and £2.4bn in the third quarter and deficits of £1.2bn and £0.68bn in the second and first quarters respectively. For trade in goods and services, the deficit deteriorated to £4.24bn in the first quarter, from £3.37bn in the fourth quarter, £1.81bn in the third quarter, £1.62bn in the second quarter and £1.13bn in the first quarter. The deficit in traded goods increased to £6.79bn in the first quarter, from £6.29bn in the fourth quarter, £5.27bn in the third quarter, £4.79bn in the second quarter and £4.25bn in the first quarter. For income and current transfers, there was a surplus of £2.41bn in the first quarter compared to a surplus of £4.32bn in the fourth quarter, following surpluses of £4.2bn in the third quarter, £0.42bn in the second quarter and £0.45bn in the first quarter. The further deterioration in the trade balance meant that net exports again made a significant negative contribution to growth in the first quarter reducing GDP growth by 0.62% points.
-3
Constant price annua) growth n t a e - on M m * quarter in previous year
Exports and imports of goods and sorvfcos
V - ' - -a*" \ N ^ -/ \ _ •
\ .
\ -'
\tna
1996 1997 1998 \ 1«99
\ /
Source: ONS
UK LABOUR MARKET
Employment and Unemployment
On the ILO definition, for the quarter to June, the level of unemployment stands at 1,760,000. This is
an absolute reduction of 3.4% over die last quarter and 2.9% over the last year. The unemployment rate for the quarter to June, on the ILO definition, is 6.0%. Over me past quarter and year, unemployment has been falling for both males and females though rather more rapidly for females. At present, on the ILO definition the male unemployment rate is 6.7% whilst the female rate is 5.2%. The UK ILO unemployment rate remains below the EU average rate, which is 9.4%, though five EU countries, Austria, Denmark, Luxembourg, Netherlands and Portugal have lower rates of unemployment, as do the USA and Japan. The claimant count definition of UK unemployment shows a lower absolute level (1,236,300) and rate (4.3%) man the ILO definition. However, the two measures are qualitatively similar in identifying falling unemployment amongst both men and women.
[image:4.492.36.239.67.196.2]The persistent increase in UK total employment, which has been in evidence from June 1994, continues. Total employment in the quarter from April to June numbered 27,394,000 and mis represents an employment rate of 74.0% of the population of working age. This total employment figure represents an increase of 39,000 (0.1%) on the figure for the previous quarter and 157,000 (0.3%) on the figure for the previous year. However, the employment experience in the various sectors of the UK economy varied markedly. Data exist for workforce jobs broken down by industrial sector. These differ from the number employed as one person can have more than one job. These figures are available up to March 1999. They show a fall in the number of manufacturing jobs by 1.2% in the quarter and by 4.1% in the year. Additionally, more up to date figures for manufacturing show employment losses of 0.8% for the quarter up to June. Over the quarter to March, the biggest proportionate increase in jobs has occurred in agriculture, although the number of jobs in agriculture are down over the full year.
However persistent job increases are identified in finance and business services and in public administration, education and health.
Whilst the total employment and unemployment figures change in a rather consistent manner, the level of vacancies notified at Job centres seems to fluctuate around a relatively stable level. The notified vacancy figure for July is 1.9% lower than the figure for April but 4.4% and 0.6% above the figure for July 1998 and 1997 respectively.
Earnings and Productivity
to 4.5% in January 1999 and has been fluctuating since then. The increase in the last month is large (1.2%) and there is concern that escalating house prices might be about to fuel increased wage inflation. There is significant variation in wage increases between sectors. The headline figure in the private sector, at 4.3%, is below the value for the public sector, which is 4.8%. This reverses a trend which has been very marked over the previous two years where earnings increases in the private sector have far outstripped those in the public sector. Again, the headline rate of increase in earnings to March in production industries is 3.4% whilst in service industries it is 4.7%. The annual rate of growth of labour productivity in the whole economy in the fourth quarter of 1998 was low at 0.7% and the change in the quarter was actually negative. Whole-economy productivity in the 1st quarter of 1999 was only 1% higher than a year previous. However, the figures for manufacturing continue to improve, with productivity in the 1st quarter of the year 3% higher than for the same period in 1998. Given the productivity and wage change figures, we observe an annual increase in the whole-economy unit labour costs to the first quarter of 1998 of 4.4%. The corresponding increase in manufacturing to June 1999 is 0.5%.
UK OUTLOOK
The UK economy effectively experienced a growth pause during the final quarter of last year and the first quarter of 1999. A recession did not materialise and GDP growth began to pick up again in the second quarter. Moreover, revisions to the National Accounts going back to 1997, which were published at the end of July, raised the level of real GDP by 0.4% to 1999 Ql and domestic demand by 0.7%. The manufacturing sector, which contracted for three successive quarters from Q2 1998, appeared to be moving out of recession in the second quarter, while ihe service sector maintained its record of sustained growth. The principal impetus to growth is coming from accelerating household expenditures and government final consumption. Private sector investment is also picking up. However, adverse movements in net trade are tending to lower the rate of growth, averaging around 0.5 percentage points a quarter for much of the last year, reflecting, in part, the continuing high level of sterling. Consequently, as domestic demand expands, imports are growing strongly while export volumes have been declining in recent quarters and are likely to remain fairly flat during the remainder of the year.
The inflation rate has fallen below its target. Nominal pay growth has eased, particularly in private sector, so that growth of public and private
sector earnings is nearly in line. Much of this decline probably reflects lower inflationary expectations and the decline in profits, productivity and output growth, in the recent slowdown rather than the direct impact of labour market conditions. Growth in real unit labour costs has continued to pick up but is less, at given rates of unemployment, than it was at a similar point in the previous cycle. This might reflect the labour market reforms and structural change that are alleged to have made the labour market more flexible and could indicate a lower equilibrium or 'natural' rate of unemployment. Input price growth while still remaining low may now be beginning to pick up again, after the stabilisation of non-oil commodity prices, the recent rise in oil prices and the unwinding of the dampening effect of the earlier appreciation of the pound.