Review
Evaluation of New Technology-Based Tools for
Dietary Intake Assessment—An ILSI Europe Dietary
Intake and Exposure Task Force Evaluation
Alison L. Eldridge1,*, Carmen Piernas2 , Anne-Kathrin Illner3, Michael J. Gibney4 , Mirjana A. Gurinovi´c5, Jeanne H.M. de Vries6and Janet E. Cade7
1 NestléResearch, Vers-chez-les-Blanc, 1000 Lausanne 26, Switzerland
2 Nuffield Department of Primary Care Health Sciences, University of Oxford, Oxford OX2 6GG, UK;
3 College of Health Sciences, Polytechnic Institute UniLaSalle Beauvais, 60026 Beauvais, France;
4 Institute of Food and Health, University College Dublin, Dublin D04 V1W8, Ireland; [email protected]
5 Centre of Research Excellence in Nutrition and Metabolism, Institute for Medical Research,
University of Belgrade, Belgrade 11000, Serbia; [email protected]
6 Division of Human Nutrition and Health, Wageningen University, 6708WE Wageningen, The Netherlands;
7 School of Food Science and Nutrition, University of Leeds, Leeds LS2 9JT, UK; [email protected]
* Correspondence: [email protected]; Tel.: +41-21-785-8365
Received: 27 November 2018; Accepted: 25 December 2018; Published: 28 December 2018
Abstract: Background: New technology-based dietary assessment tools, including Web-based programs, mobile applications, and wearable devices, may improve accuracy and reduce costs of dietary data collection and processing. The International Life Sciences Institute (ILSI) Europe Dietary Intake and Exposure Task Force launched this project to evaluate new tools in order to recommend general quality standards for future applications. Methods: A comprehensive literature search identified technology-based dietary assessment tools, including those published in English from 01/2011 to 09/2017, and providing details on tool features, functions and uses. Each of the 43 tools identified (33 for research and 10 designed for consumer use) was rated on 25 attributes. Results: Most of the tools identified (79%) relied on self-reported dietary intakes. Most (91%) used text entry and 33% used digital images to help identify foods. Only 65% had integrated databases for estimating energy or nutrients. Fewer than 50% contained any features of customization and about half generated automatic reports. Most tools reported on usability or reported validity compared with another assessment method (77%). A set of Best Practice Guidelines was developed for reporting dietary assessment tools using new technology. Conclusions: Dietary assessment methods that utilize technology offer many advantages for research and are often preferable to consumers over more traditional methods. In order to meet general quality standards, new technology tools require detailed publications describing tool development, food identification and quantification, customization, outputs, food composition tables used, and usability/validity testing.
Keywords:dietary assessment; mobile technologies; Web-based technologies
1. Introduction
The opportunities provided by the internet to link large scale food and nutrient databases with automated dietary recording has led to growth in the number of online dietary assessment tools [1]. New technologies for measuring diet can be categorized according to the type of technology being used,
such as Web-based or online tools, mobile systems (apps), camera-based tools, and other developing technologies, such as consumer purchase data and wearable sensors. Traditional methods relied heavily on self-reporting of foods consumed either using food frequency questionnaires (FFQ) or with paper-based recalls or diaries. All of the traditional methods lacked accuracy as a result of problems including the ability to recall food consumed, difficulties with portion size estimations or limited food composition tables [2]. Considerable manual input and time was required for coding and converting foods recorded into nutrients. This meant that in large-scale cohort studies it was not generally possible to collect detailed food intake information, and studies relied on food frequency questionnaire data, which is subject to greater measurement error than other self-report measures [3,4]. Use of computerized tools facilitated data coding, and incorporation of the automated multiple-pass method (AMPM) standardized data collection for national surveys [5,6]. New methods have allowed for an expansion and potential improvement on the traditional methods. The use of the Internet makes larger-scale collection of food and nutrient information practical with lower costs and burden for both researchers and participants [7]. Study participants can be invited to take part in research electronically via email or text [8]. Users of new technology tools can more easily identify foods consumed through interactive searchable databases [9]. They can provide real-time results and feedback [1] and can include enhanced options for portion size description, such as using digital images [10], and more relevant lists of branded food items [9].
It is often not clear how relevant a particular dietary assessment tool is for research as a result of limited information provided on the development process and lack of validation. An evaluation of new technologies to assess diet may help understanding of their potential to replace, improve, or complement traditional methods. Due to the rapid development of new technologies, existing reviews of the area quickly become out of date, including obsolete technologies such as personal digital assistants or PDAs [11]. Highlighting features of new technologies, such as those found in Web-based recalls or apps, in comparison with tool elements reflecting traditional approaches may help to identify techniques that can enhance dietary measurement [12]. Recently, clear guidance in terms of dietary assessment tool choice and reporting has been published [2,13]. However, guidance on the development of new tools with quality criteria for their assessment is still lacking.
In 2016, the International Life Sciences Institute (ILSI) Europe Dietary Intake and Exposure Task Force (http://ilsi.eu/task-forces/food-safety/dietary-intake-and-exposure/) established an expert group on evaluation of new methods for dietary intake assessment. The aim of the group was to review new technologies for diet assessment in terms of features, sources and quality of data, and validity. The review presented here will help to understand the relative merits of particular new tools and applications currently available for dietary intake assessment. We have critically evaluated tools, including their sources of data, applicability for research, ease of use by different population groups, and ability to handle a wide range of foods and beverages. In a second step, we also suggest guidelines for quality standards to improve reporting of dietary intake assessment tools.
The objectives of this paper are to: (i) report on a comprehensive review of tools for dietary assessment using new technologies which are applicable for use in research, commercial, clinical and public health contexts; (ii) to develop guidelines for quality criteria required for a good quality tool; and (iii) to make recommendations for future reporting of dietary assessment tools using new technologies.
2. Materials and Methods
2.1. Inclusion Criteria and Search Strategy
technologies, including mobile apps, Web-based tools, online or Internet tools, and software. PubMed, PLOS, BioMED, Science Direct and Ovid databases were used, each with slightly different search terms (Supplemental Table S1). The searches were limited to articles published after 1 January 2011 because the field of technology development for dietary intake assessment is advancing rapidly, and tools developed prior to 2011 have been previously evaluated [12]. Dietary assessment tools were identified, details of which were available in one or more publications.
2.2. Evaluation Criteria and Data Extraction
The Expert Group, comprised of the authors of this manuscript, identified 25 attributes related to data entry, identification and quantification of foods, customization, output, usability and validity, which were used to evaluate each dietary assessment tool (Supplemental Table S2). Under the heading of Data Entry, we assessed whether the tools relied on text entry, digital images and/or bar-code scanners, and whether they also collected information about health characteristics or physical activity. For the Identification and Quantification of Foods, we assessed whether the foods or beverages were automatically identified from an image or required manual identification, the source of food composition data used, and how the intake amounts were quantified, either by weights or household measures, or estimated from digital images. In the Customization section, we assessed whether the tool allowed the user to add missing foods, custom recipes or dietary supplements, and whether the program used machine learning to adapt the list of foods to user preferences. Under Output, we considered whether the tool provided data on energy, macro- and micro-nutrient intakes, food groups consumed, time of intake and meal name, and whether the tool generated automated reports. Finally, we assessed Usability and Validity by checking whether there were any reports of user feedback, time to complete the assessment, and whether any validation studies had been conducted.
The features of each dietary assessment tool were assessed independently by two members of the Expert Group from details provided in the publications, and any discrepancies were discussed at the Expert Group level. If the publications identified in the searches did not provide the sufficient detail to complete the assessment, additional literature, websites, contacts with authors, or tool use itself were used to attempt to fill gaps.
3. Results
3.1. Search Results
Articles identified from PubMed, PLOS, BioMed,
Science Direct (n = 2946)
Id
en
ti
fi
cat
ion
of
to
ol
s
In
cl
u
d
ed
El
ig
ib
ili
ty
Id
en
ti
fi
cat
ion
of
a
rt
icl
e
s Articles identified using
OVID (n = 1615)
Total number of articles identified (n = 4695)
Tools identified (n = 151)
References citing the same tool (n = 66)
Unique tools screened (n = 85)
Tools excluded: not relevant (n = 14), detail
missing (n = 16), met exclusion criteria (n = 7),
or tool renamed (n = 5) (n = 42) Unique tools identified and
evaluated (n = 43)
Articles identified using second OVID search
strategy (n = 134)
Irrelevant and duplicate articles removed
(n = 3895)
Abstracts screened to identify tools
[image:4.595.91.508.85.523.2](n = 800)
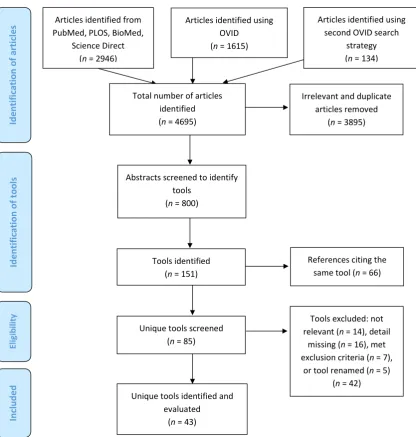
Figure 1.PRISMA diagram used to identify technology-based tools for dietary intake assessment.
3.2. Characteristics of Included Studies
consumer use, most of them collected food records (n = 8; 80%), whilen = 2 (20%) collected food frequency questionnaires.
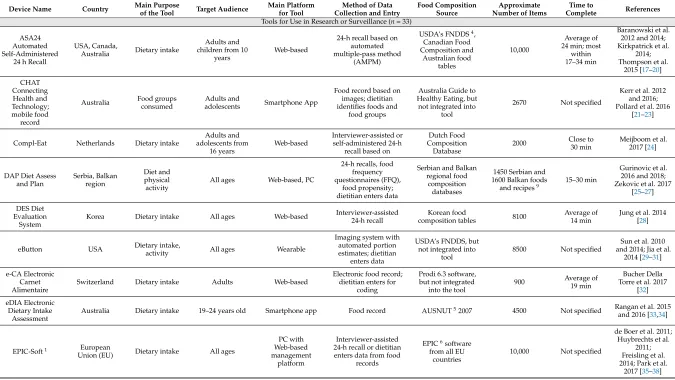
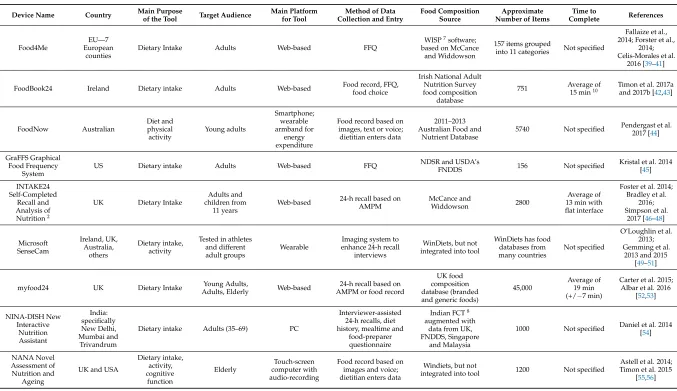
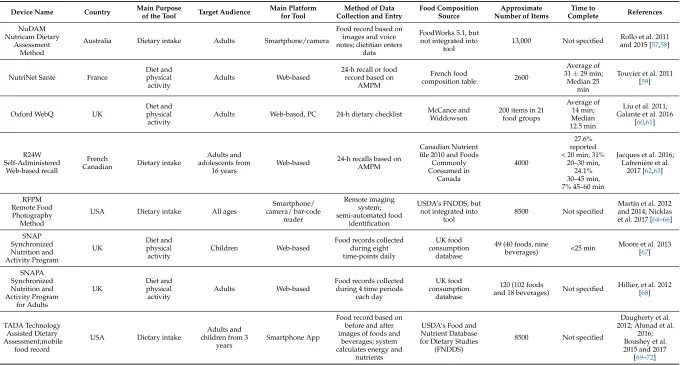
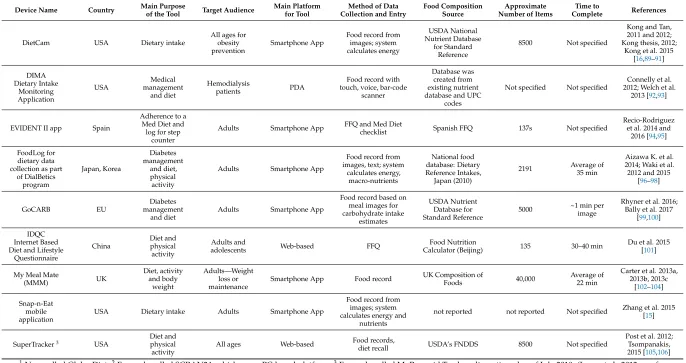
Although all of these tools used technology for dietary intake data collection, not all of the tools automatically coded the intake information to generate energy and nutrients (Table1). Of the tools assessed here, 15 of the 43 (35%) were used for data capture only and required a dietitian or a coder to enter the items and portions in another tool later to estimate energy and nutrient intakes. These are identified as “not integrated into the tool” in Table1. Another large difference in the tools was the source of food composition data and the number of items available. Tools designed to assess food consumption frequency (Evident II, Food4Me, GraFFS, IDQC, Oxford WebQ, and WebFFQ) included 135–200 individual line items (individual foods or aggregated food categories). Those designed for children varied, with SNAP and WebCaaFE including a limited list (49 and 32 foods and beverages, respectively), while WebFR and WebDASC included a more extensive list of 550 and 1300 items, respectively. Tools that relied on national food composition tables ranged from about 1000 items to more than 45,000 if branded foods were also included (e.g., myfood24), and were largely complete with respect to nutrients. The source of food composition was reported in all but one case, but the number of foods included in the database was missing for six of the tools. The daily time to complete each tool was reported in 18 of the 43 studies. The times ranged from an average low of 14 min to as much as 45–60 min, but most tools were completed within 15–35 min.
Table 1.Design characteristics of the technology-based tools used in dietary intake assessment.
Device Name Country Main Purpose
of the Tool Target Audience
Main Platform for Tool
Method of Data Collection and Entry
Food Composition Source
Approximate Number of Items
Time to
Complete References
Tools for Use in Research or Surveillance (n= 33)
ASA24 Automated Self-Administered
24 h Recall
USA, Canada,
Australia Dietary intake
Adults and children from 10
years
Web-based
24-h recall based on automated multiple-pass method
(AMPM)
USDA’s FNDDS4, Canadian Food Composition and Australian food tables 10,000 Average of 24 min; most
within 17–34 min
Baranowski et al. 2012 and 2014; Kirkpatrick et al.
2014; Thompson et al.
2015 [17–20] CHAT Connecting Health and Technology; mobile food record
Australia Food groups consumed
Adults and
adolescents Smartphone App
Food record based on images; dietitian identifies foods and
food groups
Australia Guide to Healthy Eating, but
not integrated into tool
2670 Not specified
Kerr et al. 2012 and 2016; Pollard et al. 2016
[21–23]
Compl-Eat Netherlands Dietary intake
Adults and adolescents from 16 years Web-based Interviewer-assisted or self-administered 24-h
recall based on
Dutch Food Composition Database
2000 Close to 30 min
Meijboom et al. 2017 [24]
DAP Diet Assess and Plan Serbia, Balkan region Diet and physical activity
All ages Web-based, PC
24-h recalls, food frequency questionnaires (FFQ),
food propensity; dietitian enters data
Serbian and Balkan regional food
composition databases
1450 Serbian and 1600 Balkan foods and recipes9
15–30 min
Gurinovic et al. 2016 and 2018; Zekovic et al. 2017
[25–27]
DES Diet Evaluation
System
Korea Dietary intake All ages Web-based Interviewer-assisted 24-h recall
Korean food
composition tables 8100
Average of 14 min
Jung et al. 2014 [28]
eButton USA Dietary intake,
activity All ages Wearable
Imaging system with automated portion estimates; dietitian
enters data
USDA’s FNDDS, but not integrated into
tool
8500 Not specified
Sun et al. 2010 and 2014; Jia et al.
2014 [29–31]
e-CA Electronic Carnet Alimentaire
Switzerland Dietary intake Adults Web-based
Electronic food record; dietitian enters for
coding
Prodi 6.3 software, but not integrated
into the tool
900 Average of 19 min
Bucher Della Torre et al. 2017
[32]
eDIA Electronic Dietary Intake
Assessment
Australia Dietary intake 19–24 years old Smartphone app Food record AUSNUT52007 4500 Not specified Rangan et al. 2015 and 2016 [33,34]
EPIC-Soft1 European
Union (EU) Dietary intake All ages
PC with Web-based management
platform
Interviewer-assisted 24-h recall or dietitian enters data from food
records
EPIC6software from all EU
countries
10,000 Not specified
de Boer et al. 2011; Huybrechts et al.
2011; Freisling et al. 2014; Park et al.
Table 1.Cont.
Device Name Country Main Purpose
of the Tool Target Audience
Main Platform for Tool
Method of Data Collection and Entry
Food Composition Source
Approximate Number of Items
Time to Complete References Food4Me EU—7 European counties
Dietary Intake Adults Web-based FFQ
WISP7software; based on McCance
and Widdowson
157 items grouped
into 11 categories Not specified
Fallaize et al., 2014; Forster et al.,
2014; Celis-Morales et al.
2016 [39–41]
FoodBook24 Ireland Dietary intake Adults Web-based Food record, FFQ, food choice
Irish National Adult Nutrition Survey food composition
database
751 Average of 15 min10
Timon et al. 2017a and 2017b [42,43]
FoodNow Australian Diet and physical activity Young adults Smartphone; wearable armband for energy expenditure
Food record based on images, text or voice; dietitian enters data
2011–2013 Australian Food and
Nutrient Database
5740 Not specified Pendergast et al. 2017 [44]
GraFFS Graphical Food Frequency
System
US Dietary intake Adults Web-based FFQ NDSR and USDA’s
FNDDS 156 Not specified
Kristal et al. 2014 [45] INTAKE24 Self-Completed Recall and Analysis of Nutrition2
UK Dietary Intake
Adults and children from
11 years
Web-based 24-h recall based on AMPM
McCance and
Widdowson 2800
Average of 13 min with flat interface
Foster et al. 2014; Bradley et al.
2016; Simpson et al.
2017 [46–48] Microsoft SenseCam Ireland, UK, Australia, others Dietary intake, activity
Tested in athletes and different adult groups
Wearable
Imaging system to enhance 24-h recall
interviews
WinDiets, but not integrated into tool
WinDiets has food databases from many countries
Not specified
O’Loughlin et al. 2013; Gemming et al.
2013 and 2015 [49–51]
myfood24 UK Dietary Intake Young Adults,
Adults, Elderly Web-based
24-h recall based on AMPM or food record
UK food composition database (branded and generic foods)
45,000
Average of 19 min (+/−7 min)
Carter et al. 2015; Albar et al. 2016
[52,53] NINA-DISH New Interactive Nutrition Assistant India: specifically New Delhi, Mumbai and Trivandrum
Dietary intake Adults (35–69) PC
Interviewer-assisted 24-h recalls, diet history, mealtime and
food-preparer questionnaire
Indian FCT8 augmented with
data from UK, FNDDS, Singapore
and Malaysia
1000 Not specified Daniel et al. 2014 [54]
NANA Novel Assessment of Nutrition and
Ageing
UK and USA
Dietary intake, activity, cognitive function Elderly Touch-screen computer with audio-recording
Food record based on images and voice; dietitian enters data
Windiets, but not
integrated into tool 1200 Not specified
Astell et al. 2014; Timon et al. 2015
Table 1.Cont.
Device Name Country Main Purpose
of the Tool Target Audience
Main Platform for Tool
Method of Data Collection and Entry
Food Composition Source
Approximate Number of Items
Time to Complete References NuDAM Nutricam Dietary Assessment Method
Australia Dietary intake Adults Smartphone/camera
Food record based on images and voice notes; dietitian enters
data
FoodWorks 5.1, but not integrated into
tool
13,000 Not specified Rollo et al. 2011 and 2015 [57,58]
NutriNet Santé France
Diet and physical activity
Adults Web-based
24-h recall or food record based on
AMPM
French food
composition table 2600
Average of 31±29 min;
Median 25 min
Touvier et al. 2011 [59]
Oxford WebQ UK
Diet and physical activity
Adults Web-based, PC 24-h dietary checklist McCance and Widdowson
200 items in 21 food groups
Average of 14 min; Median 12.5 min
Liu et al. 2011; Galante et al. 2016
[60,61]
R24W Self-Administered
Web-based recall
French
Canadian Dietary intake
Adults and adolescents from
16 years
Web-based 24-h recalls based on AMPM
Canadian Nutrient file 2010 and Foods
Commonly Consumed in Canada 4000 27.6% reported < 20 min, 31%
20–30 min, 24.1% 30–45 min, 7% 45–60 min
Jacques et al. 2016; Lafrenière et al.
2017 [62,63]
RFPM Remote Food Photography Method
USA Dietary intake All ages
Smartphone/ camera/ bar-code reader Remote imaging system; semi-automated food identification
USDA’s FNDDS, but not integrated into
tool
8500 Not specified
Martin et al. 2012 and 2014; Nicklas et al. 2017 [64–66]
SNAP Synchronized Nutrition and Activity Program UK Diet and physical activity Children Web-based
Food records collected during eight time-points daily
UK food consumption
database
49 (40 foods, nine
beverages) <25 min
Moore et al. 2013 [67] SNAPA Synchronized Nutrition and Activity Program for Adults UK Diet and physical activity Adults Web-based
Food records collected during 4 time periods
each day
UK food consumption
database
120 (102 foods
and 18 beverages) Not specified
Hillier, et al. 2012 [68]
TADA Technology Assisted Dietary Assessment;mobile
food record
USA Dietary intake
Adults and children from 3
years
Smartphone App
Food record based on before and after images of foods and
beverages; system calculates energy and
nutrients
USDA’s Food and Nutrient Database for Dietary Studies
(FNDDS)
8500 Not specified
Daugherty et al. 2012; Ahmad et al.
2016; Boushey et al. 2015 and 2017
Table 1.Cont.
Device Name Country Main Purpose
of the Tool Target Audience
Main Platform for Tool
Method of Data Collection and Entry
Food Composition Source
Approximate Number of Items
Time to
Complete References
TECH Tool for Energy
Balance in Children Sweden Diet and physical activity
2–5 years old Smartphone App
Food record: Parents take images and
provide short descriptions; dietitian
enters data
Swedish Food Database, but this was not integrated
into tool
Not reported Not specified
Delisle et al. 2015; Henriksson et al.
2015; Delisle Nyström et al.
2016 [73–75]
VNP
Virtual Nutri Plus Brazil Dietary intake
Patients undergoing gastric bypass
surgery
PC
24-h recall or food record; dietitian
enters data
Brazilian Food Chemical Composition Table
1711 Not specified
da Silva et al. 2014a and 2014b
[76,77]
WebCAAFE Food Intake and Physical Activity of School-children Brazil Diet and physical activity Children
6–12 years Web-based 24-h recall
None; evaluates foods and beverages
only
32 items in each of 6 eating events
per day
Not specified
Davies et al., 2015; Kupek et al. 2016
[78,79] WebDASC Web-Based Dietary Assessment Software for Children
Denmark Dietary Intake Children Web-based 24-h recall
Danish National Survey of Diet and
Physical Activity (DANSDA)
1300
Average of 15 min (after
first day)
Biltoft-Jensen et al. 2012 and 2013; Andersen et al. 2015 [80–82]
Web-FFQ Quebec,
Canada Dietary intake Adults Web-based FFQ
Nutrition Data System for Research
and the Canadian Nutrient File
136 45 min Labonte et al. 2012 [83]
WebFR Web-based Food
Record
Norway Dietary Intake Children Web-based 24-h recall
Norwegian National Survey database
(NORKOST)
550 Not specified
Medin et al. 2015, 2016, and 2017
[84–86]
Zambia Tablet-based 24h
recall Tool
Zambia Dietary intake Children Tablet Interviewer-assisted 24-h recall
HarvestPlus and Zambia food
comp tables
Not specified Not specified Caswell et al. 2015 [87]
Tools for Consumer Use (n= 10)
Diabetics Diary, paired with Pebble smartwatch Norway Diabetes management Diet and physical activity Adults Android Smartphone plus Smart watch
Table 1.Cont.
Device Name Country Main Purpose
of the Tool Target Audience
Main Platform for Tool
Method of Data Collection and Entry
Food Composition Source
Approximate Number of Items
Time to
Complete References
DietCam USA Dietary intake
All ages for obesity prevention
Smartphone App
Food record from images; system calculates energy USDA National Nutrient Database for Standard Reference
8500 Not specified
Kong and Tan, 2011 and 2012; Kong thesis, 2012;
Kong et al. 2015 [16,89–91] DIMA Dietary Intake Monitoring Application USA Medical management and diet Hemodialysis patients PDA
Food record with touch, voice, bar-code
scanner
Database was created from existing nutrient database and UPC
codes
Not specified Not specified
Connelly et al. 2012; Welch et al.
2013 [92,93]
EVIDENT II app Spain
Adherence to a Med Diet and
log for step counter
Adults Smartphone App FFQ and Med Diet
checklist Spanish FFQ 137s Not specified
Recio-Rodriguez et al. 2014 and
2016 [94,95]
FoodLog for dietary data collection as part
of DialBetics program Japan, Korea Diabetes management and diet, physical activity
Adults Smartphone App
Food record from images, text; system
calculates energy, macro-nutrients National food database: Dietary Reference Intakes, Japan (2010)
2191 Average of 35 min
Aizawa K. et al. 2014; Waki et al. 2012 and 2015
[96–98]
GoCARB EU
Diabetes management
and diet
Adults Smartphone App
Food record based on meal images for carbohydrate intake
estimates
USDA Nutrient Database for Standard Reference
5000 ~1 min per image
Rhyner et al. 2016; Bally et al. 2017
[99,100]
IDQC Internet Based Diet and Lifestyle
Questionnaire China Diet and physical activity Adults and
adolescents Web-based FFQ
Food Nutrition
Calculator (Beijing) 135 30–40 min
Du et al. 2015 [101]
My Meal Mate
(MMM) UK Diet, activity and body weight Adults—Weight loss or maintenance
Smartphone App Food record UK Composition of
Foods 40,000
Average of 22 min
Carter et al. 2013a, 2013b, 2013c
[102–104]
Snap-n-Eat mobile application
USA Dietary intake Adults Smartphone App
Food record from images; system calculates energy and
nutrients
not reported not reported Not specified Zhang et al. 2015 [15]
SuperTracker3 USA
Diet and physical activity
All ages Web-based Food records,
diet recall USDA’s FNDDS 8500 Not specified
Post et al. 2012; Tsompanakis, 2015 [105,106]
1Now called Globo-Diet.2Formerly called SCRAN24, which was a PC-based platform.3Formerly called MyPyramid Tracker; discontinued as of July 2018. (Long et al., 2012 was for
MyPyramid Tracker, the predecessor of SuperTracker).4FNDDS is the US Department of Agriculture’s Food and Nutrient Database for Dietary Studies; FNDDS provides the nutrient
values for foods and beverages reported in the dietary intake component of the National Health and Nutrition Examination Survey (NHANES).5Australian Food, Supplement and
Nutrient Database (AUSNUT).6European Prospective Investigation into Cancer and Nutrition (EPIC).7WISP (Tinuviel Software) is nutritional analysis software for the UK and Ireland
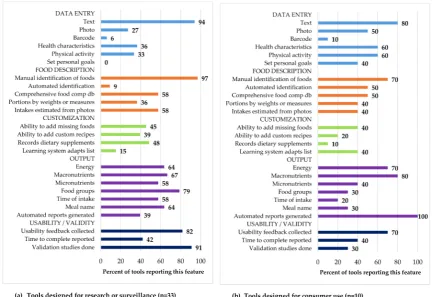
3.3. Comparison of Tools Used for Research versus Those for Consumer Use
Figure2compares the 25 attributes evaluated according to use in research (n = 33) vs. those intended for consumer use (n= 10). The greatest differences in summary ratings occurred in the category ‘Data entry,’ where half of consumer access tools made use of photos for data entry, compared to less than a third of tools used in research or surveillance. In addition, information on health characteristics and physical activity were more prevalent in tools for consumer access (60%, six tools), compared to only 36% (12 tools) and 33% (11 tools) of research or surveillance tools, respectively. The possibility to set personal goals was identified as a unique feature in tools for consumer access. In the category ‘Food description’ differences were observed for the automated identification of foods, in particular, with 50% (5) of consumer access tools offering this functionality, compared to only 9% (3) of research and surveillance tools. With regard to the category ‘Customization,’ research and surveillance tools had proportionally more options to add missing items, customize recipes, and report use of dietary supplements. Research and surveillance tools more frequently provide detailed information on dietary intake in the ‘Output’ category, particularly for the features ‘Food groups’, ‘Time of intake’, and ‘Meal name’, but fewer of the research tools contained integrated food databases, so lacked the ability to estimate energy or nutrient intakes automatically. In contrast, all consumer access tools we identified generated automatic reports, but only 39% (13 tools) of research and surveillance tools did so. In the ‘Usability and validity’ category, a higher proportion in tools used for research or surveillance (91%; 30 tools) have conducted validation studies, compared to 30% (n= 3) consumer access tools.
[image:11.595.82.516.365.662.2]1
Figure 2.Summary rating of the features from the dietary assessment tools designed for research or surveillance (A) and for consumer use (B).
3.4. Validation Studies
studies, energy intake estimates from the new technology tools were significantly lower than the TEE in studies using the Microsoft SenseCam [51], NuDAM [58], RFPM [64], and TADA [72] (differences ranging from 750 to 3745 kJ/day (179–895 kcal), whereas a different study with RFPM was within 636 kJ (152 kcal) [64], and two studies in children using the TECH tool were within 220–330 kJ (53–79 kcal) of TEE [74,75]. Two validation studies compared new technologies with TEE estimated from accelerometer data, showing that WebFR underestimated intakes by an average of 1840 kJ (440 kcal) in children 8–14 years [86], and FoodNow underestimated energy by 826 kJ (200 kcal) in young adults [44].
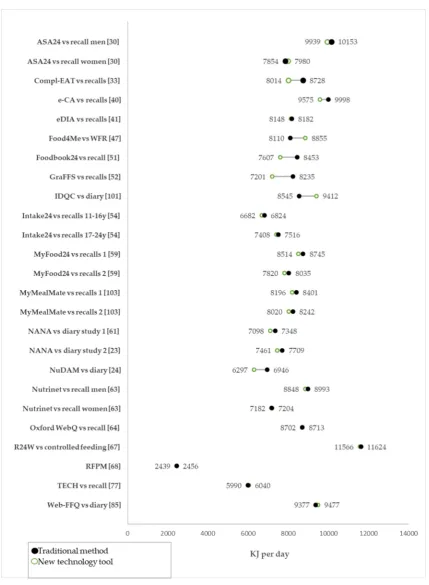
Standard methods of dietary assessment, including 24-h recalls, food records or weighed portions, were used in validation studies for 19 of the new technology tools (representing 25 individual validation comparisons), and in these studies, there was much closer agreement (Figure3). In fact, 18 of the 25 individual comparisons were within 250 kJ (about 60 kcal) of each other when comparing the tool and the traditional method. Six of the comparisons were within 400–900 kJ (95–215 kcal), and only one had a difference greater than 1000 kJ (240 kcal) compared to the traditional method. The tools NuDAM, RFPM, and TECH were assessed using both DLW and compared with standard method of dietary assessment, e.g., 24-h recall, weighed foods, or a diary.
Macronutrient intake comparisons were available for 22 of the 25 validation comparisons (Supplemental Table S2). Protein intake estimates were the closest between traditional and new technology tools, with 18 comparisons within 5 g of the reference (average 2.1 g). Three of the protein comparisons were between 5–9 g different from the reference and only one was >10 g. Agreement was less accurate for fat with 13 comparisons within 5 g of the reference, four between 5–9 g, and three comparisons >10 g difference. Carbohydrate estimates showed the widest variation, with eight comparisons within 5 g, six between 5–9 g, and eight >10 g.
Figure 3. Energy estimations from digital tools vs. traditional methods of dietary intake assessment.
Macronutrient intake comparisons were available for 22 of the 25 validation comparisons (Supplemental Table 2). Protein intake estimates were the closest between traditional and new technology tools, with 18 comparisons within 5 g of the reference (average 2.1 g). Three of the protein comparisons were between 5–9 g different from the reference and only one was >10 g. Agreement was less accurate for fat with 13 comparisons within 5 g of the reference, four between 5–9 g, and three comparisons >10 g difference. Carbohydrate estimates showed the widest variation, with eight comparisons within 5 g, six between 5–9 g, and eight >10 g.
Figure 3.Energy estimations from digital tools vs. traditional methods of dietary intake assessment.
4. Discussion
1995–2011 [12]. Since that review was published, personal digital assistants (PDAs) are no longer on the market, tape recorders are no longer needed for voice recording of dietary data, and cameras are integrated into smartphones, making digital image capture of foods much simpler. We focused our review on tools identified from publications in 2011–2017, and only four tools (ASA24, Nutrinet Santé, Oxford WebQ, and RFPM) were included in both this and Illner’s previous assessment.
There is growing pressure in the area of dietary intake assessment to improve the accuracy and reduce costs of data collection and processing [107]. New technology tools use a variety of inputs for dietary assessment, including text, voice, digital images, and bar-code scanners. Various techniques have been implemented to enhance accuracy of portion size reporting, including automatic estimation from digital images and visualization of different sized portions on a plate, as well as the ability to report quantities by weight or common household measures. Many new technology tools, especially those designed for consumer use, provide automated feedback on the individual’s nutrient intakes or dietary patterns, which may improve dietary outcomes and promote behavior change [108,109]. People are now accustomed to using technology tools, like smartphones, tablets, and computers, as part of their daily life, and usability studies indicate that many prefer technology tools for dietary intake assessment over traditional methods [20,42,71,104].
In the meantime, a number of other reviews have been published. While we deliberately chose to focus on new technologies identified from the published academic literature, other reviews have used app-store downloads as the criteria for selection [110,111]. Few of the app-store tools (4%) provided details about the sources of food composition data, and only 14% provided micronutrient estimates [111]. In contrast, half of the consumer apps in our review used a comprehensive food composition table, and 40% reported on micronutrient intakes. It is clear from the two approaches that apps with publications are more likely to include comprehensive food composition databases and, therefore, can report on a full complement of nutrients, compared to the most popular consumer apps. Image capture can increase accuracy and ease reporting of foods and beverages consumed [14,50]. Images were used for data capture in 13 of the tools we evaluated (nine research and four consumer-based tools), either by automatically coding food intakes, passively capturing food intake throughout the day, as a method of recording intakes, or as a memory prompt. Digital images were also used to facilitate portion size estimation in over half of the tools we evaluated (53%; 19 research tools and four consumer tools). Uses ranged from automatic estimation of food volumes from digital images [14–16,30] to visualization of different portion sizes to improve portion-size reporting [20,26,40,42,45,46,52,59,81,83,84,87].
Validation studies were much more commonly reported for dietary assessment tools in the research setting than for those targeted to consumers. There was very good agreement between many of these tools and their reference method, a conclusion also drawn in another previous review [112]. We found that 30 (out of 33) of the research tools and three (out of 10) of the consumer tools conducted a validation study, although the majority of comparison methods used in validation were other self-report measures and, therefore, subject to similar errors. In 72% of the comparisons (18 of 25), the new technology was within 60 kcal of the traditional method of dietary intake assessment. The differences were somewhat wider for studies with DLW, but these differences could have been due to a variety of reasons, including estimate errors from coders manually coding from images, or because eating occasions were not reported. As pointed out previously, new technologies will not resolve all of the challenges of dietary assessment [1], but it is also reassuring that, in many cases, results are close to traditional self-reported or memory-based recalls, which have received recent criticism for their accuracy [113]. Objective biomarkers of dietary intake, such as DLW, urinary nitrogen or potassium, or plasma vitamin levels, are still lacking for most tools [1,112], and care must be taken to interpret validation by other means, such as direct data entry into two comparable tools, or comparison of results from a national survey, for example.
interviewer-assisted data collection in lower-middle income countries [54,87], illustrating the utility of technology tools, even in countries where individuals may not have access to a smartphone, personal computer, or other technology for personal monitoring. However, technology tools will have limited use for self-monitoring in countries where smartphone or personal computers are not widely available.
Our evaluation has several notable strengths. As new tools and technologies are constantly changing, we have updated previous reviews with new tools identified from the literature and added a comprehensive evaluation of features. We have also compared features of research-based tools with those designed primarily for consumers, highlighting differences across all of our assessment topics. However, we must also acknowledge limitations in our review. The review was completed in September 2017, and it is possible that more recent publications have not been included in our review. For example, an in-depth validation of myfood24 including biomarkers was published after our assessment was completed [114], and others may have been missed as well. Results from validation studies comparing new technology tools to TEE or with daily energy estimations from conventional methods studies were presented, but further assessment of the quality of those studies was not assessed. We also focused on dietary assessment, per se, and have not included other new methods for assessing intakes, such as bite counters, tools that measure chews and swallows, or wrist-tracking devices that measure feeding [115]. It is also possible that there could be other attributes that are also important, but were not covered in this review, such as ethical issues or privacy when digital devices include other identifying features [111]. The impact of new technologies on cost will depend on the specific study design and the tools used, and this was rarely addressed in any of the publications. Finally, the search strategy may have missed some apps if key word searches did not pick up the studies, however, we used several search engines and different key word searches to minimize this risk.
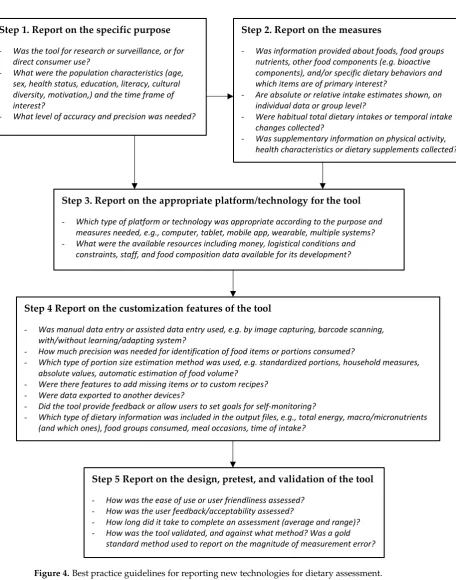
Step 1. Report on the specific purpose
- Was the tool for research or surveillance, or for direct consumer use?
- What were the population characteristics (age, sex, health status, education, literacy, cultural diversity, motivation,) and the time frame of interest?
- What level of accuracy and precision was needed?
Step 2. Report on the measures
- Was information provided about foods, food groups nutrients, other food components (e.g. bioactive components), and/or specific dietary behaviors and which items are of primary interest?
- Are absolute or relative intake estimates shown, on individual data or group level?
- Were habitual total dietary intakes or temporal intake changes collected?
- Was supplementary information on physical activity, health characteristics or dietary supplements collected?
Step 3. Report on the appropriate platform/technology for the tool
- Which type of platform or technology was appropriate according to the purpose and measures needed, e.g., computer, tablet, mobile app, wearable, multiple systems? - What were the available resources including money, logistical conditions and
constraints, staff, and food composition data available for its development?
Step 4 Report on the customization features of the tool
- Was manual data entry or assisted data entry used, e.g. by image capturing, barcode scanning, with/without learning/adapting system?
- How much precision was needed for identification of food items or portions consumed?
- Which type of portion size estimation method was used, e.g. standardized portions, household measures, absolute values, automatic estimation of food volume?
- Were there features to add missing items or to custom recipes? - Were data exported to another devices?
- Did the tool provide feedback or allow users to set goals for self-monitoring?
- Which type of dietary information was included in the output files, e.g., total energy, macro/micronutrients (and which ones), food groups consumed, meal occasions, time of intake?
Step 5 Report on the design, pretest, and validation of the tool
- How was the ease of use or user friendliness assessed? - How was the user feedback/acceptability assessed?
- How long did it take to complete an assessment (average and range)? - How was the tool validated, and against what method? Was a gold
[image:16.595.89.546.72.653.2]standard method used to report on the magnitude of measurement error?
Figure 4.Best practice guidelines for reporting new technologies for dietary assessment.
4.1. Best Practice Guidance for Reporting on New Technologies for Dietary Assessment
4.1.1. Step 1: Report on the Specific Purpose
characteristics, e.g., age, sex, health status, educational level. It is also important to inform about what level of accuracy and precision was needed. For example, if a higher level of precision was required, it may be necessary to administer repeated measurements.
4.1.2. Step 2: Report on the Measures
The goal of the second step is to inform about the main measurement features of a given tool. These relate to the information about individual foods (e.g., generic foods or branded products), food coding systems (e.g., LanguaL) and/or standardized food classification and description system (e.g., Food EX2), nutrients or other food components reported, the number of food items contained in the tool (e.g., comprehensive food lists or specific foods rich in a specific nutrient or bioactive component), and features of the response section (e.g., whether eating occasions or time is recorded, if food groups are included). We recommend reporting not only the source of the food composition data, but also to report the number of nutrients it contains, the coverage, and how the tool has been customized to best meet the population-specific needs.
We recommend defining the context for the tool and report if (1) a targeted tool provides relative or absolute intake estimates and (2) whether you are estimating daily intakes, habitual total dietary intakes, or temporal intake changes. It is also important to report if a given tool queries about supplementary information on physical activity, health characteristics, or use of dietary supplements.
4.1.3. Step 3: Report on the Appropriate Platform/Technology for the Tool
The goal of the third step is to report on the selection of the appropriate platform or technology of the tool. The choice for or against a specific technology type (e.g., tablet, computer, smartphone, wearable devices or multiple systems) depends strongly on the purpose and measures’ needs. Factors affecting this step are the available resources (i.e., financial, logistical and staff conditions). The level of technology-literacy of the targeted population needs to be taken in careful consideration. Other considerations include data sharing needs (i.e., how the participant/user data are exported and to whom), data storage structure and access, statistical analysis, programming language used for scripting the tool, how the individual will access the tool, and how their privacy will be maintained.
4.1.4. Step 4: Report on the Customization Features of the Tool
The fourth step is to report on the customization of the features of the tool. These features, such as the type of data entry (e.g., text, voice, image capture, barcode scanning), list of foods and source of food composition data, type of portion size estimation (e.g., standardized portions, household measures or weights, pictures, automatic food volume estimations), need to be evaluated with respect to their adequacy to capture the purpose- and measures-specific needs of a given tool. One evaluation approach is to specifically assess the completeness and adequacy of the foods/recipes included in the tool in order to evaluate whether or how missing items could be added or recipes could be customized. Furthermore, the relevance of the dietary information in the output needs to be evaluated, as well as the need to provide feedback or to set goals for self-monitoring. Overall, details of the features that can be customized should be reported, and if there are any, an individual customization protocol should be developed and followed.
4.1.5. Step 5: Report on the Design, Pretest, and Validation of the Tool
evoke implausible or other undesirable responses. We recommend reporting on the completion time and acceptability for implementing the tool. In addition, report how the tool has been validated and against what standard.
5. Conclusions
Dietary assessment methods that utilize technology provide rapid feedback to users and offer potential cost-savings for researchers. Dietary assessment methods that utilize new technology may be more appealing and engaging than paper-based methods, particularly for children and young adults. Online methods can be deployed to large groups with minimal resources compared with methods requiring in-field researchers. In addition, many of these tools provide rapid feedback to participants that may improve compliance with diet plans or research. Connectivity enables rapid and remote interaction with the participants and nutrition professionals or researchers. Combination methods may enhance the accuracy of dietary intake reporting (such as the use of digital images to improve memory and portion size estimates).
Many of the new technology tools assessed here showed close agreement to traditional methods of dietary intake, but gaps are wider when compared to more objective measures, like TEE from doubly-labelled water, though studies using this method are limited in number. We encourage developers and researchers to publish details about their dietary assessment tools, including those designed for consumer use, and call on the research community to evaluate the validity of the tools they create and use. While we were able to extract details about many features from the tools evaluated, it often required more than one publication to find the necessary information. We recommend that descriptions of tool development and features be clearly written in publications, covering all aspects of tool development, including data entry, food description, customization features, output characteristics, sources of food composition data, and results of usability and validity studies, following the guidance provided here.
Supplementary Materials:The following are available online athttp://www.mdpi.com/2072-6643/11/1/55/s1, Table S1. Search strategies used to identify technology-based tools for dietary intake assessment; Table S2. Details of data extraction and evaluation criteria used to evaluate new technology tools for dietary intake assessment; Table S3. Validation methods for total energy and macronutrients for the technology-based tools used in dietary intake assessment.
Author Contributions: All authors were involved in the design and discussions about study approach and evaluation criteria to be used. A.-K.I. completed the literature searches using PubMed, PLOS, BioMED, and Science Direct. A.L.E. completed the literature searches from OVID. All authors were involved in initial data extraction and coding. A.L.E. duplicated data extraction for all tools. All authors contributed to interpretation of the results. J.E.C., C.P., A.K.-I., and A.L.E. wrote the first manuscript draft, and all reviewed and contributed to the final manuscript.
Funding:This research was funded by the International Life Sciences Institute (ILSI) Europe’s Dietary Intake and Exposure Task Force. C.P.’s time in this project is supported by the National Institute for Health Research Collaboration for Applied Health Research (CLAHRC). The views expressed are those of the author(s) and not necessarily those of the NHS, the NIHR, or the Department of Health and Social Care.
Acknowledgments: The authors, members of the ILSI Expert Group involved in this research, wish to thank Jonathon M. Taberner (Leeds University) for his assistance in the initial literature search, setting up the spreadsheet for the data extraction, and contributing to the scoring of the first 24 tools. We also wish to thank Mariah L. Tabar, international student at UniLaSalle in 2016, for her additional literature search. In addition, we thank the ILSI Europe Dietary Intake and Exposure Task Force, as well as task force manager Nevena Hristozova, for their support.
References
1. Cade, J.E. Measuring diet in the 21st century: Use of new technologies.Proc. Nutr. Soc.2017,76, 276–282. [CrossRef] [PubMed]
2. Cade, J.E.; Warthon-Medina, M.; Albar, S.; Alwan, N.A.; Ness, A.; Roe, M.; Wark, P.A.; Greathead, K.; Burley, V.J.; Finglas, P.; et al. DIET@NET: Best practice guidelines for dietary assessment in health research. BMC Med.2017,15, 202. [CrossRef] [PubMed]
3. Freedman, L.S.; Potischman, N.; Kipnis, V.; Midthune, D.; Schatzkin, A.; Thompson, F.E.; Troiano, R.P.; Prentice, R.; Patterson, R.; Carroll, R.; et al. A comparison of two dietary instruments for evaluating the fat-breast cancer relationship.Int. J. Epidemiol.2006,35, 1011–1021. [CrossRef] [PubMed]
4. Freedman, L.S.; Schatzkin, A.; Midthune, D.; Kipnis, V. Dealing with dietary measurement error in nutritional cohort studies.J. Natl. Cancer Inst.2011,103, 1086–1092. [CrossRef] [PubMed]
5. Blanton, C.A.; Moshfegh, A.J.; Baer, D.J.; Kretsch, M.J. The USDA Automated Multiple-Pass Method accurately estimates group total energy and nutrient intake. J. Nutr. 2006,136, 2594–2599. [CrossRef] [PubMed]
6. Grandjean, A.C. Dietary intake data collection: Challenges and limitations.Nutr. Rev.2012,70(Suppl. 2), S101–S104. [CrossRef] [PubMed]
7. Burrows, T.L.; Rollo, M.E.; Williams, R.; Wood, L.G.; Garg, M.L.; Jensen, M.; Collins, C.E. A systematic review of technology-based dietary intake assessment validation studies that include carotenoid biomarkers. Nutrients2017,9, 140. [CrossRef] [PubMed]
8. Karlsen, M.C.; Lichtenstein, A.H.; Economos, C.D.; Folta, S.C.; Rogers, G.; Jacques, P.F.; Livingston, K.A.; Rancano, K.M.; McKeown, N.M. Web-based recruitment and survey methodology to maximize response rates from followers of popular diets: The Adhering to Dietary Approaches for Personal Taste (ADAPT) feasibility survey.Curr. Dev. Nutr.2018,2, nzy012. [CrossRef] [PubMed]
9. Carter, M.C.; Hancock, N.; Albar, S.A.; Brown, H.; Greenwood, D.C.; Hardie, L.J.; Frost, G.S.; Wark, P.A.; Cade, J.E. Development of a new branded uk food composition database for an online dietary assessment tool.Nutrients2016,8, 480. [CrossRef]
10. Subar, A.F.; Crafts, J.; Zimmerman, T.P.; Wilson, M.; Mittl, B.; Islam, N.G.; McNutt, S.; Potischman, N.; Buday, R.; Hull, S.G.; et al. Assessment of the accuracy of portion size reports using computer-based food photographs aids in the development of an automated self-administered 24-h recall.J. Am. Diet Assoc.2010, 110, 55–64. [CrossRef]
11. Ngo, J.; Engelen, A.; Molag, M.; Roesle, J.; Garcia-Segovia, P.; Serra-Majem, L. A review of the use of information and communication technologies for dietary assessment. Br. J. Nutr. 2009, 101(Suppl. 2), S102–S112. [CrossRef]
12. Illner, A.K.; Freisling, H.; Boeing, H.; Huybrechts, I.; Crispim, S.P.; Slimani, N. Review and evaluation of innovative technologies for measuring diet in nutritional epidemiology.Int. J. Epidemiol.2012,41, 1187–1203. [CrossRef] [PubMed]
13. Lachat, C.; Hawwash, D.; Ocke, M.C.; Berg, C.; Forsum, E.; Hornell, A.; Larsson, C.; Sonestedt, E.; Wirfalt, E.; Akesson, A.; et al. Strengthening the reporting of observational studies in epidemiology-nutritional epidemiology (STROBE-nut): An extension of the strobe statement.PLoS Med.2016,13, e1002036. [CrossRef] [PubMed]
14. Boushey, C.J.; Spoden, M.; Zhu, F.M.; Delp, E.J.; Kerr, D.A. New mobile methods for dietary assessment: Review of image-assisted and image-based dietary assessment methods.Proc. Nutr. Soc.2017,76, 283–294. [CrossRef] [PubMed]
15. Zhang, W.; Yu, Q.; Siddiquie, B.; Divakaran, A.; Sawhney, H. “Snap-n-eat”: Food recognition and nutrition estimation on a smartphone.J. Diabetes Sci. Technol.2015,9, 525–533. [CrossRef] [PubMed]
16. Kong, F.; He, H.; Raynor, H.A.; Tan, J. Dietcam: Multi-view regular shape food recognition with a camera phone.Pervasive Mob. Comput.2015,19, 108–121. [CrossRef]
18. Baranowski, T.; Islam, N.; Douglass, D.; Dadabhoy, H.; Beltran, A.; Baranowski, J.; Thompson, D.; Cullen, K.W.; Subar, A.F. Food Intake Recording Software System, version 4 (FIRSSt4): A self-completed 24-h dietary recall for children.J. Hum. Nutr. Diet.2014,27 (Suppl. 1), 66–71. [CrossRef]
19. Kirkpatrick, S.I.; Subar, A.F.; Douglass, D.; Zimmerman, T.P.; Thompson, F.E.; Kahle, L.L.; George, S.M.; Dodd, K.W.; Potischman, N. Performance of the automated self-administered 24-h recall relative to a measure of true intakes and to an interviewer-administered 24-h recall.Am. J. Clin. Nutr.2014,100, 233–240. [CrossRef]
20. Thompson, F.E.; Dixit-Joshi, S.; Potischman, N.; Dodd, K.W.; Kirkpatrick, S.I.; Kushi, L.H.; Alexander, G.L.; Coleman, L.A.; Zimmerman, T.P.; Sundaram, M.E.; et al. Comparison of interviewer-administered and automated self-administered 24-h dietary recalls in 3 diverse integrated health systems.Am. J. Epidemiol. 2015,181, 970–978. [CrossRef]
21. Kerr, D.A.; Harray, A.J.; Pollard, C.M.; Dhaliwal, S.S.; Delp, E.J.; Howat, P.A.; Pickering, M.R.; Ahmad, Z.; Meng, X.; Pratt, I.S.; et al. The connecting health and technology study: A 6-month randomized controlled trial to improve nutrition behaviours using a mobile food record and text messaging support in young adults.Int. J. Behav. Nutr. Phys. Act.2016,13, 52. [CrossRef] [PubMed]
22. Kerr, D.A.; Pollard, C.M.; Howat, P.; Delp, E.J.; Pickering, M.; Kerr, K.R.; Dhaliwal, S.S.; Pratt, I.S.; Wright, J.; Boushey, C.J. Connecting Health and Technology (CHAT): Protocol of a randomized controlled trial to improve nutrition behaviours using mobile devices and tailored text messaging in young adults. BMC Public Health2012,12, 477. [CrossRef] [PubMed]
23. Pollard, C.M.; Howat, P.A.; Pratt, I.S.; Boushey, C.J.; Delp, E.J.; Kerr, D.A. Preferred tone of nutrition text messages for young adults: Focus group testing.JMIR mHealth uHealth2016,4, e1. [CrossRef] [PubMed] 24. Meijboom, S.; van Houts-Streppel, M.T.; Perenboom, C.; Siebelink, E.; van de Wiel, A.M.; Geelen, A.;
Feskens, E.J.M.; de Vries, J.H.M. Evaluation of dietary intake assessed by the Dutch self-administered web-based dietary 24-h recall tool (Compl-Eat) against interviewer-administered telephone-based 24-h recalls.J. Nutr. Sci.2017,6, e49. [CrossRef] [PubMed]
25. Gurinovic, M.; Milesevic, J.; Kadvan, A.; Djekic-Ivankovic, M.; Debeljak-Martacic, J.; Takic, M.; Nikolic, M.; Rankovic, S.; Finglas, P.; Glibetic, M. Establishment and advances in the online Serbian food and recipe data base harmonized with EuroFIR standards.Food Chem.2016,193, 30–38. [CrossRef] [PubMed]
26. Gurinovic, M.; Milesevic, J.; Kadvan, A.; Nikolic, M.; Zekovic, M.; Djekic-Ivankovic, M.; Dupouy, E.; Finglas, P.; Glibetic, M. Development, features and application of Diet Assess & Plan (DAP) software in supporting public health nutrition research in central eastern european countries (CEEC).Food Chem.2018, 238, 186–194. [PubMed]
27. Zekovic, M.; Djekic-Ivankovic, M.; Nikolic, M.; Gurinovic, M.; Krajnovic, D.; Glibetic, M. Validity of the food frequency questionnaire assessing the folate intake in women of reproductive age living in a country without food fortification: Application of the method of triads.Nutrients2017,9, 128. [CrossRef]
28. Jung, H.J.; Lee, S.E.; Kim, D.; Noh, H.; Song, S.; Kang, M.; Song, Y.J.; Paik, H.Y. Improvement in the technological feasibility of a web-based dietary survey system in local settings.Asia Pac. J. Clin. Nutr.2015, 24, 308–315.
29. Sun, M.; Fernstrom, J.D.; Jia, W.; Hackworth, S.A.; Yao, N.; Li, Y.; Li, C.; Fernstrom, M.H.; Sclabassi, R.J. A wearable electronic system for objective dietary assessment.J. Am. Diet. Assoc.2010,110, 45–47. [CrossRef] 30. Sun, M.; Burke, L.E.; Mao, Z.H.; Chen, Y.; Chen, H.C.; Bai, Y.; Li, Y.; Li, C.; Jia, W. Ebutton: A wearable computer for health monitoring and personal assistance.Proc. Des. Autom. Conf.2014,2014, 1–6. [CrossRef] 31. Jia, W.; Chen, H.C.; Yue, Y.; Li, Z.; Fernstrom, J.; Bai, Y.; Li, C.; Sun, M. Accuracy of food portion size estimation from digital pictures acquired by a chest-worn camera.Public Health Nutr.2014,17, 1671–1681. [CrossRef] [PubMed]
32. Bucher Della Torre, S.; Carrard, I.; Farina, E.; Danuser, B.; Kruseman, M. Development and evaluation of e-ca, an electronic mobile-based food record.Nutrients2017,9, 76. [CrossRef] [PubMed]
34. Rangan, A.M.; Tieleman, L.; Louie, J.C.; Tang, L.M.; Hebden, L.; Roy, R.; Kay, J.; Allman-Farinelli, M. Electronic Dietary Intake Assessment (e-DIA): Relative validity of a mobile phone application to measure intake of food groups.Br. J. Nutr.2016,115, 2219–2226. [CrossRef] [PubMed]
35. de Boer, E.J.; Slimani, N.; van’t Veer, P.; Boeing, H.; Feinberg, M.; Leclercq, C.; Trolle, E.; Amiano, P.; Andersen, L.F.; Freisling, H.; et al. Rationale and methods of the European food consumption validation (EFCOVAL) project.Eur. J. Clin. Nutr.2011,65 (Suppl. 1), S1–S4. [CrossRef]
36. Huybrechts, I.; Geelen, A.; de Vries, J.H.; Casagrande, C.; Nicolas, G.; De Keyzer, W.; Lillegaard, I.T.; Ruprich, J.; Lafay, L.; Wilson-van den Hooven, E.C.; et al. Respondents’ evaluation of the 24-h dietary recall method (EPIC-Soft) in the EFCOVAL project.Eur. J. Clin. Nutr.2011,65 (Suppl. 1), S29–S37. [CrossRef] 37. Freisling, H.; Ocke, M.C.; Casagrande, C.; Nicolas, G.; Crispim, S.P.; Niekerk, M.; van der Laan, J.; de Boer, E.;
Vandevijvere, S.; de Maeyer, M.; et al. Comparison of two food record-based dietary assessment methods for a pan-European food consumption survey among infants, toddlers, and children using data quality indicators.Eur. J. Nutr.2015,54, 437–445. [CrossRef]
38. Park, M.K.; Freisling, H.; Huseinovic, E.; Winkvist, A.; Huybrechts, I.; Crispim, S.P.; de Vries, J.H.; Geelen, A.; Niekerk, M.; van Rossum, C.; et al. Comparison of meal patterns across five European countries using standardized 24-h recall (GloboDiet) data from the EFCOVAL project. Eur. J. Nutr. 2017,57, 1045–1057. [CrossRef]
39. Fallaize, R.; Forster, H.; Macready, A.L.; Walsh, M.C.; Mathers, J.C.; Brennan, L.; Gibney, E.R.; Gibney, M.J.; Lovegrove, J.A. Online dietary intake estimation: Reproducibility and validity of the Food4Me food frequency questionnaire against a 4-day weighed food record.J Med Internet Res2014,16, e190. [CrossRef] 40. Forster, H.; Fallaize, R.; Gallagher, C.; O’Donovan, C.B.; Woolhead, C.; Walsh, M.C.; Macready, A.L.;
Lovegrove, J.A.; Mathers, J.C.; Gibney, M.J.; et al. Online dietary intake estimation: The Food4Me food frequency questionnaire.J. Med. Internet Res.2014,16, e150. [CrossRef]
41. Celis-Morales, C.; Livingstone, K.M.; Marsaux, C.F.; Macready, A.L.; Fallaize, R.; O’Donovan, C.B.; Woolhead, C.; Forster, H.; Walsh, M.C.; Navas-Carretero, S.; et al. Effect of personalized nutrition on health-related behaviour change: Evidence from the Food4me European randomized controlled trial. Int. J. Epidemiol.2017,46, 578–588. [CrossRef] [PubMed]
42. Timon, C.M.; Blain, R.J.; McNulty, B.; Kehoe, L.; Evans, K.; Walton, J.; Flynn, A.; Gibney, E.R. The development, validation, and user evaluation of Foodbook24: A web-based dietary assessment tool developed for the Irish adult population.J. Med. Internet Res.2017,19, e158. [CrossRef] [PubMed]
43. Timon, C.M.; Evans, K.; Kehoe, L.; Blain, R.J.; Flynn, A.; Gibney, E.R.; Walton, J. Comparison of a web-based 24-h dietary recall tool (Foodbook24) to an interviewer-led 24-h dietary recall. Nutrients 2017, 9, 425. [CrossRef] [PubMed]
44. Pendergast, F.J.; Ridgers, N.D.; Worsley, A.; McNaughton, S.A. Evaluation of a smartphone food diary application using objectively measured energy expenditure. Int. J. Behav. Nutr. Phys. Act. 2017,14, 30. [CrossRef] [PubMed]
45. Kristal, A.R.; Kolar, A.S.; Fisher, J.L.; Plascak, J.J.; Stumbo, P.J.; Weiss, R.; Paskett, E.D. Evaluation of Web-based, self-administered, graphical food frequency questionnaire.J. Acad. Nutr. Diet.2014,114, 613–621. [CrossRef] [PubMed]
46. Foster, E.; Hawkins, A.; Delve, J.; Adamson, A.J. Reducing the cost of dietary assessment: Self-completed recall and analysis of nutrition for use with children (SCRAN24).J. Hum. Nutr. Diet.2014,27 (Suppl. 1), 26–35. [CrossRef]
47. Bradley, J.; Simpson, E.; Poliakov, I.; Matthews, J.N.; Olivier, P.; Adamson, A.J.; Foster, E. Comparison of INTAKE24 (an online 24-h dietary recall tool) with interviewer-led 24-h recall in 11-24 year-old.Nutrients 2016,8, 358. [CrossRef]
48. Simpson, E.; Bradley, J.; Poliakov, I.; Jackson, D.; Olivier, P.; Adamson, A.J.; Foster, E. Iterative development of an online dietary recall tool: INTAKE24.Nutrients2017,9, 118. [CrossRef]
49. O’Loughlin, G.; Cullen, S.J.; McGoldrick, A.; O’Connor, S.; Blain, R.; O’Malley, S.; Warrington, G.D. Using a wearable camera to increase the accuracy of dietary analysis.Am. J. Prev. Med.2013,44, 297–301. [CrossRef] 50. Gemming, L.; Doherty, A.; Kelly, P.; Utter, J.; Ni Mhurchu, C. Feasibility of a sensecam-assisted 24-h recall to
51. Gemming, L.; Rush, E.; Maddison, R.; Doherty, A.; Gant, N.; Utter, J.; Ni Mhurchu, C. Wearable cameras can reduce dietary under-reporting: Doubly labelled water validation of a camera-assisted 24 h recall.Br. J. Nutr. 2015,113, 284–291. [CrossRef] [PubMed]
52. Carter, M.C.; Albar, S.A.; Morris, M.A.; Mulla, U.Z.; Hancock, N.; Evans, C.E.; Alwan, N.A.; Greenwood, D.C.; Hardie, L.J.; Frost, G.S.; et al. Development of a UK online 24-h dietary assessment tool: Myfood24.Nutrients 2015,7, 4016–4032. [CrossRef] [PubMed]
53. Albar, S.A.; Alwan, N.A.; Evans, C.E.; Greenwood, D.C.; Cade, J.E. Agreement between an online dietary assessment tool (Myfood24) and an interviewer-administered 24-h dietary recall in british adolescents aged 11-18 years.Br. J. Nutr.2016,115, 1678–1686. [CrossRef] [PubMed]
54. Daniel, C.R.; Kapur, K.; McAdams, M.J.; Dixit-Joshi, S.; Devasenapathy, N.; Shetty, H.; Hariharan, S.; George, P.S.; Mathew, A.; Sinha, R. Development of a field-friendly automated dietary assessment tool and nutrient database for India.Br. J. Nutr.2014,111, 160–171. [CrossRef] [PubMed]
55. Astell, A.J.; Hwang, F.; Brown, L.J.; Timon, C.; Maclean, L.M.; Smith, T.; Adlam, T.; Khadra, H.; Williams, E.A. Validation of the NANA (Novel Assessment of Nutrition and Ageing) touch screen system for use at home by older adults.Exp. Gerontol.2014,60, 100–107. [CrossRef] [PubMed]
56. Timon, C.M.; Astell, A.J.; Hwang, F.; Adlam, T.D.; Smith, T.; Maclean, L.; Spurr, D.; Forster, S.E.; Williams, E.A. The validation of a computer-based food record for older adults: The Novel Assessment of Nutrition and Ageing (NANA) method.Br. J. Nutr.2015,113, 654–664. [CrossRef] [PubMed]
57. Rollo, M.E.; Ash, S.; Lyons-Wall, P.; Russell, A. Trial of a mobile phone method for recording dietary intake in adults with type 2 diabetes: Evaluation and implications for future applications.J. Telemed. Telecare2011, 17, 318–323. [CrossRef] [PubMed]
58. Rollo, M.E.; Ash, S.; Lyons-Wall, P.; Russell, A.W. Evaluation of a mobile phone image-based dietary assessment method in adults with type 2 diabetes.Nutrients2015,7, 4897–4910. [CrossRef] [PubMed] 59. Touvier, M.; Kesse-Guyot, E.; Mejean, C.; Pollet, C.; Malon, A.; Castetbon, K.; Hercberg, S. Comparison
between an interactive Web-based self-administered 24 h dietary record and an interview by a dietitian for large-scale epidemiological studies.Br. J. Nutr.2011,105, 1055–1064. [CrossRef]
60. Liu, B.; Young, H.; Crowe, F.L.; Benson, V.S.; Spencer, E.A.; Key, T.J.; Appleby, P.N.; Beral, V. Development and evaluation of the Oxford WebQ, a low-cost, web-based method for assessment of previous 24 h dietary intakes in large-scale prospective studies.Public Health Nutr.2011,14, 1998–2005. [CrossRef]
61. Galante, J.; Adamska, L.; Young, A.; Young, H.; Littlejohns, T.J.; Gallacher, J.; Allen, N. The acceptability of repeat internet-based hybrid diet assessment of previous 24-h dietary intake: Administration of the Oxford WebQ in UK Biobank.Br. J. Nutr.2016,115, 681–686. [CrossRef] [PubMed]
62. Jacques, S.; Lemieux, S.; Lamarche, B.; Laramee, C.; Corneau, L.; Lapointe, A.; Tessier-Grenier, M.; Robitaille, J. Development of a Web-based 24-h dietary recall for a French-Canadian population.Nutrients2016,8, 724. [CrossRef] [PubMed]
63. Lafrenière, J.; Benoît Lamarche, B.; Catherine Laramée, C.; Julie Robitaille, J.; Lemieux, S. Validation of a newly automated webbased 24-h dietary recall using fully controlled feeding studies.BMC Nutr.2017,3, 34. [CrossRef]
64. Martin, C.K.; Correa, J.B.; Han, H.; Allen, H.R.; Rood, J.C.; Champagne, C.M.; Gunturk, B.K.; Bray, G.A. Validity of the Remote Food Photography Method (RFPM) for estimating energy and nutrient intake in near real-time.Obesity2012,20, 891–899. [CrossRef] [PubMed]
65. Martin, C.K.; Nicklas, T.; Gunturk, B.; Correa, J.B.; Allen, H.R.; Champagne, C. Measuring food intake with digital photography.J. Hum. Nutr. Diet.2014,27(Suppl. 1), 72–81. [CrossRef] [PubMed]
66. Nicklas, T.; Saab, R.; Islam, N.G.; Wong, W.; Butte, N.; Schulin, R.; Liu, Y.; Apolzan, J.W.; Myers, C.A.; Martin, C.K. Validity of the Remote Food Photography Method against doubly labeled water among minority preschoolers.Obesity2017,25, 1633–1638. [CrossRef] [PubMed]
67. Moore, H.J.; Hillier, F.C.; Batterham, A.M.; Ells, L.J.; Summerbell, C.D. Technology-based dietary assessment: Development of the Synchronised Nutrition and Activity Program (SNAP).J. Hum. Nutr. Diet. 2014,27 (Suppl. 1), 36–42. [CrossRef]
69. Daugherty, B.L.; Schap, T.E.; Ettienne-Gittens, R.; Zhu, F.M.; Bosch, M.; Delp, E.J.; Ebert, D.S.; Kerr, D.A.; Boushey, C.J. Novel technologies for assessing dietary intake: Evaluating the usability of a mobile telephone food record among adults and adolescents.J. Med. Internet Res.2012,14, e58. [CrossRef]
70. Ahmad, Z.; Kerr, D.A.; Bosch, M.; Boushey, C.J.; Delp, E.J.; Khanna, N.; Zhu, F. A mobile food record for integrated dietary assessment.MADiMa16 (2016)2016,2016, 53–62.
71. Boushey, C.J.; Harray, A.J.; Kerr, D.A.; Schap, T.E.; Paterson, S.; Aflague, T.; Bosch Ruiz, M.; Ahmad, Z.; Delp, E.J. How willing are adolescents to record their dietary intake? The mobile food record. JMIR mHealth uHealth2015,3, e47. [CrossRef] [PubMed]
72. Boushey, C.J.; Spoden, M.; Delp, E.J.; Zhu, F.; Bosch, M.; Ahmad, Z.; Shvetsov, Y.B.; DeLany, J.P.; Kerr, D.A. Reported energy intake accuracy compared to doubly labeled water and usability of the mobile food record among community dwelling adults.Nutrients2017,9, 312. [CrossRef] [PubMed]
73. Delisle, C.; Sandin, S.; Forsum, E.; Henriksson, H.; Trolle-Lagerros, Y.; Larsson, C.; Maddison, R.; Ortega, F.B.; Ruiz, J.R.; Silfvernagel, K.; et al. A Web- and mobile phone-based intervention to prevent obesity in 4-year-olds (MINISTOP): A population-based randomized controlled trial.BMC Public Health2015,15, 95. [CrossRef] [PubMed]
74. Henriksson, H.; Bonn, S.E.; Bergstrom, A.; Balter, K.; Balter, O.; Delisle, C.; Forsum, E.; Lof, M. A new mobile phone-based tool for assessing energy and certain food intakes in young children: A validation study. JMIR mHealth uHealth2015,3, e38. [CrossRef] [PubMed]
75. Delisle Nystrom, C.; Forsum, E.; Henriksson, H.; Trolle-Lagerros, Y.; Larsson, C.; Maddison, R.; Timpka, T.; Lof, M. A mobile phone based method to assess energy and food intake in young children: A validation study against the doubly labelled water method and 24 h dietary recalls.Nutrients2016,8, 50. [CrossRef] [PubMed]
76. da Silva, M.M.; Sala, P.C.; Torrinhas, R.S.; Waitzberg, D.L. Efficiency of the 24-h food recall instrument for assessing nutrient intake before and after Roux-en-Y gastric bypass.Nutr. Hosp. 2014,30, 1240–1247. [PubMed]
77. da Silva, M.M.; Sala, P.C.; Cardinelli, C.S.; Torrinhas, R.S.; Waitzberg, D.L. Comparison of Virtual Nutri Plus® and Dietpro 5i®software systems for the assessment of nutrient intake before and after Roux-en-Y gastric bypass.Clinics (Sao Paulo)2014,69, 714–722. [CrossRef]
78. Davies, V.F.; Kupek, E.; de Assis, M.A.; Natal, S.; Di Pietro, P.F.; Baranowski, T. Validation of a web-based questionnaire to assess the dietary intake of brazilian children aged 7–10 years.J. Hum. Nutr. Diet.2015,28 (Suppl. 1), 93–102. [CrossRef]
79. Kupek, E.; de Assis, M.A. The use of multiple imputation method for the validation of 24-h food recalls by part-time observation of dietary intake in school.Br. J. Nutr.2016,116, 904–912. [CrossRef]
80. Biltoft-Jensen, A.; Bysted, A.; Trolle, E.; Christensen, T.; Knuthsen, P.; Damsgaard, C.T.; Andersen, L.F.; Brockhoff, P.; Tetens, I. Evaluation of web-based dietary assessment software for children: Comparing reported fruit, juice and vegetable intakes with plasma carotenoid concentration and school lunch observations.Br. J. Nutr.2013,110, 186–195. [CrossRef]
81. Biltoft-Jensen, A.; Trolle, E.; Christensen, T.; Islam, N.; Andersen, L.F.; Egenfeldt-Nielsen, S.; Tetens, I. Webdasc: A Web-based dietary assessment software for 8-11-year-old danish children.J. Hum. Nutr. Diet. 2012,27 (Suppl. 1), 43–53. [CrossRef]
82. Andersen, R.; Biltoft-Jensen, A.; Christensen, T.; Andersen, E.W.; Ege, M.; Thorsen, A.V.; Knudsen, V.K.; Damsgaard, C.T.; Sorensen, L.B.; Petersen, R.A.; et al. What do Danish children eat, and does the diet meet the recommendations? Baseline data from the Opus School Meal Study.J. Nutr. Sci.2015,4, e29. [CrossRef] [PubMed]
83. Labonte, M.E.; Cyr, A.; Baril-Gravel, L.; Royer, M.M.; Lamarche, B. Validity and reproducibility of a Web-based, self-administered food frequency questionnaire.Eur. J. Clin. Nutr.2012,66, 166–173. [CrossRef] [PubMed]
84. Medin, A.C.; Astrup, H.; Kasin, B.M.; Andersen, L.F. Evaluation of a Web-based food record for children using direct unobtrusive lunch observations: A validation study. J. Med. Internet Res. 2015,17, e273. [CrossRef] [PubMed]