Contents lists available atScienceDirect
Journal of Transport Geography
journal homepage:www.elsevier.com/locate/jtrangeo
Spatial data analytics of mobility with consumer data
Mark Birkin
Leeds Institute for Data Analytics and School of Geography, University of Leeds, United Kingdom.
A R T I C L E I N F O
Keywords: Consumer data Attitudes Lifestyle
Consumer behaviour Personal mobility
A B S T R A C T
Consumer data arising from the interaction between customers and service providers are becoming ubiquitous. These data are appealing for research because they are frequently collected and quickly released; they cover a wide variety of attitudes, lifestyles and behavioural characteristics; and they are often dynamically replenished and longitudinal. It is demonstrated that consumer data can make important contributions to understanding problems in transport geography and in solving applied problems ranging from migration, infrastructure in-vestment and retail service provision to commuting and individual mobility. However more effective ex-ploitation of these data depends on the construction of bridges to allow greater freedom in the transfer of data from the commercial to the academic sector; it requires development of frameworks for privacy and ethics in the secondary use of personal data; and it is contingent on the emergence of effective strategies for the amelioration of selection bias which impairs the quality of many consumer data sources.
1. Introduction
Research in transport geography is strongly driven by data, with a strong emphasis on empiricism as well as methodology and policy. Although more qualitative studies have an important place in transport geography and transport studies, the discipline as a whole has a more explicitly quantitative focus than academic geography, especially in the UK where the‘cultural turn’has led to greater emphasis on qualitative approaches.
Census data has been a staple of spatial analysis in many countries, and continues to be seen as important (e.g.Rae, 2016;Lima et al., 2017; Parolin and Rostami, 2017). The data is typically accurate and detailed with high spatial granularity, easily accessible and presented with high standards of documentation. However census data is also limited in significant ways–collection is infrequent and publication of the data can be slow; the outputs are aggregated and do not permit longitudinal analysis for individuals; and limited insights are provided into con-sumption, health, lifestyle and wealth.
Of course many other forms of data have been mobilised to address broader needs in transport geography. Various government sources, diary studies and other forms of primary data collection have generated data which are valuable and focused. These data also have restrictions however, for example the expense of their collection means that they are often collected only at a scale which permits limited disaggregation by geography or specific demographic groups.
Recent studies have been to consider the use of new secondary sources including map data, online timetables, vehicle monitoring and
crowd-sourced data (Savage and Burrows, 2007; Goodchild, 2007; Haklay and Weber, 2008). These may be viewed as the geospatial in-stance of a more general trend towards big data collection which is prevalent in many disciplines. Many of these data are easy to obtain through open data websites (e.g.data.gov.uk,tfl.gov.uk,theodi.org).
Commercial data sets have received much less attention in the lit-erature to date. Consider the example of mobile telephone records. Large operators such as O2 and Vodafone routinely generate billions of call records every day, and the geo-location of such records can therefore yield hugely valuable evidence about individual movement patterns at scale at veryfine timescales (de Montjoye et al., 2014). In the next section of this paper the case will be made that telephone operators are representative of a broader class of consumer data, and the character of such data will be explored. It will be argued that such data are often strongest where census data and other sources are lim-ited. The strengths and opportunities which consumer data may bring are explored further with examples inSection 3.
Consumer data are also restricted in a number of important senses. In the discussion (Section 4) problems in gaining access to consumer data are considered. The significance of ethical issues is stressed and the variable quality of big data is highlighted. The relative importance of new techniques in data science alongside established methods is re-viewed.
The research hypothesis which this paper seeks to investigate is that consumer data will provide valuable ammunition to augment academic investigations in transport geography. It will gauge the challenges and obstacles to a more complete realisation of this project, and suggest
https://doi.org/10.1016/j.jtrangeo.2018.04.012
Received 11 January 2017; Received in revised form 16 July 2017; Accepted 11 April 2018 E-mail address:[email protected].
Available online 01 August 2018
0966-6923/ © 2018 The Author. Published by Elsevier Ltd. This is an open access article under the CC BY license (http://creativecommons.org/licenses/BY/4.0/).
pathways towards their amelioration. The UK Census is utilised as a
‘straw man’to focus certain specific features and capabilities of con-sumer data which are not easily replicated. The benefits of consumer data with respect to other forms of data are also highlighted where this is of direct relevance, although a complete enumeration of types of data in the transport geography literature is beyond the scope of the paper. 2. The advent of consumer data
Administrative data have been characterised as‘found data that are primarily generated for a purpose other than research’(Connelly et al., 2016, p5) [in contrast to‘made data…(which) are designed and col-lected to address well-defined hypotheses‘]. Such data are ‘often col-lected for the purposes of registration, transaction and record-keeping’ (ibid). Consumer data are ‘found’ in a similar way within the com-mercial transactions of business organisations and service providers.
The widespread adoption of e-business, m-commerce and diverse socio-technical innovations from loyalty cards to sensors means that consumer data are now being generated perpetually in the slipstream of everyday life. Retail transactions in malls, restaurants, bars and coffee shops may be logged by loyalty cards, and if purchases require the provision of additional information e.g. for product guarantees then there is a strong likelihood that this will be added to a large panel of similar responses. Trips to health clubs will be added to a database of membership and activities, or increasingly monitored and shared through wearable devices. Even while we sleep devices such as smart energy meters will continue to monitor activity within our households. A simple anchor for the concept is the notion of consumption or market-based exchange of value, and this suggests potential for a boundary to be drawn to administrative data which are collected for the purpose of government or public administration. Hence tax or pension records may be considered administrative, whereas smart tickets asso-ciated with travel patterns should logically to be considered as ex-amples of consumer data, even where the associated transport provider is a local authority or public body. On the basis of this definition, data which are both collected and distributed freely would be excluded. For example, Open Street Map (Haklay, 2010) would not be considered as consumer data on this basis, but products with similar content such as Google Maps or Ordnance Survey map products could reasonably be treated as such. Housing might be considered as an equally nuanced instance, particularly in relation to rental properties. Privately rented accommodation seems to fall squarely into the domain of consumer data, but property under common ownership (known as ‘council housing’in the UK) appears to be at the same time both administrative (in the means of collection and management through local authorities) but relates to a transaction with an obviousfinancial component (the payment of rent).
The treatment of‘social media’as a data type might also be con-sidered at greater length. In some ways social media have similarities to open data which are crowd-sourced, but at the same time the data are collected and controlled by organisations like Twitter and Facebook many of which have catapulted in value on the basis of the commercial value of these data. For the purposes of this paper a broad and inclusive perspective on consumer data will be adopted as an emerging source with its roots in some form of market-based exchange of value.
It is clear that consumer data are extremely varied in their sub-stantive focus, composition, and means of collection. The contributors include businesses whose sector focus is retail, transport, health, en-ergy, finance, property and leisure. Demographic data relating to the population at large are being accessed from a number of partners whose primary business is market analysis. The most well-established datasets include transactions (e.g. outlet sales data), routine administrative data (e.g. customer records) and surveys. More recent sources include loy-alty cards, sensors, smart tickets and wearable devices. The composition of many of the data relates to individuals (e.g. personal health status) and households (e.g. family income), but also includes dwellings (e.g.
property value), sales outlets (e.g. transactions by retail unit), trips (e.g. smart tickets) and devices (e.g. wearables, smart meters).
The extent to which consumer data may be classed as‘big data’is worthy of further attention. Regarding the traditional‘3 Vs’(Laney, 2001) then consumer data is often characterised by volume, velocity and variety. The volumes of data generated from mobile telephone logs have already been noted. A retail organisation with ten million custo-mers each visiting a store once a week to purchase 20 products or more would also generate tens of billions of transactions at the customer-product level. It will be seen later that consumer data also move at high velocity. In some cases - mobile phones again, smart tickets or online retail transactions–then real-time analytics may be plausible. Major purchase decisions such as house moves might be monitored on a less frequent basis, by month, quarter or even annually and still operate much more rapidly than conventional sources such as the Census. The variety of consumer data is arguably more notable still, reflecting at-titudes and behaviour e.g. in relation to health, leisure, education, work and social interaction, all of which have important implications for transport and mobility.
The additional Vs of‘veracity’(Lukoianova and Rubin, 2014) and
‘value’ (Lavalle et al., 2011) are also of prominent importance for consumer data. In the next section of the paper, a range of examples will be introduced which highlight the value of these new sources from a range of perspectives. Consumer data offer wide-ranging insights on preferences or revealed behaviour relating to transactions which have actually taken place. Nevertheless the veracity (or reliability) of con-sumer data is more challenging. Typically such data are drawn from self-selecting and skewed population samples. They are also funda-mentally secondary, having been captured as the by-product from a social process, rather than primary sources which are focused to a specific research question or hypothesis (as in a typical panel survey, for instance).
Uneven data quality and bias are important issues for consumer data, but an even more important issue is data availability. The fun-damental challenge here is that consumer data are collected and owned by business organisations and so there is a gap to be bridged if academic access is to be established. A related question concerns the ethics of consumer data exploitation since a well-established principle of inter-national law is that the secondary re-use of data collected for one purpose infringes the privacy of the individual. These topics are high-lighted as appropriate in the examples, and discussed at greater length inSection 4of the paper.
3. The power of consumer data
This section of the paper is framed around a series of examples which point towards the benefits of exploiting consumer data in aca-demic research. For clarity of exposition, these examples are arranged to demonstrate a counterpoint between the restrictions of census data and the strengths of consumer data. Whereas census data are generated intermittently over a long cycle of planning and delivery, consumer data are often contemporaneous. While census data are focused on the socio-economic and demographic character of small area populations, consumer data have broad coverage of lifestyle, activities, behaviour and attitudes. Thirdly, where census data are captured in cross-section at a point in time, consumer data are generated dynamically in repeat. These elements are now considered in turn.
3.1. Consumer data are contemporaneous
census taking several years from collection to release. For example, origin-destination statistics for workplace zones in England and Wales were published on March 25th 2015 (ONS, 2015). On March 24th the latest equivalent census data would therefore have been 14 years out of date, relating to April 2001.
In contrast, consumer data are often continually collected and up-dated. A good example would be from information which is collected by online estate agents who typically operate across a complete national market with extensive customer databases. Major businesses in this category in the UK include Zoopla, RightMove and Purple Bricks. Data recently released by Zoopla for use within the academic community shows transactions for 1.2 million house moves, including additional attributes such as price, number of bedrooms and bathrooms, property type and most importantly including postcodes for both the existing and the new property (more details atwww.data.cdrc.ac.uk).
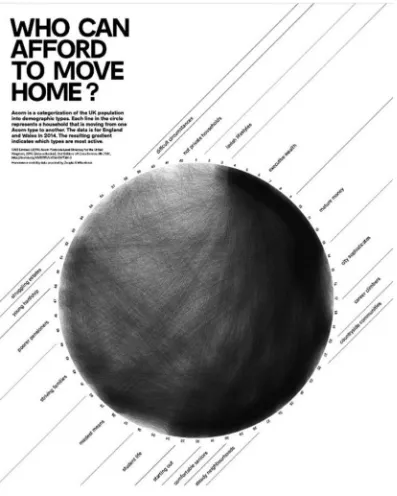
In recent work with these data, thefine spatial detail of both origins and destinations of house moves has been exploited to create a unique picture of geodemographic mobility. Each origin and destination post-code was assigned a neighbourhood profile from CACI's ACORN clas-sification (acorn.caci.co.uk). Other geodemographic typologies in-cluding the open source Output Area Classification (Gale et al., 2016) might equally well be appended to these postcodes. ACORN has been used here because it has the appealing feature that it approximates a continuum of affluence from ‘difficult circumstances’to ‘lavish life-styles’. This continuum is represented inFig. 1as a circle running an-ticlockwise from the most deprived communities at the top of the il-lustration. Each instance is represented by a thin black line connecting the two neighbourhood types at the beginning and end of each move. The diagram shows very clearly that there is a strong tendency for households to move between similar types of areas. Still more inter-esting is a pronounced gradient of increasing mobility between the most affluent neighbourhoods. The data inFig. 1relates to changing home ownership in England and Wales in 2014, which have now been up-dated to 2015 and extended through the inclusion of dwelling rentals. Data are available to third party users for approved purposes (www. cdrc.ac.uk).
The importance of this work is indicated by a substantial academic literature on individual and household migration in the UK (Champion, 2007) and internationally (Stillwell et al., 2016). Consumer data can augment classical studies with conventional sources through a combi-nation offine spatial resolution, updateability, and additional co-vari-ates such as income and house prices. Patterns can be related to the latest social and market forces, such as austerity and Brexit, or major infrastructure investments like Crossrail and HS2 (Transport for the North, 2015). For example, the immediate impact on social mobility through the introduction of a new ‘bedroom tax’ in the UK (British Welfare Reform Act, 2012) could be assessed e.g. by comparing from year to year or from one quarter to another, without waiting 9 years for a new census, by which time further interventions will have compli-cated the picture. House price data have been available in the UK at a fine spatial scale for some time (landregistrydata.gov.uk) but these data lack the interactions which are accessible through consumer data for the property market. Other studies using panel data can also provide insights into residential location decisions (e.g. Ettema and van Nieuwenhuis, 2016) but these are expensive to generate and hard to translate across locations due to their restricted sample size.
3.2. Consumer data have breadth
ONS have characterised the UK Census as a study of‘who we are, how we live and what we do’. This statement does not stand up to close scrutiny. Certainly coverage is wide-ranging in terms of the socio-eco-nomic and demographic characteristics of the population. However many aspects of lifestyle, attitudes and behaviour are beyond the scope of the Census. Examples which could potentially be richly informed by consumer data include dietary patterns (e.g. from supermarket loyalty
cards), affluence (e.g. from house prices, credit cards or bank records) and leisure patterns (e.g. from gym memberships, cinema attendance, holiday questionnaires).
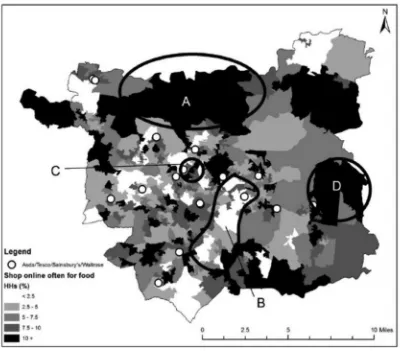
One aspect in which consumer data can add significant breadth is in relation to active travel. While it is true that the census captures data about journey patterns, inferences about mode preference are limited to the capture of a single question relating to trip selection for commuting on census day itself. Wearable devices are now starting to create a much more detailed picture of exercise patterns for recreation,fitness, work and other routine daily activities. Examples from an app with several thousand users (CDRC, 2017) are shown inFig. 2. The benefits of active travel, and the relative merits of high intensity short duration activities (eg cycling) versus low intensity long duration (e.g. walking) could be richly informed by analytics of daily mobility data from sources such as these, especially if health outcomes could be linked (Sabia et al., 2014). A different kind of example with many ramifications for transport geography is illustrated inFig. 3. Here data from a supermarket loyalty card programme is able to distinguish between transactions which take place in store and those which take place online. Overlaying these data with the underlying social geography (demographics and urbanisation), competitor networks and transport networks provides rich evidence for the analytics of social and spatial effects–for example, whether online share can substitute for physical accessibility in areas of lowfloorspace provision and the extent to which laggards (e.g. the elderly and less affluent) have begun to close the gap with early adopters of the new technology. The map shows a relatively complex outcome from the tension between two rather simple effects–the desire of rural residents with low supermarket access to shop online, versus the tendency for young, well-educated early adopters to cluster in urban areas. Under-standing variations in the demand preferences of retail customers is important in assessing spatial inequalities, land use zoning and dis-tribution networks, with implications for policy regulation both na-tionally (e.g. competition) and locally (e.g. planning processes). Similar insights are not possible from the Census, which lacks a focus on either retail trips or expenditure.
3.3. Consumer data are dynamic
By definition, the census is by nature fundamentally an audit of the state of the population at a point in time, providing a detailed snapshot of socio-economic and demographic conditions at a single point in time. In contrast, many forms of consumer data are continually replenished at a high velocity, and increasingly at or close to real time. Examples of data which are collected at very high speed include number plate re-cognition sensors in car parks or on toll roads, online retail websites which track or increasingly seek to influence customer search and purchasing behaviour, and biometric markers which are continually monitored by wearable devices such as smart watches and accel-erometers.
Furthermore, consumer data are typically collected in a way which facilitates longitudinal interrogation. Supermarket loyalty cards include repeat shopping transactions by a single individual cardholder over extended periods of time. Account-based business models, such as social media using a combination of unique identifying credentials will naturally connect interactions of a specific user in time and often in space.
Cross-referencing these mobilities in both space and time starts to re-veal variable patterns suggesting the underlying construction of in-dividual movement behaviours. It is notable for example that the su-permarket profiles are quite different on a Saturday and Sunday to those in the week, but equally that coffee houses in suburban zones have a very different patterns of business when compared to their city centre equivalents.
The space-time geography of mobility patterns within cities has been the subject of elegant theories since at least the 1960s (Hägerstrand, 1967). In the past, evidence about individual movements has been collected using diaries and panel studies which are expensive and inexact. Small area spatial analysis is typically impossible with such sparse data. Thus it has been the case that‘there are often too few travel
diary records (A)s with most metropolitan surveys,…census tracts can (only) be combined into sub-areas…larger than a residential neigh-bourhood’ (Cervero and Kockelman, 1997). Even relatively recently, the implementation of small number studies has been expensive leading to restricted sample sizes and a similar absence of spatial detail (e.g. van den Berg et al. (2013)with 747 ‘useful’diaries, orRubin et al. (2014)with less than 2000 cases from a national panel).
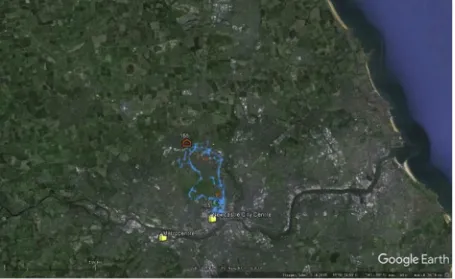
[image:4.595.102.499.55.551.2]An example of real-time consumer data which is generated from a mobile device is shown inFig. 5. In this case data are generated from a journey-planning app which can be downloaded to a smartphone and produces a breadcrumb trail of the mobility of the user–or strictly speaking the device–at regular intervals throughout the day. Algo-rithms can be devised to add value to data of this type including Fig. 1.Migration, affordability and neighbourhood characteristics.
Activity analysis from sample data
Activity profile for app users
[image:5.595.100.496.57.317.2]Velocity profile for app users
Time spent exercising by app users
Fig. 2.a. Activity analysis from sample data. b. Activity profile for app users. c. Velocity profile for app users. d. Time spent exercising by app users.
[image:5.595.98.498.345.696.2]assignment of mode of travel according to the speed and modularity of individual trajectories, linked if necessary to third party data such as bus and rail timetables (Zahabi and Patterson, 2016). The capability to profile mobilities around the clock with consumer data provides new insights into service delivery, for example to distinguish between lo-cations for the provision of convenience versus big box supermarket retailing (Waddington et al., 2018).
Dynamic movement patterns in real-time show great potential for the analysis of mobility behaviours with the capacity for predictive analytics to inform interventions or‘what if?’ policy effects. For ex-ample, a Propensity to Cycle tool has been developed for policy use by a multidisciplinary and multi-institutional research group blending census data with social media records from sources such as CycleStreets.net. The tool aims to evaluate the impact of changing propensities to cycle alongside new infrastructure investment to
evaluate health and environmental benefits of behavioural adjustment (Woodcock et al., 2017).
4. The challenges of consumer data
While stressing the benefits and opportunities from the deployment of consumer data for mobility studies, the examples ofSection 3have also identified a number of obstacles which might impede further progress. In this section four major challenges are considered under the following headings–access to data; privacy and ethics; data quality; and predictive capabilities.
4.1. Access to data
Since consumer data arise as the product of a commercial
Supermarket -Weekday
Supermarket -Weekend
Coffeehouse -Weekday
Coffeehouse -Weekend
Supermarket - City Supermarket -Suburbs
[image:6.595.130.467.57.240.2]Coffeehouse - City Coffeehouse -Suburbs
Fig. 4.Space-time activity profiles by format and location.
[image:6.595.72.527.449.728.2]transaction between an organisation and its customers the data are typically owned and controlled by business organisations which are external to the academic sector. In order to exploit such data for re-search it is therefore necessary to construct bridges to promote theflow of data from business to academia. The case for sharing data in this way can be driven through a number of principles:
i. Corporate social responsibility–organisations are willing to share data in order to demonstrate a contribution to society which may form an important of a brand proposition or corporate ethos. An excellent example in the context of consumer data would be the D4D-Senegal open innovation data challenge in which the goal is‘to help address society development questions in novel ways by…
(allowing)…access to three mobile phone datasets’(de Montjoye et al., 2014).
ii. Common interest – organisations are willing to share data with academic partners in order to promote research which is of specific interest to the data owner. This has historically been a popular basis for providing access. The dangers in such an approach are that it could distort the conduct of academic research from the most im-portant or intellectually challenging problems to those which are of the greatest commercial value, and that if the sharing of data is restricted then the research may be impossible to replicate. iii. Legal enforcement–in response to consultation on the (then) digital
economy bill in the UK it has been argued that‘data sharing for research purposes can … ultimately benefit the wider public …
(through inclusion of) private sector data’(ESRC, 2016). However the Act itself only extends to voluntary sharing of administrative data for uses such as ‘improve(d) public service delivery’ (HM Government, 2017, Section 35) or fuel poverty (Sections 36, 37). Further legislation would thus be required to mandate sharing of consumer data for research purposes.
iv. Data mutualisation – the principle that personal data should be owned and controlled not by the collectors of the data but by the individuals to whom the data pertain. Frameworks are now begin-ning to emerge in which individuals might choose to pool their data in order to achieve desired goals which might potentially include academic research -‘a world in which everyone owns and controls their own data’(www.digi.me).
Open data has been promoted as a means to solve the problem of access to big data sets. In the above example, the mobile telephone company Orange has made data available (i.e. D4D-Senegal) with useful applications for mobility research. TfL is another organisation which has made a strategic commitment to sharing data with the as-piration to encourage algorithms and apps which are of value to its stakeholders (Everitt, 2014). A number of Open Data Institutes (https:// theodi.org/) have now been established to promote use of data sets relating to e.g. air quality, vehicle movements and social media.
The Open Data model is poorly suited to consumer data in view of the commercial value or sensitivity of business data. In order to make consumer data more widely available to encourage reproducibility but within a controlled environment, the Economic and Social Research Council has commissioned the creation of a network of big data re-positories, including the Consumer Data Research Centre, Urban Big Data Centre and Business & Local Government Research Centre. The Centres follow an operating model previously established by the UK Data Service which distinguishes between open, safeguarded and secure data, embedded in research approvals processes which restrict access to bonafide academic purposes and applying high standards of physical security where necessary. This has not yet been widely replicated on the international stage, although national statistical agencies are beginning a more active exploration of consumer data into official statistics e.g. in the Netherlands using mobile phone data to estimate daytime popula-tions in its Centre for Big Data Statistics (www.cbs.nl).
4.2. Privacy and ethics
Some of the difficulties associated with research use of big data are highlighted by the recent ICO ruling (3rd July 2017) on the legality of data sharing between Google Deep Mind and the Royal Free Hospital (ICO, 2017). In July 2015 the health care provider agreed to provide 1.6 million patient records for improved health diagnosis with big data analytics. While noting the ‘huge potential that creative use of data could have for patient care’, the ruling has beenfirm in restating the clear frameworks and procedures which need to be adopted in order to undertake such work. The essence of the legal framework is that in-dividual level data may not be used for secondary research beyond the purpose for which they were originally collected without the knowl-edge and consent of the subject.
Three approaches to enforce privacy are adopted within the census itself. Thefirst is the principle of aggregation, so that data are released as tabular counts coded to specific neighbourhoods. The second is the principle of perturbation, which has been implemented in the UK Census by a process of‘Barnardisation’in which cell counts are ran-domly incremented or decremented in specific tables. Procedures for perturbation or differential privacy e.g. through the addition of random noise to data are also well-known in the statistics literature (Dwork, 2008). The third principle is anonymisation, so that where samples of individual data are made available (for restricted use only) then po-tentially disclosive identifiers are replaced by suitably coarse attributes, including the substitution of broad regional geographies for local neighbourhood attribution.
The principle of aggregation has been widely adopted in emerging uses of consumer data for academic research. For example, income data from unique households may be averaged across larger spatial units including streets with ten to twenty properties in order to preserve confidentiality. This allows safe and legal use of data but restricts value. Thus a recent study set out to explore the hypothesis that income and obesity are (negatively) correlated where the key decision-making unit is a household or the individuals within it. Further aggregation weakens the power of inference. In order to benefit from data linkage e.g. of expenditure records to health outcomes then pseudonymisation, ex-plicit consent or trusted third party linkage are options. The possibly of explicit consent to link consumer loyalty card data to patient outcomes is currently being pursued in a project between researchers and Leeds Teaching Hospitals Trust, but the proof of concept stage of this project alone will take several months or years to complete.
4.3. Quality
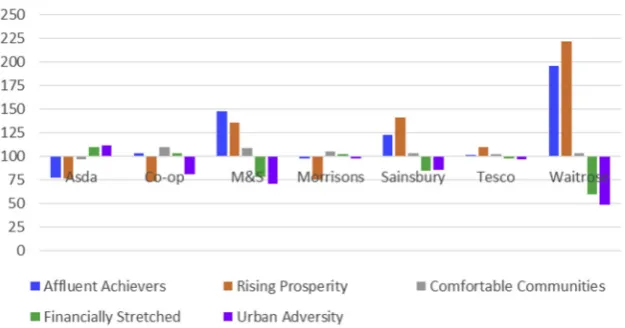
An evaluation of strategies for ameliorating the selection bias in consumer data is urgently required. Variable response rates from social media data, particularly with lower utilisation amongst older demo-graphics, have been widely reported. Typically, retailers and service organisations will have target markets which are unevenly distributed. Since geodemographic classifications have been developed as a means to incorporate multidimensional social and demographic variations on the basis of simple area-based indicators, then these also present themselves as a means to explore bias. An example is shown inFig. 6 (Kirby-Hawkins, 2017), where the customer base of several large retail organisations has been profiled using a geodemographic classification, demonstrating a significant skew towards affluent and rural areas.
hence data relating to characteristics such as house prices or incomes, which are perceived as sensitive, are likely to be under-reported re-lative to less contentious aspects such as age or gender. Furthermore, data on activities and behaviour are likely to be partial–it is possible that a basket of supermarket purchases revealing a healthy lifestyle is countered by different patterns of consumption in quick service res-taurants or bars.
In order to alleviate the difficulties presented by selection bias, a microsimulation approach has been adopted elsewhere (Birkin et al., 2017). Here individual attributes were simulated across the population of a whole city, and then linked with consumer data on travel desti-nation choice using shared demographic attributes including age, gender, family status and social group. In effect this presents a so-phisticated reweighting mechanism to adjust from a consumer data sample to a complete population.
Self-selection in the sample can also be an important challenge for consumer data. If activity data from wearable devices is to be exploited, how is it possible to gauge the likelihood that the individuals in a given demographic segment are more likely to adopt the technology if they have a more active lifestyle to begin with? Approaches based on some form of cross-validation (Lovelace et al., 2016) are perhaps the most likely way forward. For example movement data from a self-selecting app could be scaled up to a more complete and independent source such as sensor data in order to increase levels of robustness.
4.4. Methods
Transport geography has developed a rich tradition in spatial ana-lysis with a huge arsenal of methods and theories ranging from spatial interaction models and microsimulation to agent-based simulation and discrete choice modelling. Such techniques are rich in potential for application in the new domain of consumer data research, in much the same way that gravity models from the 1970s and 1980s were shown to have powerful application to business planning with commercial data in the 1990s and beyond (Birkin et al., 2002, 2010). The scope for a
‘Fourth Paradigm’ in which new mathematical and computational methods are required to drive forward new approach to inductive and data intensive research (Bell et al., 2009;Hey et al., 2009) should be therefore be qualified by the capacity for absorption of new data within existing methods frameworks.
At the same time, the methods themselves will continue to evolve and diversify, not least through translation of research between dis-ciplines. The generation of increasingly large samples of human movement from accelerometers or other mobile devices may call for the adaptation of methods from topology or computational geometry which may already have been translated into contexts from the natural world
in which tracking and tagging have been established for longer (Dodge et al., 2016). Natural language processing could be richly beneficial in adding value to increasingly widespread data from text or video (Procter et al., 2013). A variety of methods from machine learning, such as random forests, supervised learning, and support vector machines all have proven capability for the analysis of movement amongst human populations (Carlos and Matos, 2013). The introduction of new con-sumer data sets could therefore offer a powerful stimulus to the de-velopment of existing methods and their integration with some of the best of the new approaches.
5. Conclusions
New forms of data continue to proliferate. Consumer data arises from sources ranging from retail transactions and customer records to loyalty cards and wearable devices. These data are varied, and often generated at high velocity. The volume of specific datasets can be great, but is not necessarily so.
Consumer data have distinctive characteristics which offer great potential when used as a complement or as an alternative to census data. Beneficial features are that consumer data are contemporaneous where census data are legacy; they are often dynamic and longitudinal rather than cross-sectional and static; and can provide a breadth of content beyond the socio-economic and demographic. When compared to data collection from travel diaries or other forms of primary research data collection consumer data are likely to be cheap, scalable to na-tional and sometimes internana-tional scales, and collected in sufficient volume to provide better levels of spatial and temporal disaggregation. The augmentation of research in transport geography using con-sumer data is indicated by a number of case studies which have been introduced here. The breadth of consumer data means that it is possible to investigate mobility patterns and processes in the retail and leisure sectors, revealing new patterns such as spatial variation in channel preferences for consumer purchasing. The dynamics of consumer data are making it possible to understand the daily, weekly and seasonal variations in city life, under strong influence of urban morphology and infrastructure, including transport. The contemporaneous supply of consumer data increases the impact of research in transport geography, making it immediately applicable to emerging trends and social infl u-ences. This may be particularly significant for policy applications e.g. allowing new legislation to be evaluated in a much more timely fashion than is possible through long-cycle surveys such as a national census.
[image:8.595.142.455.74.238.2]should not be ignored. It is important to design and implement conduits for data sharing between academic and business organisations through investment in infrastructure such as ESRC's Big Data Network in the UK. Acknowledgement
This research has been supported by the Consumer Data Research Centre, an ESRC Investment, ES/L011840/1; ES/L011891/1.
References
Bell, G., Hey, T., Szalay, A., 2009. Computer science: beyond the data deluge. Science 323, 1297–1298.
Birkin, M., Clarke, G., Clarke, M., Wilson, A., 2002. Retail Geography and Intelligent Network Planning. Wiley, Chichester.
Birkin, M., Clarke, G., Clarke, M., 2010. Refining and operationalising entropy max-imizing models for business applications. Geogr. Anal. 42 (4), 422–445.
Birkin, M., Morris, M., Birkin, T., Lovelace, R., 2017. Using census data in microsimula-tion modelling. In: Stillwell, J. (Ed.), Census Users Handbook 2011. Ashgate, London. Carlos, J., Matos, S., 2013. Predictingflu incidence from Portuguese tweets. In:
Proceedings of the International Work-Conference on Bioinformatics and Biomedical Engineering; Mar 18-20; Granada, Spain, pp. 11–18.
Cervero, R., Kockelman, K., 1997. Travel demand and the 3Ds: density, diversity and design. Transport. Res. D 2 (3), 199–219.
Champion, A.G., 2007. Migration and socioeconomic change: a 2001 census analysis of Britain's larger cities. Press, Policy.
Clarke, G., Thompson, C., Birkin, M., 2015. The emerging geography of e-commerce in British retailing, Regional Studies. Reg. Sci. 2 (1), 370–390.
Connelly, R., Playford, C., Gayle, V., Dibben, C., 2016. The role of administrative data in the big data revolution in social science research. Soc. Sci. Res. 59, 1–12. Consumer Data Research Centre, 2017. Bounts Data Profile. CDRC, Leeds.
de Montjoye, Y.A., Smoreda, Z., Trinquart, R., Ziemlicki, C., Blondel, V.D., 2014. D4D-Senegal: The Second Mobile Phone Data for Development Challenge.http://www. arXiv.org.
Dodge, S., Weibel, R., Ahearn, S.C., Buchin, M., Miller, J.A., 2016. Analysis of movement data. Int. J. GIS 31, 1–10.
Dwork, C., 2008. Differential privacy. In: International Conference on Theory and Applications of Models of Computation: Theory and Applications of Models of Computation, pp. 1–19.
ESRC, 2016. Digital Economy, Written Evidence: Economic and Social Research Council with Input from the Medical Research Council (DEB 59) 20.10.2016.http://services. parliament.uk/bills/2016-17/digitaleconomy/documents.html.
Ettema, D., van Nieuwenhuis, R., 2016. Residential self-selection and travel behaviour: What are the effects of attitudes, reasons for location choice and the built environ-ment? J. Transp. Geogr. 59, 146–155.
Everitt, V., 2014. Delivering better customer information through free open data. Public Transport Int. 63 (1), 8–11.
Gale, C., Singleton, A., Bates, A., Longley, P., 2016. Creating the 2011 area classification for output areas (2011 OAC). J. Spat. Inform. Sci. 1–27.
Goodchild, M., 2007. Citizens as sensors: the world of volunteered geography. GeoJournal 69 (4), 211–221.
Hägerstrand, T., 1967. Innovation Diffusion as a Spatial Process. University of Chicago Press, Chicago.
Haklay, M., 2010. How Good is Volunteered Geographical Information? A comparative study of openstreetmap and ordnance survey datasets. Environ. Plan. B 37, 682–703.
Haklay, M., Weber, P., 2008. OpenStreetMap: user-generated street maps. IEEE Pervasive Comput. 7, 12–18.
Hey, T., Tansley, S., Tolle, K., 2009. The Fourth Paradigm: Data-Intensive Scientific Discovery. Microsoft Research.
HM Government, 2017. Digital Economy Act.legislation.gov.uk.
Information Commissioner's Office, 2017. Royal Free - Google DeepMind trial failed to comply with data protection law. ICO (3/7/2017).
Kirby-Hawkins, E., 2017. Designing a location model for face to face and on-line retailing for the UK grocery market. Unpublished PhD thesis. University of Leeds. Laney, D., 2001. 3d data management: controlling data volume, velocity and variety.
Meta Group Res. Note 6, 70.
Lavalle, S., Lesser, E., Shockley, R., Hopkins, M.S., Kruschwitz, N., 2011. Big data, ana-lytics and the path from insights to value. MIT Sloan Manag. Rev. 52 (2), 21–31. Lima, J., Maia, M., Lucas, K., 2017. Income vs. travel time: Why do the poorest and the
richest travel fastest in northeastern Brazil? 25. pp. 4289–4299.
Lovelace, R., Birkin, M., Clarke, M., Cross, P., 2016. From big noise to big data: towards the verification of large datasets for understanding regional retailflows. Geogr. Anal. 48, 59–81.
Lukoianova, T., Rubin, V.L., 2014. Veracity roadmap: is big data objective, truthful and credible? Adv. Classification Res. Online 24 (1).https://doi.org/10.7152/acro.v24i1. 14671.
Office for National Statistics, 2015. Origin-destination Statistics on Migration for Local Authorities in the United Kingdom and on Workplace for Output Areas and Workplace Zones, England and Wales.http://webarchive.nationalarchives.gov.uk/ 20160106094447/http://www.ons.gov.uk/ons/rel/census/2011-census/origin- destination-statistics-on-migration-and-students-for-local-authorities-in-the-united-kingdom/index.html(accessed 14th July 2017).
Parolin, B., Rostami, S., 2017. Identifying the transport needs of the transport dis-advantaged groups in rural areas of New South Wales, Australia: a case study. 1. pp. 15–26.
Procter, R., Vis, F., Voss, A., 2013. Reading the riots on Twitter: methodological in-novation for the analysis of big data. Int. J. Soc. Res. Methodol. 16, 197–214. Rae, A., 2016. The geography of travel to work in England and wales: extracts from the
2011 census. Appl. Spatial Anal. Policy 9, 1–17.
Rubin, O., Mulder, C., Bertolini, L., 2014. The determinants of mode choice for family visits–evidence from Dutch panel data. J. Transp. Geogr. 38, 137–147. Sabia, S., van Hees, V., Shipley, M., Trenell, M., Hagger-Johnson, G., Elbaz, A., Kivimaki,
M., Singh-Manoux, A., 2014. Association between questionnaire- and accelerometer-assessed physical activity: the role of sociodemographic factors. Am. J. Epidemiol. 179 (6), 781–790.
Savage, M., Burrows, R., 2007. The coming crisis of empirical sociology. Sociology 41 (5), 885–899.
Stillwell, J., Bell, M., Ueffing, P., Daras, K., Charles-Edwards, E., Kupiszewski, M., Kupiszewska, D., 2016. Internal migration around the world: comparing distance travelled and its frictional effect. Environ Plan A 48, 1657–1675.
Transport for the North, 2015. The Northern Powerhouse: One Agenda, One Economy, One North. HM Government.
van den Berg, P., Arentze, T., Timmermans, H., 2013. A path analysis of social networks, telecommunication and social activity–travel patterns. Trans. Res. C 26, 256–268. Waddington, T., Clarke, G., Clarke, M., Newing, A., 2018. Open all hours: spatiotemporal
fluctuations in U.K. grocery store sales and catchment area demand, The International Review of Retail. Distrib. Consumer Res. 28 (1), 1–26.
Woodcock, J., Goodman, A., Lovelace, R., Aldred, R., 2017. Applying the propensity to cycle tool: case studies from England. J. Trans. Health 5, S88–S89.