Running head: Prospective memory in the red zone
Accepted, Journal of Experimental Psychology: Applied, 20/02/2019.
Table
Page
S1
Wald Chi-square test of ongoing task RT.
2
S2
Wald Chi-square test of ongoing task accuracy.
3
S3
Wald Chi-square test of PM task RT.
4
S4
Wald Chi-square test of PM task accuracy.
4
S5
Wald Chi-Square Table for 0.1 quantiles of RT.
4
S6
Pairwise comparisons of ongoing task RT by stimulus, PM condition,
and session.
5
S7
Pairwise comparisons of ongoing task mean correct RTs by Stimulus
and Trial Response Order.
6
S8
Pairwise comparisons of ongoing task mean correct RTs by Session, PM
Condition, and Response Order.
7
S9
Pairwise comparisons of ongoing task accuracy by Stimulus and Trial
Response Order.
8
S10
Pairwise comparisons of ongoing task accuracy by Stimulus, PM
Condition, and Session.
9
S11
Pairwise comparisons of ongoing task accuracy by Session and
Response Order.
10
S12
Pairwise comparisons of PM task RT by Trial Response Order.
10
S13
Pairwise comparisons of PM task accuracy by Stimulus and Session.
11
S14
Chi-square tests examining how frequently PM ships were responded to
first, second, or third within trials for each participant.
12
S15
Parameter values for the expanded model that includes effects of session
on non-PM accumulation. The parameters that do not vary by PM
condition.
13
Figure
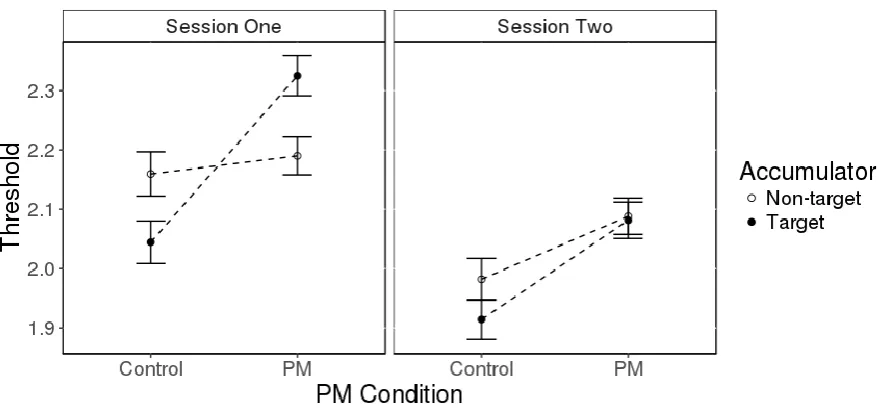
S1
Ongoing task decision thresholds for the expanded model that includes
effects of session on non-PM accumulation.
14
S2
Non-PM accumulation rates for the expanded model that includes effects
of session.
15
S3
Ongoing task accumulation rates to non-PM ships compared with PM
ships for the expanded model that includes effects of session on non-PM
accumulation.
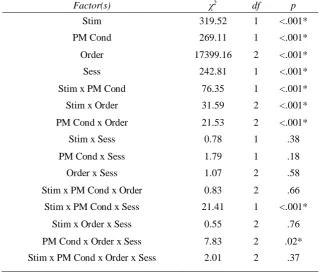
Table S1. Wald Chi-square test of ongoing task (feature classification) mean correct RT, showing significant (*) main effects of Stimulus (Stim), PM Condition (PM Cond), Trial Response Order (Order), and Session (Sess), significant two-way interactions between Stimulus and PM Condition, Stimulus and Trial Response Order, PM Condition and Trial Response Order, and a significant three-way interaction between Stimulus and PM Condition and Session.
Factor(s) χ2 df p
Stim 319.52 1 <.001* PM Cond 269.11 1 <.001* Order 17399.16 2 <.001* Sess 242.81 1 <.001* Stim x PM Cond 76.35 1 <.001* Stim x Order 31.59 2 <.001* PM Cond x Order 21.53 2 <.001* Stim x Sess 0.78 1 .38 PM Cond x Sess 1.79 1 .18 Order x Sess 1.07 2 .58 Stim x PM Cond x Order 0.83 2 .66 Stim x PM Cond x Sess 21.41 1 <.001*
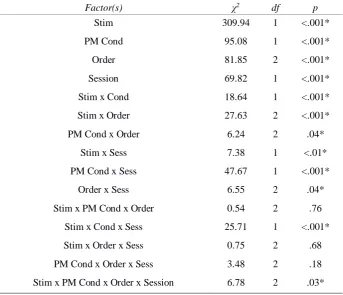
Table S2. Wald Chi-square test of ongoing task (feature classification) accuracy. All main effects and interactions were significant (*), with the exception of the three-way interaction between Stimulus, PM Condition and Trial Response Order, the way interaction between Stimulus, Trial Response Order and Session, and the three-way interaction between PM Condition, Trial Response Order, and Session.
Factor(s) χ2 df p
Stim 309.94 1 <.001* PM Cond 95.08 1 <.001* Order 81.85 2 <.001* Session 69.82 1 <.001* Stim x Cond 18.64 1 <.001* Stim x Order 27.63 2 <.001* PM Cond x Order 6.24 2 .04*
Stim x Sess 7.38 1 <.01* PM Cond x Sess 47.67 1 <.001*
Order x Sess 6.55 2 .04* Stim x PM Cond x Order 0.54 2 .76
Stim x Cond x Sess 25.71 1 <.001* Stim x Order x Sess 0.75 2 .68 PM Cond x Order x Sess 3.48 2 .18 Stim x PM Cond x Order x Session 6.78 2 .03*
Table S3. Wald Chi-square test of PM task mean correct RT, showing significant (*) main effects of Trial Response Order and Session.
Factor(s) χ2 df p
Response Order 1449.54 2 <.001* Session 27.92 1 <.001*
Table S4. Wald Chi-square test of PM task accuracy, showing significant (*) main effects of Stimulus (Stim) and Session (Sess), and a two-way interaction between Stimulus and Session.
Factor(s) χ2 df P
Stim 131.7 1 <.001* Sess 5.71 1 .017* Stim x Sess 5.04 1 .025*
Table S5. Wald Chi-Square Table For 0.1 quantile RTs by Trial Response Order, showing a significant (*) main effect.
Table S6. Pairwise comparisons of ongoing task (feature classification) mean correct RT by Stimulus (target, non-target), PM Condition (control block, PM block), and Session (1,2) with Tukey adjusted p-values. All but five of the comparisons were significant (*): PM target:Control Non-Target, PM non-target:Control non-target, and PM target:PM non-target in Session one; PM target:Control Non-target in Session two; and Control target between session one and session two.
CON TARGET
CON
NON-TARGET PM TARGET
PM NON- TARGET
t p t p t p t p
Session one
CON TARGET --
CON NON-TARGET -12.24 0.00* --
PM TARGET 13.15 0.00* -0.49 1 --
PM NON-TARGET 14.67 0.00* 0.86 0.99 -1.57 .77 --
Session two
CON TARGET --
CON NON-TARGET -6.67 0.00* --
PM TARGET 7.57 0.00* 0.14 1.00 --
PM NON-TARGET 11.82 0.00* 4.39 0.00* -4.91 0.00* --
Session one (rows) vs 2 (columns)
CON TARGET -2.16 0.37 4.50 0.02* 5.15 0.00* 9.39 0.00*
CON NON-TARGET -14.37 0.00* -7.85 0.00* -8.69 0.00* -4.49 0.00*
PM TARGET -15.54 0.00* -8.28 0.00* -9.36 0.00* -4.61 0.00*
PM NON-TARGET -17.86 0.00* -9.75 0.00* -11.09 0.00* -6.28 0.00*
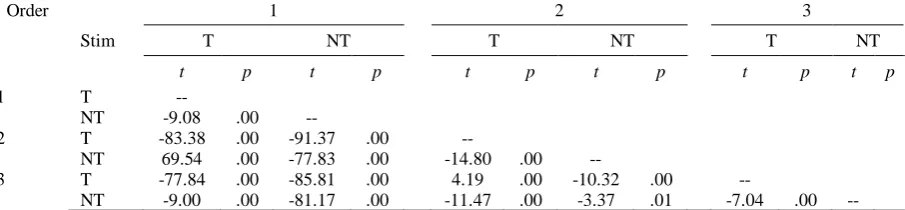
Table S7. Pairwise comparisons of ongoing task (feature classification) mean correct RT by Stimulus (T: target, NT: non-target) and Trial Response Order (1,2,3) with Tukey adjusted p-values. All comparisons were significant.
Order 1 2 3
Stim T NT T NT T NT
t p t p t p t p t p t p
1 T --
NT -9.08 .00 --
2 T -83.38 .00 -91.37 .00 --
NT 69.54 .00 -77.83 .00 -14.80 .00 --
3 T -77.84 .00 -85.81 .00 4.19 .00 -10.32 .00 --
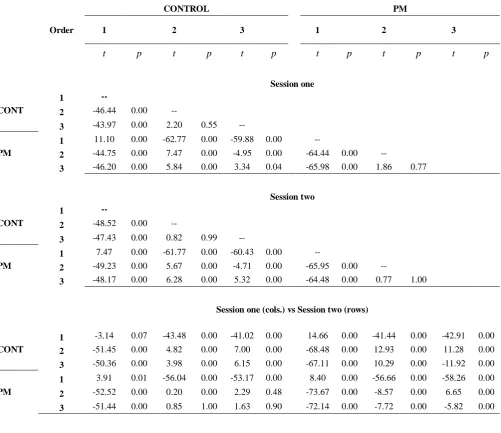
Table S8. Pairwise comparisons of ongoing task (feature classification) mean correct RTs by session (1,2), PM condition (control blocks, PM blocks), and response order (response 1,2,3) with Tukey adjusted p-values. Cell values indicate t-values and p-values for comparison of pairs at the intersection of row and column. Within each session, all comparisons were significant except for response 2,3 in the control and PM conditions. Between sessions, all comparisons were significant except for control response 2 in session one and PM response 3 in session two, control response 3 in session one and PM response 2 in session two, and control response 3 in session one and PM response 3 in session two.
CONTROL PM
Order 1 2 3 1 2 3
t p t p t p t p t p t p
Session one CONT
1 --
2 -46.44 0.00 --
3 -43.97 0.00 2.20 0.55 --
PM
1 11.10 0.00 -62.77 0.00 -59.88 0.00 --
2 -44.75 0.00 7.47 0.00 -4.95 0.00 -64.44 0.00 --
3 -46.20 0.00 5.84 0.00 3.34 0.04 -65.98 0.00 1.86 0.77
Session two CONT
1 --
2 -48.52 0.00 --
3 -47.43 0.00 0.82 0.99 --
PM
1 7.47 0.00 -61.77 0.00 -60.43 0.00 --
2 -49.23 0.00 5.67 0.00 -4.71 0.00 -65.95 0.00 --
3 -48.17 0.00 6.28 0.00 5.32 0.00 -64.48 0.00 0.77 1.00
Session one (cols.) vs Session two (rows)
CONT
1 -3.14 0.07 -43.48 0.00 -41.02 0.00 14.66 0.00 -41.44 0.00 -42.91 0.00
2 -51.45 0.00 4.82 0.00 7.00 0.00 -68.48 0.00 12.93 0.00 11.28 0.00
3 -50.36 0.00 3.98 0.00 6.15 0.00 -67.11 0.00 10.29 0.00 -11.92 0.00
PM
1 3.91 0.01 -56.04 0.00 -53.17 0.00 8.40 0.00 -56.66 0.00 -58.26 0.00
2 -52.52 0.00 0.20 0.00 2.29 0.48 -73.67 0.00 -8.57 0.00 6.65 0.00
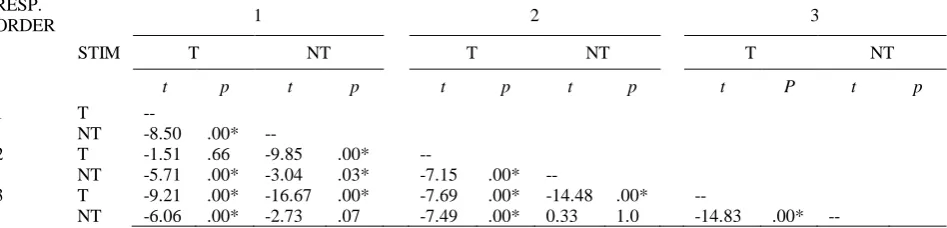
Table S9. Pairwise comparisons for ongoing task (feature classification) accuracy by stimulus (T: target, NT: non-target) and response order (1,2,3) with Tukey adjusted p-values. All comparisons were significant (*) with the exception of Response 1 targets and response 2 targets, Response 1 targets and Response 3 non-targets, and Response 2 non-targets and Response 3 non-targets.
RESP.
ORDER 1 2 3
STIM T NT T NT T NT
t p t p t p t p t P t p
1 T --
NT -8.50 .00* --
2 T -1.51 .66 -9.85 .00* --
NT -5.71 .00* -3.04 .03* -7.15 .00* --
3 T -9.21 .00* -16.67 .00* -7.69 .00* -14.48 .00* --
[image:9.595.65.539.157.271.2]Table S10. Pairwise comparisons for ongoing task (feature classification) accuracy by stimulus (target, non-target), PM condition (control block, PM block), and session (1,2) with Tukey adjusted p-values.
CONT TARGET
CONT
NON-TARGET PM TARGET
PM NON- TARGET
t p t p t p t p
Session one
CONT TARGET --
CONT NON-TARGET -0.44 1.0 --
PM TARGET -13.03 .00* -13.42 .00* --
PM NON-TARGET -2.66 .13 -3.14 .03* -13.08 .00* --
Session two
CONT TARGET --
CONT NON-TARGET -8.33 .00* --
PM TARGET -1.60 .74 -10.39 .00* --
PM NON-TARGET 7.94 .00* -1.87 .56 -10.78 .00* --
Session one (rows) vs two (columns)
CONT TARGET -4.45 .00* -4.89 .00* 8.76 .00* -2.38 .24
CONT NON-TARGET 4.09 .00* 3.66 .01 16.24 .00* 6.97 .00*
PM TARGET -6.43 .00* -6.88 .00* 8.70 .00* -4.62 .00*
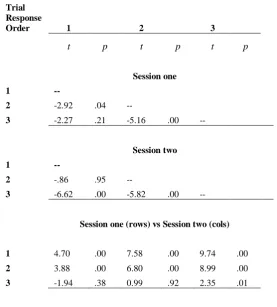
Table S11. Pairwise comparisons of ongoing task (feature classification) accuracy by session (1,2) and response order (response 1,2,3) with Tukey adjusted p-values. Cell values indicate t-values and p-values for comparison of pairs at the intersection of row and column.
Table S12. Contrasts for PM task mean correct RT by response order (1,2,3) with Tukey adjusted p-values, showing significant difference in RT between first and second response, and first and third responses, but not between second and third responses.
Response
Order t p
1 = 2 -32.06 .00* 1 = 3 -32.80 .00* 2 = 3 -1.02 .56
Trial Response
Order 1 2 3
t p t p t p
Session one 1 --
2 -2.92 .04 --
3 -2.27 .21 -5.16 .00 --
Session two 1 --
2 -.86 .95 --
3 -6.62 .00 -5.82 .00 --
Session one (rows) vs Session two (cols)
1 4.70 .00 7.58 .00 9.74 .00
2 3.88 .00 6.80 .00 8.99 .00
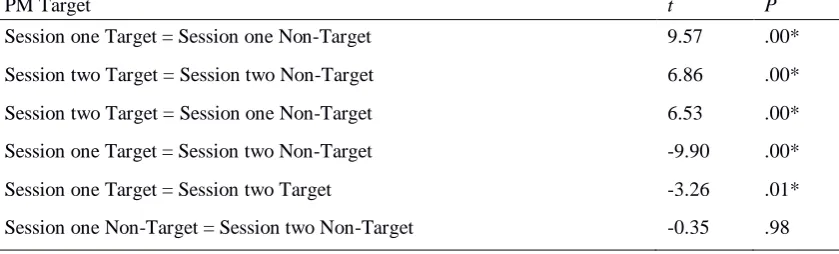
Table S13. Pairwise comparisons for PM task accuracy by stimulus type (target, non-target) and session (1,2) with Tukey adjusted p-values. All comparisons were statistically significant (*) with the exception of PM Non-Target, which did not significantly differ between sessions.
PM Target t P
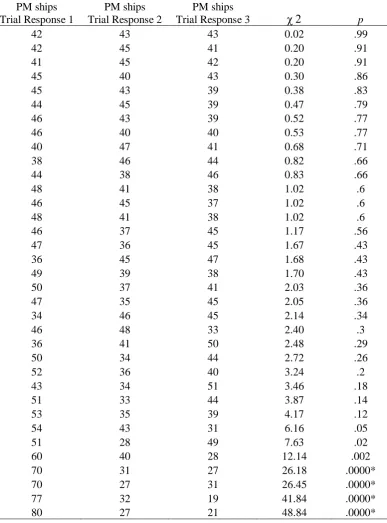
Table S14. Chi-square tests on the frequency with which PM ships were responded to first, second, or third within a trial. Each row corresponds to one participant. The proportion calculated for the null was the total proportion of first, second, and third trial responses made (very close to one third for each, but not exactly equal due to non-responses). Four chi-squares were statistically significant (*) at the family wise alpha of .0014 (which is .05/35). All four of these participants had responded to PM ships first in at trial substantially more often than second or third.
PM ships Trial Response 1
PM ships Trial Response 2
PM ships
Trial Response 3
χ 2
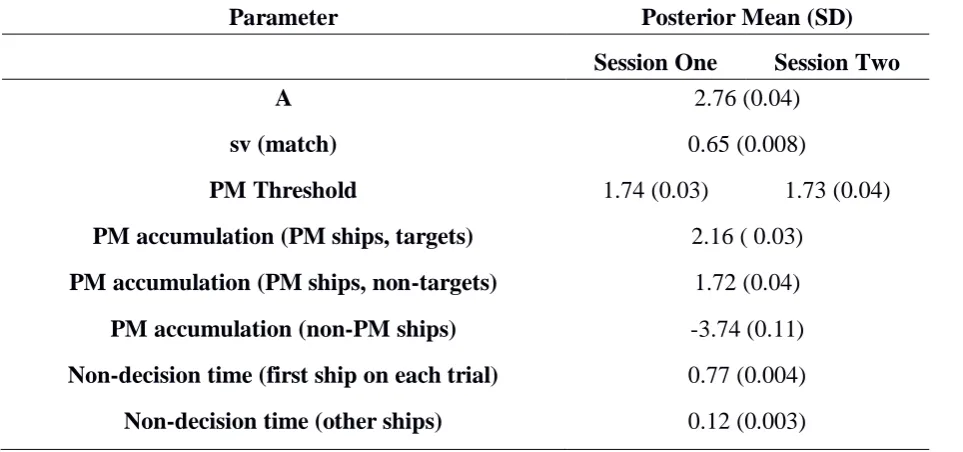
pTable S15. Posterior M (SD) of model parameters for an expanded model that includes an effect of session on mean non-PM accumulation rates. The statistics were calculated on the group-averaged posterior distribution, which is obtained by averaging each posterior sample across all participants.